0095-1137/04/$08.00⫹0 DOI: 10.1128/JCM.42.12.5502–5511.2004
Copyright © 2004, American Society for Microbiology. All Rights Reserved.
Exploration of Biases That Affect the Interpretation of Restriction
Fragment Patterns Produced by Pulsed-Field Gel Electrophoresis
Randall S. Singer,
1,2* William M. Sischo,
3and Tim E. Carpenter
1Department of Medicine and Epidemiology1and Department of Population Health and Reproduction,3School of
Veterinary Medicine, University of California, Davis, California, and Department of Veterinary and Biomedical Sciences, College of Veterinary Medicine, University of Minnesota, St. Paul, Minnesota2
Received 24 December 2003/Returned for modification 10 February 2004/Accepted 17 August 2004
Pulsed-field gel electrophoresis (PFGE) has been used extensively in epidemiological investigations of bacteria, especially during food-borne outbreaks or nosocomial infections. The relationship between similar-ities in PFGE patterns and true genetic relatedness is poorly understood. In this study, computer-simulated
populations ofEscherichia coliisolates were created by mutating the sequence ofE. coliK-12 strain MG1655.
The simulated populations of isolates were then digested, again through simulation, with different restriction enzymes and were analyzed for their relatedness by different techniques. Errors associated with band deter-mination and band matching were incorporated into the analyses, as both of these error types have been shown to affect PFGE interpretations. These errors increased the apparent similarities of the isolates. The use of multiple enzymes improved the fidelity between the results of PFGE analyses and the true sequence similar-ities. These findings, when they are combined with results from laboratory studies, emphasize the need for the inclusion of multiple enzymes and additional epidemiological data in order to make more accurate interpretations.
The ability to assess the relatedness of organisms is critical in many different applications. In studies of bacterial food-borne outbreaks or nosocomial infections, the goal is to distinguish among organisms that may be associated with the outbreak in order to identify the source of the bacterium and describe the bacterial transmission dynamics (1, 8, 13, 18, 22, 29). In eco-logic studies, determination of the phylogenetic relationships among spatially and temporally distinct organisms is a goal (14, 21, 23, 24, 32). In order to pursue these goals, DNA finger-printing has become the primary methodology for distinguish-ing the relatedness of bacterial organisms.
The digestion of DNA by restriction endonucleases (REs) is one of the most commonly used DNA fingerprinting tech-niques, and specifically, pulsed-field gel electrophoresis (PFGE) is the primary method that uses REs with bacteria (3, 4, 28). PFGE involves the digestion of chromosomal DNA by specific REs to create large restriction fragments, typically in the range of 10 to 800 kb (4, 28). Electrophoresis of these fragments allows the visualization of a restriction fragment pattern (RFP) that comprises a series of bands, with each band representing a sized piece of DNA. The relationship between bacterial isolates is inferred by the similarities of the RFPs.
RFPs are primarily evaluated by two methods. The first assesses the relatedness of bacterial strains by determining the number of band differences between each pair of isolates (27, 28). The guidelines for this analysis are intended only to assess epidemiologically related strains, as would occur during an outbreak investigation. The interpretation of the number of
band differences between a pair of isolates is based on the minimum number of genetic mutational events that would result in the observed number of band differences. For exam-ple, two isolates that differ by two to three bands would be considered closely related because a single genetic event can explain this difference.
The second analytic method is calculation of the band-shar-ing similarity coefficients, which represent continuous rather than categorical measures of relatedness. Briefly, each organ-ism within the population of isolates being studied generates an RFP. The RFP for each isolate is then compared in a pairwise fashion to that for another isolate, and the number of bands shared by each pair of isolates is calculated. The number of bands in each RFP and the number of shared bands are then used to calculate the band-sharing coefficient. Ultimately, a matrix of band-sharing coefficients between all pairwise com-parisons of isolates is used in a cluster analysis, and a rooted dendrogram that graphically depicts the relatedness of organ-isms can be produced.
The uses of PFGE in DNA fingerprinting are much broader than the simple assessment of the relationships of outbreak strains. PFGE is widely used to compare bacterial isolates collected over variable spatial and temporal scales. For exam-ple, the National Molecular Subtyping Network for Foodborne Disease Surveillance (PulseNet), sponsored by the Centers for Disease Control and Prevention, analyzes bacterial isolates from many laboratories in the United States as well as Canada (26). The objective is to rapidly assess the DNA fingerprints of isolates from disease outbreaks and follow-up isolates, even if the cases are geographically and temporally unrelated. Given the importance of the accurate assessment of the relationships of these isolates, particularly when distance and time separate the isolate sources, it is critical to have a thorough
understand-* Corresponding author. Mailing address: Department of Veteri-nary and Biomedical Sciences, College of VeteriVeteri-nary Medicine, Uni-versity of Minnesota, 300A VSB, 1971 Commonwealth Ave., St. Paul, MN 55108. Phone: (612) 625-6271. Fax: (612) 625-5203. E-mail: [email protected].
5502
on May 15, 2020 by guest
http://jcm.asm.org/
ing of the potential biases inherent in PFGE data collection and analysis.
In practice, the use of PFGE as a DNA fingerprinting tech-nique requires many subjective decisions to be made. This subjectivity increases the variability of the results among stud-ies and, consequently, affects how those results are interpreted. Some of these decisions include selection of the specific RE and the number of different REs to be used, determination of the numbers and positions of the bands on the gel, determi-nation of which bands are different or identical between dif-ferent isolates, and the analytical techniques selected to assess the relatedness of isolates.
A number of methods for the analysis of PFGE data are available. For example, the software package BioNumerics (Applied Maths, Inc., Austin, Tex.) contains different algo-rithms for the importation of a gel image and normalization of the lanes in the gel and can be used to assess the similarity among the isolates and to construct dendrograms. While this affords the investigator flexibility in analyzing the data, it also engenders confusion about the use of different analytical tech-niques and their relationship to one another. This leads to uncertainty about the utility of one or more enzymes, which similarity (or dissimilarity) coefficients should be used, how misclassification errors should be accounted for during the process of band matching, and how inferences about the relat-edness of isolates should be made by use of the analytical techniques chosen. The objectives of this study were (i) to compare the results of two analytical techniques commonly used with PFGE with populations of isolates for which the entire genetic sequence is known and (ii) to assess the im-provement in interpretation when different numbers and com-binations of enzymes are used for each isolate.
MATERIALS AND METHODS
Creation and digestion of simulatedEscherichia coliisolates.The entire
ge-netic sequence ofE. coliK-12 strain MG1655 was obtained (E. coliGenome
Project, University of Wisconsin, Madison) (2). The sequence consisted of 4,639,221 bases, and the isolate served as the reference isolate for all analyses in this study. By simulating mutation events in the reference isolate, two isolate populations were created. By using a standard computer package (Microsoft Access; Microsoft Corp., Redmond, Wash.) and a program written in Visual Basic (version 6.0; Microsoft Corp.), each base in the reference strain genome sequence was subject to random mutation. The probability of a mutation was equal to the difference between strains predetermined for the study. For exam-ple, if the isolate was to be 0.1% different from the reference strain, each base had a 0.1% probability of mutation. Only point mutations were considered; insertions, deletions, and other genetic mutations were not simulated in this model. In addition, all bases had an equal probability of mutation; we did not simulate conserved or variable regions of the genome. The base that was mutated had an equal probability of being replaced by one of the remaining three bases. The mutation probabilities were selected with the following underlying principle. We expected 20 to 30 bands for each enzyme digestion. This implies that ap-proximately 200 bases are located within restriction sites for each enzyme. Con-sequently, by assuming a binomial distribution of mutations and a 0.1% proba-bility of mutation at each of the 200 bases, there is an 18% probaproba-bility that a mutation will occur within at least one of the restriction sites for each enzyme. The first population (the outbreak population) was used for simulation of an
epidemiologic trace-back investigation in which the referenceE. colisequence
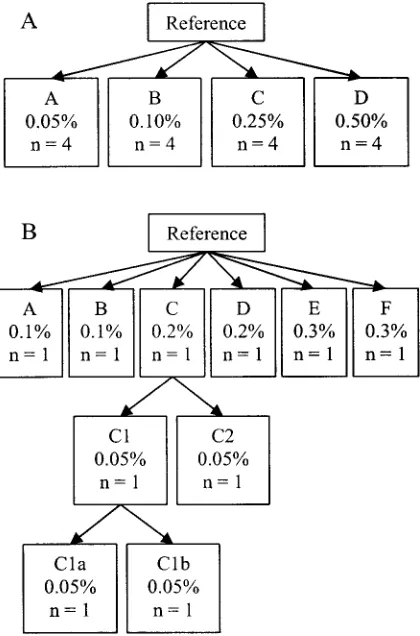
was the outbreak strain (27, 28). This population consisted of the reference isolate plus an additional 16 isolates. The 16 additional isolates were indepen-dently generated from the initial reference isolate as described above. In this way, each isolate was unique and had a predetermined expected similarity to the reference isolate. We created four sets of four isolates in which each isolate differed on average from the reference isolate by 0.05, 0.1, 0.25, and 0.5%, respectively. The relationship between these isolates is shown in Fig. 1A.
The second population of isolates (the ecological population) simulated a
group of spatially and temporally unrelatedE. coliisolates. For this population,
six isolates were first independently mutated from the reference strain (the same reference strain used in the outbreak population). The expected average
differ-ences of these isolates from the reference isolate were 0.1% (n⫽2), 0.2% (n⫽
2), and 0.3% (n⫽2). Two additional isolates were then created from each of
these six isolates through a random probability of mutation of 0.05%. Each of the resulting 12 isolates was then mutated with a random probability of 0.05% to create 2 additional isolates. The total ecological population consisted of 43
isolates (1⫹6⫹12⫹24). The relationship between these isolates is shown in
Fig. 1B.
[image:2.585.317.527.70.388.2]The number of base differences between each pair of isolates was calculated by using the program written in Visual Basic. This allowed the sequence similarity between each pair of isolates to be calculated. In this calculation, the similarity between each isolate and the reference isolate would be expected to be very close to the predetermined probability of random mutation. However, the similarity between each of the simulated isolates was more uncertain. The sequence dis-similarity was calculated as the number of base differences between the pair of isolates divided by the total number of bases (which was fixed due to the absence of insertions and deletions). One minus the dissimilarity provided the sequence similarity, which served as the “gold standard” of the similarity between each pair
FIG. 1. Relationships of the isolates in the two populations. The outbreak population (A) consisted of the reference isolate plus an additional 16 isolates (17 isolates in total), each of which differed from the reference isolate by a certain amount. The percentage represents the probability of mutation of each base position and, therefore, is approximately equal to the overall sequence difference between the reference isolate and the simulated isolate. The ecological population (B) consisted of the reference isolate, 6 isolates that were simulated from the reference isolate, 2 isolates that were simulated for each of the isolates simulated in the first step, and then an additional 2 isolates that were simulated from the isolates at the second step (43 isolates in total). The complete branching structure is shown only for isolate C1 but was identical for all isolates, isolates A through F.
on May 15, 2020 by guest
http://jcm.asm.org/
of isolates and as the reference coefficient against which all other similarity coefficients were compared.
The digestion of each isolate with three different REs was simulated by using
the known properties of three enzymes: XbaI (T2CTAGA), NotI
(CG2GGCCGC), and SfiI (GGCCNNNN2NGGCC). These three REs were
chosen because they are frequently used to digestE. colifor PFGE studies and
because each results in a different number of expected bands per isolate (23, 24, 27, 28). XbaI recognizes a sequence of 6 bp (TCTAGA), while NotI (GCGGC CGC) and SfiI (GGCCNNNNNGGCC, where N is any nucleotide) each recog-nize a sequence of 8 bp. All simulated digestions were made with a program written in Visual Basic. With this program, the restriction fragments (sizes and nucleic acid contents) for each isolate and each enzyme were determined. This information was saved in a database (Microsoft Access; Microsoft Corp.).
Defining the RFP for each isolate.The RFP of an isolate was defined by using four approaches. The first approach (the COMP approach) defined an RFP by using the complete set of restriction fragments generated in the digestion. In addition, the comparison of isolates in the data set used for the COMP approach (the COMP data set) required that matching fragments contain the same number of nucleotides (exact size) with perfect sequence identity (same region of the genome). The second approach (the REST approach) defined an RFP by re-stricting the fragments that were analyzed to those that were greater than 25 kb and less than 700 kb. In practice it is common to use a minimum-size cutoff (e.g., 25 kb) to eliminate the possibility of including plasmid DNA in the analyses (28). The 700-kb cutoff was applied because typical electrophoresis conditions do not allow the larger bands to migrate far enough into the gel to be resolved. The comparison of the REST data set also required a perfect size and sequence match between fragments of different isolates. These two methods were used to generate data sets for both the outbreak and the ecological populations of isolates by using the three REs separately and in combination.
The third and fourth approaches incorporated two sources of error inherent in PFGE analyses (12, 28, 30). The first error occurs because multiple restriction fragments of approximately the same size may exist for a single isolate but are counted as a single fragment. This superimposition of bands is an intraisolate or an intralane type of error. In this analysis, if two fragments of an isolate pos-sessed a relative size difference of less than 5%, they were considered a single band. The second error occurs because bands of similar sizes among different isolates are counted as identical bands, regardless of their genomic contents. This is an interisolate or an interlane type of error. In this analysis, if two bands for different isolates possessed a relative size difference of less than 5%, they were considered matching bands.
By using the outbreak and the ecological populations of isolates, these errors formed the basis of the third and fourth approaches for defining an RFP. The third approach (the IMP-COMP approach) used all of the restriction fragments used in the COMP approach, while the fourth approach (the IMP-REST ap-proach) used the restricted fragment sets used in the REST approach. It was expected that these two misclassification errors would result in an underestima-tion of the diversity of the isolate set and a misclassificaunderestima-tion of the relaunderestima-tionships among the isolates.
Assessments of similarity between isolates.Two analytic methods were used to assess the relationship between isolates within a data set. The first was a quali-tative method based on the number of genetic mutational events required to produce specific differences in PFGE patterns (28). The method classifies groups of isolates into four categories: indistinguishable, closely related, possibly re-lated, and different. Isolates with no band differences are classified as “indistin-guishable.” “Closely related” isolates exhibit two to three band differences. This category suggests either that a single genetic event occurred within a restriction site and resulted in either the loss or the gain of a restriction site (three band differences) or that an insertion or deletion of genetic material changed the size of the restriction fragment (two band differences). “Possibly related” isolates exhibit four to six band differences, a theoretical result of two genetic mutational events. “Different” isolates exhibit more than six band differences. Although this method was developed to compare isolates within an outbreak that spans a narrow temporal window, the method has been used inappropriately to compare populations of unrelated isolates (14, 19, 25, 31). We applied this method only to the REST and IMP-REST data sets for the outbreak and ecological populations. By this method, each isolate was compared to the reference strain, resulting in 16 and 42 comparisons in the outbreak and ecological populations, respectively.
The second method used the entire restriction fragment information gener-ated from each enzyme for each isolate to calculate similarity indices by using the
Dice coefficient. The Dice coefficient (SD) (7) is calculated as [2(nAB)]/(nA⫹nB),
wherenABis the number of bands common to isolatesAandB,nAis the total
number of bands for isolateA, andnBis the total number of bands for isolateB.
Dice coefficients were calculated for the pairwise comparisons of all isolates
within a data set for each enzyme. Coefficients were then calculated for all combinations of the enzymes. For the multiple-enzyme coefficients, the total number of matching bands for each enzyme comprised the numerator, while the denominator consisted of the total number of bands for each isolate and each enzyme.
Assessment of analytical techniques.In order to determine the fidelity of the band-sharing coefficients to the gold standard of sequence similarity, the lower diagonal matrices of the pairwise band-sharing coefficients were compared to the lower diagonal matrices of pairwise sequence similarities. There were 136 and 903 pairwise comparisons for the outbreak and ecological populations, respec-tively. The correlations between the matrices were calculated by using Mantel’s
randomization test (17), withPvalues estimated by using 5,000 permutations.
Dendrograms were constructed only as a visual aid to depict the relationship between isolates for each of the populations and analyses. First, a dendrogram was constructed for each population of isolates by using the entire sequence data for each isolate in the population. A second dendrogram was constructed by using the band-sharing coefficient data from all analyses. The unweighted pair group method with average linkages (UPGMA) was used with the program PHYLIP Neighbor (11). All dendrograms were then visualized with the software TREEVIEW (20).
RESULTS
Simulated digestion of reference strain. In the simulated
digestion of the reference strain with only the fragments be-tween 25 and 700 kb (the REST data set), we observed 33 fragments with XbaI, 27 with SfiI, and 20 with NotI. Published data for E. coliindicate that XbaI should produce approxi-mately 20 fragments in the 10- to 500-kb range, SfiI should produce approximately 15 to 20 fragments in the 10- to 700-kb range, and NotI should produce approximately 12 to 15 frag-ments in the 10- to 1,000-kb range (28). The difference be-tween our data and the published results is due to the fact that many restriction fragments in this isolate are of similar sizes. For example, in the NotI digestion, the reference strain had fragments of 248, 250, 250, 261, 273, and 281 kb, which would be difficult to distinguish on a PFGE gel.
Relationships within simulatedE. colipopulations.For the
[image:3.585.338.495.68.273.2]simulated populations ofE. coliisolates, dendrograms based
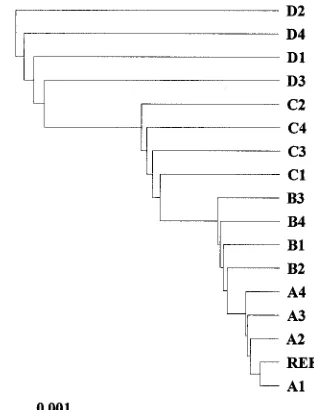
FIG. 2. Dendrogram depicting the relatedness of the outbreak population of isolates. Relationships are based on the sequence simi-larity of isolates, and the dendrogram was generated by UPGMA clustering. REF, reference isolate.
on May 15, 2020 by guest
http://jcm.asm.org/
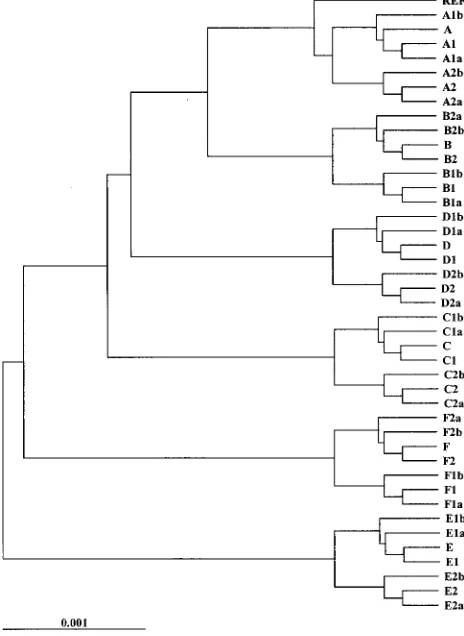
on the sequence similarity matrices for each population were constructed (Fig. 2 and 3). The similarity matrices generated in these analyses were the gold standard to which subsequent band-sharing analyses were compared. The dendrograms were not used for analysis; they were used only to visually compare the inferred relationships of the isolates.
Qualitative comparisons.By using the number of band
dif-ferences between isolates (27, 28), all isolates in the REST and IMP-REST data sets for the outbreak and ecological popula-tions were compared to the reference strain. The same pair-wise comparisons (16 for the outbreak population and 42 for the ecological population) were made for each enzyme in each data set, but depending on which enzyme was used, the puta-tive relationships were very different. For the outbreak popu-lation (Table 1), the interpretation from the XbaI digestion of the REST data set would be that only 2 of the 16 isolates were indistinguishable or closely related to the reference strain. In contrast, for SfiI 8 of the 16 comparisons were interpreted as indistinguishable or closely related. Overall, the isolates ap-peared to be more closely related when imperfect matching was used (Tables 1 and 2).
In general, the inferred relationships from the qualitative analyses with the perfectly matched outbreak data sets were correlated to the true population relationships based on se-quence similarity. In the XbaI digestion, the sese-quences of both
indistinguishable isolates differed from that of the reference strain by approximately 0.05%. The sequences of the indistin-guishable isolates in the NotI digestion also differed from that of the reference strain by approximately 0.05%, but in the SfiI digestion, the sequence of the indistinguishable isolates dif-fered from that of the reference strain by⬍0.1%. In addition, one isolate in the SfiI digestion was considered indistinguish-able from the reference strain, but its sequence differed from that of the reference strain by 0.5%. In our analysis of the ecological population (Table 2), there were considerable dif-ferences among the enzymes. None of the isolates in the XbaI digestion would be considered either indistinguishable or closely related; the SfiI digestion, on the other hand, had 12 indistinguishable isolates and 2 isolates that were closely re-lated to the reference strain.
The relationships inferred from the analyses with the imper-fectly matched data sets were not as well correlated to the true relationships as the relationships inferred from the analyses with the perfectly matched data sets. Many of the indistinguish-able and closely related isolates in these analyses were distantly related to the reference strain, especially the isolates in the ecological population. Many of the analyses added isolates to the indistinguishable and closely related categories that were more distantly related to the reference strain than the relation-ship inferred in the perfectly matched analyses (Tables 1 and 2). The indistinguishable category, however, was more consis-tent in the outbreak population than in the ecological popula-tion of isolates; only one addipopula-tional isolate was in this category for two of the digestions for the outbreak population by the IMP-REST approach, whereas seven and eight additional
[image:4.585.46.278.73.391.2]iso-FIG. 3. Dendrogram depicting the relatedness of the ecological population of isolates. Relationships are based on the sequence simi-larity of isolates, and the dendrogram was generated by UPGMA clustering. REF, reference isolate.
TABLE 1. Number of pairwise comparisons that fell within each of the band difference categories as set by the PFGE guidelinesa
No. of band differences
No. of pairwise comparisons obtained with the following enzyme:
XbaI NotI SfiI
REST IMP-REST REST IMP-REST REST IMP-REST
0 2 3 3 4 7 7
2–3 0 5 3 5 1 7
4–6 3 3 4 7 3 1
ⱖ7 11 5 6 0 5 1
aA total of 16 isolates in the outbreak population were compared to the
reference strain by using both the perfect (REST approach) and the imperfect (IMP-REST approach) matching criteria.
TABLE 2. Number of pairwise comparisons that fell within each of the band difference categories as set by the PFGE guidelinesa
No. of band differences
No. of pairwise comparisons obtained with the following enzyme:
XbaI NotI SfiI
REST IMP-REST REST IMP-REST REST IMP-REST
0 0 0 3 11 12 19
2–3 0 0 12 17 2 10
4–6 0 25 12 10 14 13
ⱖ7 42 17 15 4 14 0
aA total of 42 isolates in the ecological population were compared to the
reference strain by using both the perfect (REST approach) and the imperfect (IMP-REST approach) matching criteria.
on May 15, 2020 by guest
http://jcm.asm.org/
[image:4.585.300.542.91.184.2] [image:4.585.301.541.607.700.2]lates were included in this category for two of the enzyme digestions for the ecological population. In general, the pro-portion of isolates considered indistinguishable or closely re-lated was inversely rere-lated to the number of fragments pro-duced by the enzyme digestion.
Quantitative comparisons. Dendrograms based on the
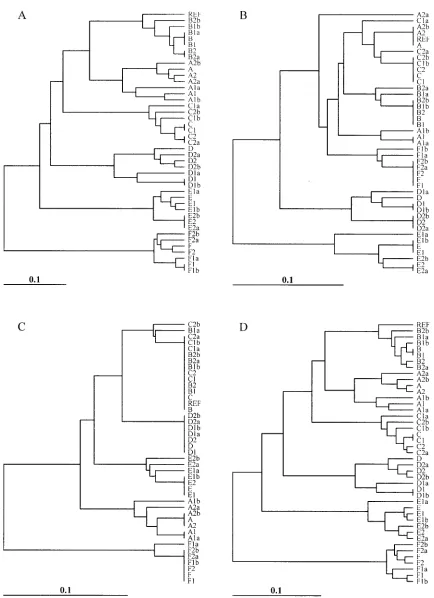
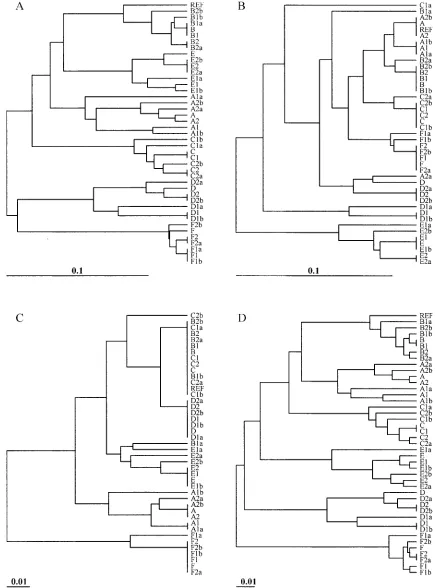
band-sharing similarity coefficients for both the outbreak and the ecological populations were created. A set of dendrograms obtained for different endonuclease digestions with the REST and IMP-REST data sets is shown (Fig. 4 to 7). In addition, dendrograms representing the results of the multiple-enzyme digestions are also shown (Fig. 4 to 7). The dendrograms from these data sets were compared to the dendrograms created from the sequence data in order to visualize the inferred rela-tionships among the isolates in each analysis. The Mantel cor-relation coefficients for each band-sharing similarity coefficient matrix with the sequence similarity matrix are shown for the outbreak and the ecological populations (Fig. 8).
With the outbreak population of isolates, XbaI was always superior to NotI and SfiI in the analyses with single enzymes. For the REST data set, there was almost a 90% correlation
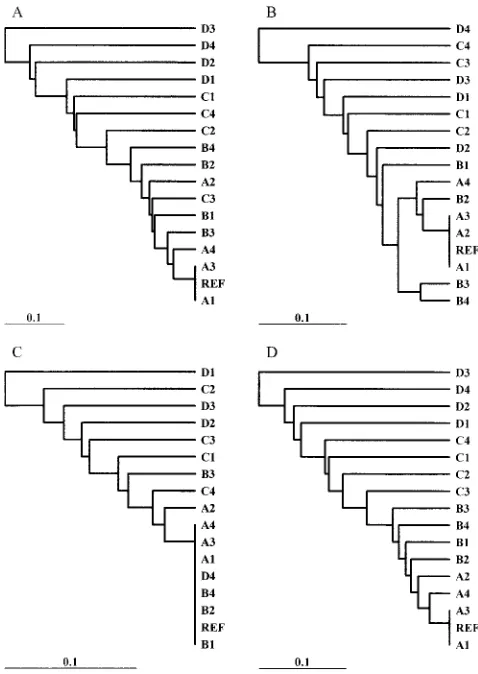
between the matrix of XbaI band-sharing coefficients and the matrix of sequence similarity coefficients (Fig. 8A), whereas NotI and SfiI had correlation coefficients less than 80%. The differences from 1.0 (perfect correlation) observed for all co-efficients were statistically significant (P ⬍ 0.0005). For the IMP-REST data set, all correlation coefficients experienced relative reductions of approximately 10 to 15% (Fig. 8A), but XbaI was still superior in single-enzyme digestions. In addition, multienzyme analyses that included XbaI were superior for both the REST and the IMP-REST data sets (Fig. 8A). Al-though the dendrograms did not agree on the relationships among the isolates, the XbaI-based dendrograms most closely resembled the sequence-based dendrograms (Fig. 4 and 5 com-pared to Fig. 2). The dendrograms based on analyses by the IMP-REST approach (Fig. 5) have a larger genetic distance scale than the dendrograms based on analyses by the perfectly matching REST approach (Fig. 4). This implies that the iso-lates appear to be more similar to each other than suggested by the perfect matching analyses.
In the ecological population of isolates, XbaI was again
[image:5.585.42.281.68.405.2]supe-FIG. 4. Dendrograms depicting the relatedness of the outbreak population of isolates and perfect matching. The four different analy-ses included digestion of the REST data set with XbaI (A); digestion of the REST data set with NotI (B); digestion of the REST data set with SfiI (C); and digestion of the REST data set with XbaI, NotI, and SfiI (D). Relationships are based on the matrices of band-sharing similarity coefficients among isolates, and the dendrogram was gener-ated by UPGMA clustering. REF, reference isolate.
FIG. 5. Dendrograms depicting the relatedness of the outbreak pop-ulation of isolates and imperfect matching. The four different analyses included digestion of the IMP-REST data set with XbaI (A); digestion of the IMP-REST data set with NotI (B); digestion of the IMP-REST data set with SfiI (C); and digestion of the IMP-REST data set with XbaI, NotI, and SfiI (D). Relationships are based on the matrices of band-sharing similarity coefficients among isolates, and the dendrogram was generated by UPGMA clustering. REF, reference isolate.
on May 15, 2020 by guest
http://jcm.asm.org/
[image:5.585.300.538.314.651.2]FIG. 6. Dendrograms depicting the relatedness of the ecological population of isolates and perfect matching. The four different analyses included digestion of the REST data set with XbaI (A); digestion of the REST data set with NotI (B); digestion of the REST data set with SfiI (C); and digestion of the REST data set with XbaI, NotI, and SfiI (D). Relationships are based on the matrices of band-sharing similarity coefficients among isolates, and the dendrogram was generated by UPGMA clustering. REF, reference isolate.
on May 15, 2020 by guest
http://jcm.asm.org/
FIG. 7. Dendrograms depicting the relatedness of the ecological population of isolates and imperfect matching. The four different analyses included digestion of the IMP-REST data set with XbaI (A); digestion of the IMP-REST data set with NotI (B); digestion of the IMP-REST data set with SfiI (C); and digestion of the IMP-REST data set with XbaI, NotI, and SfiI (D). Relationships are based on the matrices of band-sharing similarity coefficients among isolates, and the dendrogram was generated by UPGMA clustering. REF, reference isolate.
on May 15, 2020 by guest
http://jcm.asm.org/
rior to NotI and SfiI in the single-enzyme analyses. For the REST data set, there was greater than a 90% correlation between the matrix of XbaI band-sharing coefficients and the matrix of se-quence similarity coefficients (Fig. 8B). The differences from 1.0 (perfect correlation) observed for all coefficients were statistically significant (P⬍0.0005). For the IMP-REST data set, the corre-lation between the XbaI band-sharing coefficients and the se-quence similarity coefficients dropped considerably, and the NotI band-sharing coefficients had a higher correlation with the se-quence data (Fig. 8B). The multienzyme analyses that included XbaI and NotI were superior for all data sets (Fig. 8B).
DISCUSSION
This study evaluated the efficacy of PFGE to determine the true relationships between two simulated bacterial populations
with known genetic differences. The first population was used to represent the relationships between outbreak strains, and the second population was used to represent relationships be-tween diverging strains. The study evaluated PFGE analyses without errors as well as analyses with the incorporation of errors in both fragment content and determination. The study also compared the use of multiple REs in single-enzyme anal-yses or in analanal-yses with combinations of enzymes.
Even under the unrealistic constraints of perfect matching, PFGE assessments did not re-create the phylogenetic relation-ships of the simulated populations. This difference was even more pronounced in the IMP-REST data sets, which repre-sented the more relevant and realistic type of PFGE data that are being generated and analyzed in the laboratory. Conse-quently, the results and interpretations of the REST and IMP-REST data sets were emphasized in this study.
FIG. 8. Mantel’s randomization test correlation coefficients for the complete and restricted analyses of each enzyme combination with the outbreak population (A) and the ecological population (B). All correlation coefficients were statistically significant (P⬍0.0005).
on May 15, 2020 by guest
http://jcm.asm.org/
The correlation of the true phylogeny and that predicted by PFGE depended on the choice of enzyme or enzymes and analytic method. Fidelity between the phylogeny predicted by PFGE and the true phylogeny improved with the use of mul-tiple enzymes (Fig. 8). However, the use of mulmul-tiple enzymes can be costly in terms of time and money. If a single enzyme were to be used with the 17 isolates in the outbreak population, the decision of which enzyme to use would have greatly af-fected the epidemiological inferences. When XbaI was used in the perfectly matched REST analysis (Table 1), only two of the isolates would have been considered indistinguishable, none of the isolates would have been considered closely related, and three would have been possibly related. These numbers changed dramatically when one of the enzymes that recognized a sequence of 8 bp was used. The same patterns were observed in the imperfectly matched analyses. If these isolates were collected as part of a trace back during a food-borne outbreak, the choice of enzyme would have directly influenced our as-sessment of which isolates were part of the outbreak, and thus, the choice of enzyme could have serious repercussions regard-ing the identification of the source of the pathogen.
In RFP analyses the subjective process of band determina-tion is critical and cannot be ignored (12, 28, 30). Conse-quently, we incorporated various types of errors into our anal-yses. The divergence from the true phylogeny became more severe as errors of content and determination were simulated. For example, we ignored the genetic contents of the restriction fragments and accounted only for the sizes of the fragments. Many bands that were generated by the three enzymes used in this study were of the same relative size but were derived from different segments of the genome. These superimposed bands would be difficult to distinguish by standard PFGE protocols. This finding was documented in a PFGE analysis ofE. coli O157 by Davis et al. (6). In addition, in many situations two isolates had bands of almost the same size but originated from completely different segments of the genome. This would re-sult in the false assignment of a band match between the two isolates. Davis et al. (6) also documented this type of error in the previously mentioned study withE. coliO157. This error is similar to the user-specified tolerance factor that is incorpo-rated into many of the DNA fingerprint analysis software pack-ages (5, 10, 12). The tolerance factor, however, is based on a difference in linear position on the gel rather than on the strict difference in fragment size.
When imperfect matching error was incorporated into the analyses, isolates appeared to be more similar to each other (Fig. 5 and 7). In the dendrograms constructed with imperfect matching (Fig. 5 and 7), all of the isolates were more similar to each other than they were in the dendrograms that used per-fect matching (Fig. 4 and 6). If the number of isolates that have at least 80% similarity with the reference strain is tabulated for each enzyme analysis, this number is consistently higher in the imperfectly matched (IMP) data sets than in the perfectly matched datasets. The correlations between the similarity co-efficients and the underlying sequence data become dramati-cally reduced when imperfect matching is used. Finally, the number of isolates that were indistinguishable in the qualita-tive analyses increased in the imperfectly matched analysis compared to the number in the perfectly matched analysis (Tables 1 and 2). This finding was most noticeable for the
ecological population. Although the criteria of Tenover et al. (27, 28) were not intended to be used in diversity analyses (as illustrated by the ecological population), many researchers in-appropriately continue to do so (14, 19, 25, 31).
Additional sources of error can affect the interpretation of PFGE patterns. Variability within and among gels can result in bands of identical genetic information and sizes migrating dif-ferent relative distances on their respective gels and, thus, being classified as different bands (10). The incorporation of plasmid DNA into the PFGE analysis can lead to biased in-ferences; the goal of these DNA fingerprinting analyses is to demonstrate the relationships among isolates by using chro-mosomal DNA. Gains and losses of plasmids can obscure the relationships among isolates, and this effect might be most problematic during a trace-back investigation during an out-break. We did not address the latter issues in the present simulation model.
We observed that the enzyme that produced the most frag-ments, XbaI, had the highest fidelity with the sequence data in all analyses. However, the more fragments that an enzyme produces, the more chances there are for misclassification er-rors (6). When the imperfectly matched analyses were per-formed, XbaI and SfiI, both of which generated many frag-ments, had the highest proportionate decreases in correlation between band-sharing similarity and sequence similarity. The use of a frequently cutting enzyme may make gels difficult to interpret accurately.
The creation of the isolates in this study was done by using random point mutations throughout the genome. As described above, the probabilities of mutation were chosen with the goal being a desired probability of obtaining a mutation within a restriction site. Because each restriction enzyme had approxi-mately 200 bases in targeted restriction sites, a 0.05% proba-bility of random mutation provided an approximately 10% probability of a point mutation within a restriction site. In addition, these random point mutations provided the possibil-ity of creating new restriction sites within the genome. In the course of randomly assigning base mutations, we did not ac-count for conservative versus variable regions in the genome. All bases had the same probability of mutating, and if a mu-tation occurred, all three remaining bases had an equal prob-ability of replacing the original base. Again, this is not realistic, and in a recent study ofE. coli sequence evolution over ex-tended periods, point mutations were rare (16). If we were to use these calculations (9, 16), then we would require more than 106generations to achieve the 0.05% mutation probability. We
did not incorporate insertions, deletions, or other mutational events into the model. In reality, insertions and deletions may be responsible for the majority of RFP differences among isolates. For example, in a study of E. coli O157 (15), the majority of differences in XbaI PFGE patterns were due to insertions and deletions. These insertions and deletions are likely to result in more frequent errors in band matching. Our use of point mutations might represent a conservative illustra-tion of the difficulties in assessing genetic relaillustra-tionships through PFGE. While the assumptions of this model do not reflect the dynamics ofE. coligenetic evolution, the model that we de-veloped enabled us to map simulated genomic changes and allowed us to make inferences about the use of PFGE as a tool to assess isolate relationships.
on May 15, 2020 by guest
http://jcm.asm.org/
The key point of RFPs in general and PFGE specifically is that while the data infer genetic relationships between isolates, they do not necessarily represent true genetic relationships (6). Differences in RFPs indicate that isolates are genetically dif-ferent, but the true degree of the genetic distance separating these isolates cannot be determined from RFPs. In contrast, similarities in RFPs do not necessarily mean that isolates are genetically similar. As the number of REs included in PFGE increases, the correlation between RFP similarity and true genetic similarity is likely to increase (6). However, the con-clusions drawn from any molecular study must be put in the context of the other information associated with the isolates. The strength of isolate identity is greatest when epidemiologic data support point source or common elements of dissemina-tion. Because of the high degree of subjectivity involved with the interpretation of RFPs, the user must carefully and thoughtfully select the conditions and techniques for perform-ing, analyzperform-ing, and using PFGE fingerprints.
ACKNOWLEDGMENTS
We thank Cara Cooke, Joan Jeffrey, and Claudia Mun˜oz-Zanzi for critical review of the manuscript. The manuscript benefited from the insightful comments of two reviewers.
REFERENCES
1.Barrett, T. J., H. Lior, J. H. Green, R. Khakhria, J. G. Wells, B. P. Bell, K. D. Greene, J. Lewis, and P. M. Griffin.1994. Laboratory investigation of a
multistate food-borne outbreak ofEscherichia coliO157:H7 by using
pulsed-field gel electrophoresis and phage typing. J. Clin. Microbiol.32:3013–3017.
2.Blattner, F. R., G. Plunkett III, C. A. Bloch, N. T. Perna, V. Burland, M. Riley, J. Collado-Vides, J. D. Glasner, C. K. Rode, G. F. Mayhew, J. Gregor, N. W. Davis, H. A. Kirkpatrick, M. A. Goeden, D. J. Rose, B. Mau, and Y. Shao.1997. The complete genome sequence ofEscherichia coliK-12. Science
277:1453–1474.
3.Bourhy, H., B. Kissi, N. Tordo, H. Badrane, and D. Sacramento.1995. Molecular epidemiological tools and phylogenetic analysis of bacteria and
viruses with special emphasis on lyssaviruses. Prev. Vet. Med.25:161–181.
4.Bustamante, C., S. Gurrieri, and S. B. Smith.1993. Towards a molecular
description of pulsed-field gel electrophoresis. Trends Biotechnol.11:23–30.
5.Cardinali, G., and A. Martini.1999. Critical observations on computerized analysis of banding patterns with commercial software packages. J. Clin.
Microbiol.37:876–877.
6.Davis, M. A., D. D. Hancock, T. E. Besser, and D. R. Call.2003. Evaluation of pulsed-field gel electrophoresis as a tool for determining the degree of
genetic relatedness between strains of Escherichia coliO157:H7. J. Clin.
Microbiol.41:1843–1849.
7.Dice, L. R.1945. Measures of the amount of ecological association between
species. Ecology26:297–302.
8.Diekema, D. J., J. Barr, L. D. Boyken, B. J. Buschelman, R. N. Jones, M. A. Pfaller, and L. A. Herwaldt. 1997. A cluster of seriousEscherichia coli
infections in a neonatal intensive-care unit. Infect. Control Hosp. Epidemiol.
18:774–776.
9.Drake, J. W.1991. A constant rate of spontaneous mutation in DNA-based
microbes. Proc. Natl. Acad. Sci. USA88:7160–7164.
10.Duck, W. M., C. D. Steward, S. N. Banerjee, J. E. McGowan, Jr., and F. C. Tenover.2003. Optimization of computer software settings improves accu-racy of pulsed-field gel electrophoresis macrorestriction fragment pattern
analysis. J. Clin. Microbiol.41:3035–3042.
11.Felsenstein, J.1989. PHYLIP—phylogeny inference package (version 3.2).
Cladistics5:164–166.
12.Gerner-Smidt, P., L. M. Graves, S. Hunter, and B. Swaminathan.1998. Computerized analysis of restriction fragment length polymorphism pat-terns: comparative evaluation of two commercial software packages. J. Clin.
Microbiol.36:1318–1323.
13.Izumiya, H., J. Terajima, A. Wada, Y. Inagaki, K. I. Itoh, K. Tamura, and H. Watanabe.1997. Molecular typing of enterohemorrhagicEscherichia coli
O157:H7 isolates in Japan by using pulsed-field gel electrophoresis. J. Clin.
Microbiol.35:1675–1680.
14.Kariuki, S., C. Gilks, J. Kimari, A. Obanda, J. Muyodi, P. Waiyaki, and C. A. Hart.1999. Genotype analysis ofEscherichia colistrains isolated from
chil-dren and chickens living in close contact. Appl. Environ. Microbiol.65:472–
476.
15.Kudva, I. T., P. S. Evans, N. T. Perna, T. J. Barrett, F. M. Ausubel, F. R. Blattner, and S. B. Calderwood.2002. Strains ofEscherichia coliO157:H7 differ primarily by insertions or deletions, not single-nucleotide
polymor-phisms. J. Bacteriol.184:1873–1879.
16.Lenski, R. E., C. L. Winkworth, and M. A. Riley.2003. Rates of DNA
sequence evolution in experimental populations ofEscherichia coliduring
20,000 generations. J. Mol. Evol.56:498–508.
17.Manly, B. F. J.1997. Randomization, bootstrap and Monte Carlo methods in biology. Chapman & Hall, London, United Kingdom.
18.Matsuda, J., Y. Hirakata, F. Iori, C. Mochida, Y. Ozaki, M. Nakano, K. Izumikawa, T. Yamaguchi, R. Yoshida, Y. Miyazaki, S. Maesaki, K. Tomono, Y. Yamada, S. Kohno, and S. Kamihira.1998. Genetic relationship between blood and nonblood isolates from bacteremic patients determined by
pulsed-field gel electrophoresis. J. Clin. Microbiol.36:3081–3084.
19.Oprea, S. F., N. Zaidi, S. M. Donabedian, M. Balasubramaniam, E. Hersh-berger, and M. J. Zervos.2004. Molecular and clinical epidemiology of
vancomycin-resistantEnterococcus faecalis. J. Antimicrob. Chemother.53:
626–630.
20.Page, R. D. M.1996. TREEVIEW: an application to display phylogenetic
trees on personal computers. Comput. Appl. Biosci.12:357–358.
21.Payne, R. E., M. D. Lee, D. W. Dreesen, and H. M. Barnhart.1999.
Molec-ular epidemiology ofCampylobacter jejuniin broiler flocks using randomly
amplified polymorphic DNA-PCR and 23S rRNA-PCR and role of litter in
its transmission. Appl. Environ. Microbiol.65:260–263.
22.Samadpour, M.1995. Molecular epidemiology ofEscherichia coliO157:H7 by restriction fragment length polymorphism using Shiga-like toxin genes.
J. Clin. Microbiol.33:2150–2154.
23.Singer, R. S., J. S. Jeffrey, T. E. Carpenter, C. L. Cooke, E. R. Atwill, W. O. Johnson, and D. C. Hirsh.2000. Persistence of cellulitis-associatedE. coli
DNA fingerprints in successive broiler chicken flocks. Vet. Microbiol.75:
59–71.
24.Singer, R. S., J. S. Jeffrey, T. E. Carpenter, C. L. Cooke, R. P. Chin, and D. C. Hirsh.1999. Spatial heterogeneity ofEscherichia coliisolated from avian
cellulitis lesions in broilers. Avian Dis.43:756–762.
25.Sonntag, A. K., R. Prager, M. Bielaszewska, W. Zhang, A. Fruth, H. Tschape, and H. Karch.2004. Phenotypic and genotypic analyses of
enterohemor-rhagicEscherichia coliO145 strains from patients in Germany. J. Clin.
Microbiol.42:954–962.
26.Swaminathan, B., T. J. Barrett, S. B. Hunter, and R. V. Tauxe. 2001. PulseNet: the molecular subtyping network for foodborne bacterial disease
surveillance, United States. Emerg. Infect. Dis.7:382–389.
27.Tenover, F. C., R. D. Arbeit, and R. V. Goering.1997. How to select and interpret molecular strain typing methods for epidemiological studies of bacterial infections: a review for healthcare epidemiologists. Infect. Control
Hosp. Epidemiol.18:426–439.
28.Tenover, F. C., R. D. Arbeit, R. V. Goering, P. A. Mickelsen, B. E. Murray, D. H. Persing, and B. Swaminathan.1995. Interpreting chromosomal DNA restriction patterns produced by pulsed-field gel electrophoresis: criteria for
bacterial strain typing. J. Clin. Microbiol.33:2233–2239.
29.Traub, W. H., A. Eiden, B. Leonhard, and D. Bauer.1996. Typing of
noso-comial strains of Serratia marcescens: comparison of restriction enzyme
cleaved genomic DNA fragment (PFGE) analysis with bacteriocin typing, biochemical profiles and serotyping. Zentbl. Bakteriol. Parasitenkd.
Infekt-krankh. Hyg. Abt. 1 Orig.284:93–106.
30.van Belkum, A., W. van Leeuwen, M. E. Kaufmann, B. Cookson, F. Forey, J. Etienne, R. Goering, F. Tenover, C. Steward, F. O’Brien, W. Grubb, P. Tassios, N. Legakis, A. Morvan, N. El Solh, R. de Ryck, M. Struelens, S. Salmenlinna, J. Vuopio-Varkila, M. Kooistra, A. Talens, W. Witte, and H. Verbrugh.1998. Assessment of resolution and intercenter reproducibility of
results of genotypingStaphylococcus aureus by pulsed-field gel
electrophore-sis ofSmaI macrorestriction fragments: a multicenter study. J. Clin.
Micro-biol.36:1653–1659.
31.Vautor, E., G. Abadie, J. M. Guibert, C. Huard, and M. Pepin.2003.
Geno-typing ofStaphylococcus aureusisolated from various sites on farms with
dairy sheep using pulsed-field gel electrophoresis. Vet. Microbiol.96:69–79.
32.Wassenaar, T. M., B. Geilhausen, and D. G. Newell.1998. Evidence of
genomic instability inCampylobacter jejuniisolated from poultry. Appl.
En-viron. Microbiol.64:1816–1821.