Differences in the Determinants and Targeting of Antidumping:
China and India Compared
Ning Menga, Chris Milnerband Huasheng Songa, 1
a
College of Economics, Zhejiang University, Hangzhou, 310027, China
b
School of Economics, University of Nottingham, Nottingham, NG7 2RD, UK.
Running title :Comparative Analysis of Antidumping Filings between China and India
Abstract
Despite both being developing countries, China and India have markedly contrasting patterns in their use and targeting of antidumping (AD) measures. We explore the factors driving AD use by these two countries, considering in turn macroeconomic, strategic and other determinants. We find more regular or systematic features of AD use by China, while India displays a less systematic pattern of AD use. Economic growth, AD club effect and FTA participation are shown to constrain AD use by China. Compared to India, AD use by China is also more sensitive across industries. Furthermore, China targets developed countries more than developing countries, while India is less discriminating with respect to the country type it targets.
Keywords:China; India; antidumping
JEL:C33,F13; P51
I.
Introduction
Since the late 1980s, especially followingthe establishment of the WTO in 1995, antidumping
(AD) filings have been growing rapidly and evolved into global phenomenon. Initially traditional
users like the United States (US) and European Union (EU) accounted for most of AD filings,
butincreasingly emerging economies are becomingheavy AD users. India (IND), Argentina (ARG),
Brazil (BRA), China (CHN), South Africa (ZAF) and Turkey (TU) have become the major AD
users globally, having initiated 43% of the total AD cases filed between 1995 and 2014.Emerging
economies have gradually become dominant in the global AD use. Nowadays, AD is not only a
1
major trade issue between the North and the South, but also an increasingly significant one in the
[image:2.595.100.499.117.411.2]South-South trade.2
Figure 1. Asymmetry for a Country as a Plaintiff and as a Defendant during 1995-2014
As typical emerging economies and new AD users, China and India both play a significant
role in AD proliferation globally. However, there are distinctive differences in AD patterns
between the two countries. China, the world’s largest AD target, faced 1064 AD investigations
and initiated 221 AD investigations from 1995 to 2014. In contrast, as the heaviest AD user in the
world, India launched 722 AD investigations and was subject to 198 AD investigations during the
same period. Thus, there exists asymmetry between China and Indiain their roles as a plaintiff and
as a defendant with respect to other countries (see Figure 1). As a developing country and new AD
user, India in contrast to China has an AD pattern more consistent with developed countries such
as the US and the EU. But both China and India, as large developing countries, are considered
similar in many ways.3 They both reformed their inward trade policies: China began its reform
and opening up in 1978, while India also began a series of trade liberalization reforms in 1991.
Why then are their patterns of AD use so different? What factors drive emerging economies’
heavy use of AD in recent years? This paper will examine determinants of AD use in emerging
2
There is a substantial literature concerned with analysing the trade and/or welfare effects of AD measures, including China (e.g. Park, 2009). This paper is concerned with the political economy motives for adopting these particular trade policy measures.
3
There are of course important differences in the pattern of production and export specialisation in the two countries (Lo and Liu, 2009). This may account in part for some of the differences in AD usage and targeting between the two countries that we find in this study.
CHN IND USA EUN BRA KOR ARG TW N ZAF IDN AUS TUR THA CAN JPN MEX MYS RUS . . . . . . .. . ... 0 2 0 0 4 0 0 6 0 0 8 0 0 1 0 0 0 N u m b e r o f C a s e s a s a D e fe n d a n t
0 200 400 600 800
economies with China and India as representatives and analyze the differences between the two
countries.
The rest of the paper is organized as follows. Section 2 provides an overview of the factors
affecting AD use that have been identified in the literatures. Section 3 describes the methodology
and data used in this study, while Section 4 describes the empirical findings. Concluding remarks
are provided in Section 5.
II.
Overview of Factors Affecting AD Use
Macroeconomic determinants of antidumping
The influence of the importing country’s macroeconomic conditions on AD use has been
identified by several studies (Knetter and Prusa, 2003; Feinberg, 2005; Blonigen, 2006; Francois
and Niels, 2006; Moore and Zanardi, 2009; Bao and Qiu, 2011). One major finding is that more
AD filings are to be expected with slower domestic economic growth. However, no consistent
argument is to be found in the literature on the effect of the real exchange rate between the
importing and exporting countries’ currencies on AD activity. Feinberg (1989) finds that the US
dollar depreciation was accompanied by increased AD cases brought by the US, while Francois
and Niels (2006) and Vandenbussche and Zanardi (2008) find no statistically significant effect of
the real exchange. However, most studies argue that the importing country’s currency
appreciation will lead to more AD filings (Feinberg, 2005; Irwin, 2005; Blonigen, 2006; Mahand
Kim, 2006; Francois and Niels, 2006). Additionally, Blonigen and Bown (2003), Blonigen (2006),
Irwin(2005), Mah and Kim (2006)find that an increase in the import penetration ratio has a
positive and statistically significant impact on AD filings, but the studies of Leidy (1997) and
Sadni-Jallab et al. (2006) find that such effect is generally statistically insignificant.
In addition to the main macroeconomic conditions mentioned above, trade liberalization is
also a determinant worth considering though there is only a small but growing literature on the
relationship between AD use and trade liberalization (Moore and Zanardi, 2011). However, the
nature of the relationship is subject to some ambiguity. On the one hand, Feinberg and Reynolds
(2006) argue that trade liberalization, and the associated lowering of traditional sources of
protection, has been associated with increased AD use in some developing countries. Similarly,
Bown and Tovar (2011) conclude that Indian trade liberalization efforts may have increased the
probability of AD filings. Moore and Zanardi (2011) also identify a similar relationship. But
Finger and Nogués (2005), who analyze the role of AD and safeguard actions in Latin American
countries undergoing trade liberalization, conclude that such measures were a useful tool in
dealing with protectionist pressures and may therefore have facilitated the adoption of traditional
In terms of macroeconomic conditions both in the exporting and importing countries, Bown
and Crowley (2013) estimate the impact of macroeconomic fluctuations on import protection
policies before and during the Great Recession. They support the view of Bagwell and Staiger
(1990, 2003) that temporary trade barriers increase when macroeconomic conditions in both the
importing country and exporting country are weak. Crowley (2010), who investigates the same
issue using product level data, also finds that import restrictions increase in response to
macroeconomic weakness abroad. Similarly, Bown and Crowley (2014) find that the impact of
macroeconomic shocks on trade policy is similar in emerging economies to those for developed
countries.
Strategic determinants of antidumping
In addition to macroeconomic factors, Prusa and Skeath (2002, 2004) explore the impact of
strategic factors on AD use, finding that the importing countries may also consider how their
trading partner may react when imposing its own trade protection. They identify that both
retaliatory AD use of the“tit-for-tat”kind and“country club effects”prevail. Moreover, the
strategic motives of traditional AD users are shown to be different from that of new AD users.
Blonigen and Bown(2003) find that strategic considerations, in particular the share of US exports
in the potential target country, can influence the decision by the US to file an AD case. Aggarwal
(2004), Feinberg and Reynolds (2006) also find a positive relationship between retaliation and AD
filings. Dong (2013) argues that the underlying reasons for AD should be strategic in nature, in
particular, retaliatory.
In addition to retaliatory factors, strategic determinants include the spread of AD, namely a
contagion effect (Bao and Qiu, 2011). Bown and Crowley (2006) consider how AD by the US
against Japanese exports affected third markets through trade deflection, which raises the
probability of trade protection by other countries. Feinberg and Reynolds (2006) consider both
retaliatory factors and trade deflection among sets of countries. They find that deflection has an
impact on both new and traditional users, but retaliation is mainly adopted by new AD users.
Moore and Zanardi (2011) also provide evidence of retaliation and deflection effects as
determinant of AD filings. Bao and Qiu (2011) further distinguish a deflection effect from an
“echo effect” in both the US and China AD filings, with the latter tending to cause these countries
to launch more AD filings against countries that are already receiving AD filings from elsewhere.
Other determinants of antidumping
The proliferation of free trade agreements (FTA) since the 1990s has provoked interest in
the effects of this on AD use. On the one hand, FTAs may increase a country’s AD filings to
may impose new disciplining mechanismswhich reduce the use of AD in order to promote
intra-FTA trade (Ahn and Shin, 2011).
Although the literature has focused traditionally on the AD use of developed countries like
the US and the EU, there are a few studies on global antidumping patterns (Prusa, 2001; Feinberg
and Reynolds, 2006) and increasingly studies are also considering developing countries (Moore
and Zanardi, 2009; Bown and Tovar, 2011; Zeng, 2011). As for comparative studies, Aggarwal
(2004) compares the AD determinants of developed and developing countries. Meanwhile,
Sadni-Jallab et al. (2006) study AD filings by comparing the US and the EU, and Bao and Qiu
(2011) compare China and the US, focusing on whether China is more retaliatory than the US. We
are the first to focus on comparative study about two representatives of emerging economies and
provide evidence of most comprehensive determinants of AD use.
As for studies focusing on China, the majority focuses on why China is targeted (see Wang
and Xie, 2009; Bao, 2011; Zhang and Xie, 2011) rather than why it targets others. Although there
are some articles on India, for example Bown and Tovar (2011) on the effect of trade
liberalization on AD, the coverage of the existing literature is limited. Yang and Yao (2012)
compare China and India, but concentrate on providing a statistical summary of the facts of AD
activity in the two countries.
There is a large existing, empirical literature on the political economy, determinants of AD use.
This literature has shown that there are systematic macroeconomic and strategic factors that
fashion AD use. Most work has been done on the industrial, rather than developing, countries, and
there is relatively little cross-country, comparative analysis, especially between developing
countries. There is also relatively limited work for developing countries based on data that allows
analysis of AD use by target country at the industry level. In this paper, we seek to extend on this
literature. We examine what macroeconomic, strategic and other factors influence AD use in
China and India using a broad set of explanatory variables, and using a newly available dataset
which allows country-industry level analysis.
III.
Empirical strategy and data
The model and methodology
Following our discussion of the related literature in the preceding section, we propose the
following benchmark model of the determinants of AD use:
ܣܦ௧=ܽ+ߙᇱ∗݉௧+ߚᇱ∗ݏ௧+ߛᇱ∗ܿ௧+߳ (1)
where the dependent variableADijtis a binary variable indicating whether countryiinitiated AD
filings against countryjin yeart, or count variable indicating the total number of AD filings by
sijtis a vector of strategic variables and cijtis a vector of other variables. Vectorsα,β,γ are
regression coefficients, whilet is time trend andεis the error term. When we use the dummy as
the dependent variable, we estimate a probit model. For the number of AD filings as the dependent
variable, we employ a count model to analyze the data.
Data and variable definitions
Vector M (macroeconomic variables)
GDPit-1: Importing country i’s real GDP growth rate in year t-1. If growth is relatively slow,
domestic firms are more likely to turn to protectionist measures including AD filings to constrain
foreign sales. In recession conditions, foreign firms have incentives to cut prices to maintain
export volumes, which increases the probability of an affirmative material injury finding by the
AD initiators. This suggests that slow growth in the importing country may cause an increase in its
AD filings.
TARit-1: Importing countryi’s trade weighted average applied tariff rate in yeart-1. In the process
of trade liberalization, tariff reduction may induce national governments to impose AD duties as a
substitute for tariffs. Thus, AD filings by the importing country may increase with the lowering of
tariffs.
STRit: The ratio of industrial value-added to GDP of importing country i in year t. Products
involved in AD cases are mainly industrial products, so AD activity is likely to be influenced by
industrial development. An increase in industrial ratio, which may indicate industrial development
and more internationally competitive industrial products, leads to less use of AD filings. At the
same time, a decrease in the industrial ratio indicates a less competitive industry, which will be
more vulnerable to the impact of imported products. Domestic firms may be more likely to request
for protection in this situation. Therefore, the influence of the industrial ratio on AD filings is
expected to be negative.
DEPit: The ratio of the trade volume to GDP of importing country i in year t captures the
dependence of a country’s economy on trade. On the one hand, a higher import ratio motivates a
country to protect domestic firms, which leads to more AD use. On the other hand, a higher export
ratio and the more dependent the country is on outside world, and the greater the government’s
incentive is to maintain mutually favorable trading partnerships. We assume therefore that greater
export dependence constrains the use of AD filings. Therefore, the influence of the trade
dependence on AD use is ambiguousa priori.
FGDPjt-1: Exporting countryj’s real GDP growth rate in year t-1. Most existing studies focus on
the impact of the importing countries’ macroeconomic conditions; few studies consider those
consider the potential effect of the exporting country’s GDP growth, assuming that AD filings
may increase as result of a decrease in the exporting countries’ GDP growth, following Bown and
Crowley (2013).
EXijt-1: The percent change of real exchange rate between country i and country j in year t-1.
Domestic firms’ competiveness with respect to imports will be weakened by an appreciation of the
home country’s currency and tend to increase pressures for protection. Furthermore, since the
price of the exporting countries’ products will fall due to such changes in the exchange rate, it is
easier to prove a material injury. Therefore, the effect of currency appreciation on AD filings is
expected to be positive.
IMPijt: Bilateral import penetration ratio of countryi’s imports from countryj.It is defined as the
ratio between the value of bilateral imports as a percentage of total domestic demand, where the
domestic demand is the GDP minus exports plus imports. This bilateral import penetration ratio
reflects the degree of competitive pressure from the specific exporting country. Thus, when the
ratio increases, domestic firms are expected to seek more protection against imports from this
source, causing the use of AD to increase.
VectorS(strategic variables)
TFTijt-1: The total number of AD filings initiated by countryj against countryi in yeart-1. This
variable is used to capture the “tit-for-tat” retaliation proposed by Prusa and Skeath (2004).
RETit-1:The total number of AD initiated by all other countries against countryiin yeart-1. This
variable is included to capture the incentive in country i for a general level of retaliation. The
importing country is more likely to initiate AD against other countries when targeted by other
countries in previous year. We expect an increase in RET to increase AD filings by countryi.
CLUBjt-1: The total number of AD made by country j against all countries in year t-1. This
indicates whether countryj is a heavy user of AD filings, i.e. an AD club member. If it is, there
will be two effects on country i’s AD use. On the one hand, country i may reduce AD against
countryjfor fear of retaliation (Feinberg and Reynolds, 2006). On the other hand, as an AD club
member, countryj is more likely to be targeted, a result captured by the “AD club” effect (Prusa
and Skeath, 2004). Therefore, the influence of CLUB is ambiguous.
DEFLjt-1: The total number of AD against countryjby all countries except for countryiin yeart-1
is used to proxy the “deflection” effect. Cases filed against country j may divert its trade flows
elsewhere and cause import surges in third countries including countryi, leading to an increase in
AD by these countries. We expect an increase in DEFL to increase AD by countryi.
ECHOjt: The total number of AD against countryjby all countries except for countryiin yeartis
the incentive to file AD cases by firms in countryi, since it increases these firms’ expectation of
affirmative determination by the government when AD filings are made. Such behavior is
associated with information transmission of AD fillings across the parties involved (Bao and Qiu,
2011).
VectorC(other variables)
FTAit: The number of FTAs country i has signed up to year t. As previously mentioned, FTAs
have two conflicting effects on AD filings (Ahn and Shin, 2011) and the net effect is uncertain.
REC: Dummy variable of the global economic recession, the value of this variable is 1 from 2008
to 2014 and 0 before 2008. We introduce the variable to exam what impact global economic
recession has on the AD filings of China and India. Theoretically, countries are more likely to turn
to protectionism during economic recession.
Data sources and estimation method
This study intends to analyze the motives of AD filings in China and India. Our sample
consists of panel data from 1997 to 2014 for China and from 1992 to 2014 for India.4 In order to
capture the changes of trade policy in India since the liberalization reforms in 1991, we employ a
different sample period for India than for China. But we also match them consistently when the
data are pooled together. For the dependent variable, we use the Global Antidumping Database
constructed by Chad Bown. In addition to the dependent variable, the retaliatory variables are
constructed by organizing bilateral AD filing data based on that database.
The macroeconomic variables (real GDP growth rate, ratio of industrial value-added to GDP,
ratio of trade volume to GDP) are obtained from the World Bank’s World Development Indicators.
Data on trade weighted average tariff rates is constructed from the World Integrated Trade
Solution (WITS). Data on bilateral trade comes from the United Nations Commodity Trade
Statistics Database (COMTRADE). Data on FTAs is from the Regional Trade Agreements
Information System (RTA-IS).
AD cases are discrete data, which can be measured or summarized in incidence terms (0,1
binary dummy variable) or in extent terms by counting the number of cases. We use both
measures here. For the binary variable measure we estimate a probit model. For the count
measure .the widely used nonlinear model is the Poisson model. This, however, requires that the
variance of the relevant variable should not exceed its mean, otherwise over-dispersion occurs and
the Poisson estimator is inconsistent, in which case the negative binomial model (NBM) performs
better. We employ Cameron and Trivedi's (1990) methods to detect over-dispersion. In
4
accordance with the results of tests for over-dispersion, we use the NBM model for both China
and India. We use the maximum likelihood techniques and capture the (exporting) country fixed
effects through the panel data.5.
Summary data
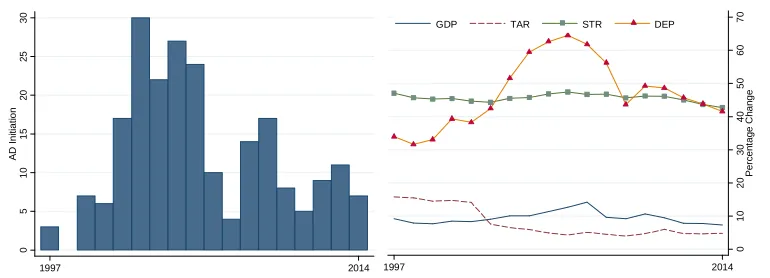
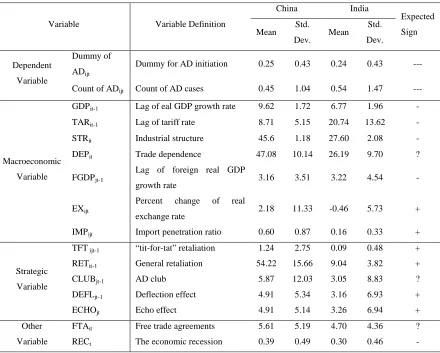
The variable definitions, descriptive statistics and expected sign are summarized in Table 1,
while the relationships between macroeconomic conditions of the importing country and AD
filings in China and India are separately shown in Figure 2 and Figure 3. There are obvious
differences in macroeconomic conditions between China and India. The real GDP growth rate
(denoted by GDP in the figures) of China is higher and less volatile than India’s over the period
1997-2014, while the magnitude of tariff reduction (denoted by TAR in the figures) in India is
much larger than in China. In addition, the industrialization level (proxy for industrial structure)
(denoted by STR in the figures) and trade dependence (denoted by DEP in the figures) in China
[image:9.595.108.494.345.482.2]are higher than in India.
Figure 2. Relationship between Macroeconomic Variables and China’s AD Filings (1997-2014)
Figure 3. Relationship between Macroeconomic Variables and India’s AD Filings (1997-2014)
5
Given that our data may also contain an excessive number of zeros, we also investigate the use of a zero-inflated, negative binomial model as part of the robustness analysis.
0 1 0 2 0 3 0 4 0 5 0 6 0 7 0 P e rc e n ta g e C h a n g e 1997 2014
GDP TAR STR DEP
0 5 1 0 1 5 2 0 2 5 3 0 A D In it ia ti o n 1997 2014 0 5 1 0 1 5 2 0 2 5 3 0 3 5 4 0 4 5 P e rc e n ta g e C h a n g e 1997 2014
GDP TAR STR DEP
[image:9.595.108.493.518.657.2]Table 1. Variable Description, Summary Statistics and Expected Sign
Variable Variable Definition
China India
Expected
Sign
Mean Std.
Dev. Mean
Std.
Dev.
Dependent
Variable
Dummy of
ADijt
Dummy for AD initiation 0.25 0.43 0.24 0.43
---Count of ADijt Count of AD cases 0.45 1.04 0.54 1.47
---Macroeconomic
Variable
GDPit-1 Lag of eal GDP growth rate 9.62 1.72 6.77 1.96
-TARit-1 Lag of tariff rate 8.71 5.15 20.74 13.62
-STRit Industrial structure 45.6 1.18 27.60 2.08
-DEPit Trade dependence 47.08 10.14 26.19 9.70 ?
FGDPjt-1
Lag of foreign real GDP
growth rate 3.16 3.51 3.22 4.54
-EXijt
Percent change of real
exchange rate 2.18 11.33 -0.46 5.73 +
IMPijt Import penetration ratio 0.60 0.87 0.16 0.33 +
Strategic
Variable
TFTijt-1 “tit-for-tat” retaliation 1.24 2.75 0.09 0.48 +
RETit-1 General retaliation 54.22 15.66 9.04 3.82 +
CLUBjt-1 AD club 5.87 12.03 3.05 8.83 ?
DEFLjt-1 Deflection effect 4.91 5.34 3.16 6.93 +
ECHOjt Echo effect 4.91 5.14 3.26 6.94 +
Other
Variable
FTAit Free trade agreements 5.61 5.19 4.70 4.36 ?
RECt The economic recession 0.39 0.49 0.30 0.46
-IV.
Empirical results
Comparative analysis of AD determinants for China and India
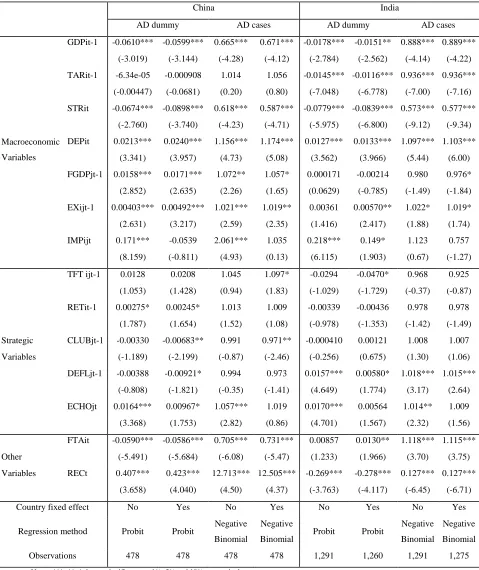
The baseline regression results for China and India are reported in Table 2.6 We employ a probit
model where the AD dummy is the dependent variable and report the marginal effects of each
variable. For the number AD cases as the dependent variable, we use a negative binomial model as
indicated by the over-dispersion tests. We report the incidence rate ratio (IRR) for ease of
interpretation.
6
Table 2. Results for Baseline Estimates for China and India of Determinants of AD Filings
China India
AD dummy AD cases AD dummy AD cases
Macroeconomic
Variables
GDPit-1 -0.0610*** -0.0599*** 0.665*** 0.671*** -0.0178*** -0.0151** 0.888*** 0.889***
(-3.019) (-3.144) (-4.28) (-4.12) (-2.784) (-2.562) (-4.14) (-4.22)
TARit-1 -6.34e-05 -0.000908 1.014 1.056 -0.0145*** -0.0116*** 0.936*** 0.936***
(-0.00447) (-0.0681) (0.20) (0.80) (-7.048) (-6.778) (-7.00) (-7.16)
STRit -0.0674*** -0.0898*** 0.618*** 0.587*** -0.0779*** -0.0839*** 0.573*** 0.577***
(-2.760) (-3.740) (-4.23) (-4.71) (-5.975) (-6.800) (-9.12) (-9.34)
DEPit 0.0213*** 0.0240*** 1.156*** 1.174*** 0.0127*** 0.0133*** 1.097*** 1.103***
(3.341) (3.957) (4.73) (5.08) (3.562) (3.966) (5.44) (6.00)
FGDPjt-1 0.0158*** 0.0171*** 1.072** 1.057* 0.000171 -0.00214 0.980 0.976*
(2.852) (2.635) (2.26) (1.65) (0.0629) (-0.785) (-1.49) (-1.84)
EXijt-1 0.00403*** 0.00492*** 1.021*** 1.019** 0.00361 0.00570** 1.022* 1.019*
(2.631) (3.217) (2.59) (2.35) (1.416) (2.417) (1.88) (1.74)
IMPijt 0.171*** -0.0539 2.061*** 1.035 0.218*** 0.149* 1.123 0.757
(8.159) (-0.811) (4.93) (0.13) (6.115) (1.903) (0.67) (-1.27)
Strategic
Variables
TFT ijt-1 0.0128 0.0208 1.045 1.097* -0.0294 -0.0470* 0.968 0.925
(1.053) (1.428) (0.94) (1.83) (-1.029) (-1.729) (-0.37) (-0.87)
RETit-1 0.00275* 0.00245* 1.013 1.009 -0.00339 -0.00436 0.978 0.978
(1.787) (1.654) (1.52) (1.08) (-0.978) (-1.353) (-1.42) (-1.49)
CLUBjt-1 -0.00330 -0.00683** 0.991 0.971** -0.000410 0.00121 1.008 1.007
(-1.189) (-2.199) (-0.87) (-2.46) (-0.256) (0.675) (1.30) (1.06)
DEFLjt-1 -0.00388 -0.00921* 0.994 0.973 0.0157*** 0.00580* 1.018*** 1.015***
(-0.808) (-1.821) (-0.35) (-1.41) (4.649) (1.774) (3.17) (2.64)
ECHOjt 0.0164*** 0.00967* 1.057*** 1.019 0.0170*** 0.00564 1.014** 1.009
(3.368) (1.753) (2.82) (0.86) (4.701) (1.567) (2.32) (1.56)
Other
Variables
FTAit -0.0590*** -0.0586*** 0.705*** 0.731*** 0.00857 0.0130** 1.118*** 1.115***
(-5.491) (-5.684) (-6.08) (-5.47) (1.233) (1.966) (3.70) (3.75)
RECt 0.407*** 0.423*** 12.713*** 12.505*** -0.269*** -0.278*** 0.127*** 0.127***
(3.658) (4.040) (4.50) (4.37) (-3.763) (-4.117) (-6.45) (-6.71)
Country fixed effect No Yes No Yes No Yes No Yes
Regression method Probit Probit Negative
Binomial
Negative
Binomial Probit Probit
Negative
Binomial
Negative
Binomial
Observations 478 478 478 478 1,291 1,260 1,291 1,275
Notes: ***, **, * denote significance at 1%, 5% and 10%, respectively.
We find that for both China and India an increase in domestic GDP growth will significantly
reduce AD use. The probability of AD initiation decreases 6% for China and 2% for India as their
GDP growth rate increases by 1% in year t-1, while the AD cases decrease by a factor of 0.7 for
increases the probability of AD initiation and the AD cases only for India. This finding supports
the interesting argument about substitution between AD measures and tariffs, especially for India
in which tariff decreases dramatically from 56% in 1992 to 6% in 2014 since the liberalization
reforms in 1991. An increase in industrial ratio significantly reduces AD use both for China and
India, while an increase in the trade dependence significantly increases AD use. The former
finding is consistent with expectation, while the latter shows that the effect of import dependence
[image:12.595.89.512.232.485.2]dominates.
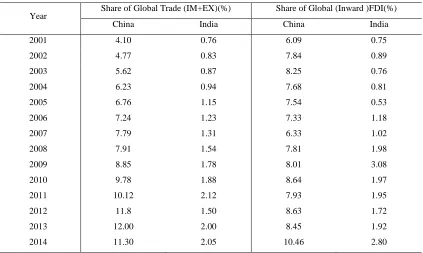
Table 3. China and India’s Integration into the World Economy
Year Share of Global Trade (IM+EX)(%) Share of Global (Inward )FDI(%)
China India China India
2001 4.10 0.76 6.09 0.75
2002 4.77 0.83 7.84 0.89
2003 5.62 0.87 8.25 0.76
2004 6.23 0.94 7.68 0.81
2005 6.76 1.15 7.54 0.53
2006 7.24 1.23 7.33 1.18
2007 7.79 1.31 6.33 1.02
2008 7.91 1.54 7.81 1.98
2009 8.85 1.78 8.01 3.08
2010 9.78 1.88 8.64 1.97
2011 10.12 2.12 7.93 1.95
2012 11.8 1.50 8.63 1.72
2013 12.00 2.00 8.45 1.92
2014 11.30 2.05 10.46 2.80
Notes: IM denotes imports, EX denotes exports.
The foreign GDP growth has a significantly positive effect on AD use for China but has no
significant effect for India. This finding differs from Bown and Crowley (2013). We offer two
possible explanations. One explanation for the difference between China and India is that,
compared to India, China is more deeply integrated into the world economy (see Table 3) and
more influenced by its dependence on the world economy. Another explanation is related to a
specific aspect of globalization. Gawande et al. (2011) study the determinants of trade policy
responses to the 2008 financial crisis and find that vertical specialization (global fragmentation) is
the most powerful economic factor determining trade policy responses. They also find that there is
heterogeneity of countries’ behavior in their trade policies: it is the demand of vertically
specialized domestic exporters that curbed protectionism in some countries including China. India,
meanwhile, like some other countries, is influenced by demand from vertically specialized foreign
exporters dependent on Indian inputs. Domestic currency appreciation has a significantly positive
effect on AD filings both for China and for India. The import penetration ratio has a significantly
for China, it has a significantly positive effect both for AD initiation and AD cases in the model
without a country fixed effect, but such an effect disappears once controlling for the country fixed
effect.
Both the tit-for-tat and general retaliation effect are positive in China but negative in India,
though it is only significant in certain specifications. This suggests that the retaliatory pattern of
AD actions by China is different from that of India. As a new AD user, China will retaliate against
AD actions targeting it. However, India’s retaliatory pattern is more similar to that of traditional
users. Bao and Qiu (2011) find that retaliation has a negative effect on US AD filings, which
mirrors what we have found in the case of India. An increase in AD use against each country in
the previous year leads to fewer AD being initiated by each of them due to the threat of retaliation.
The similarity between India and traditional AD users may be related to India’s large stock of AD
cases and relatively high frequency of AD filings, features that recall traditional users’ AD
patterns. There is significant echo effect but no significant deflection effect in China’s AD filing.
This indicates that when a country receives AD filings from other country, China tends to launch
its own filing against that country due to strategic consideration or information transmission. As
for India, both echo and deflection effects are significant without country fix effect. The latter
effect indicates that India also takes more AD against a country due to trade diversion caused by
AD by a third country. Lastly, the AD club effect is only significant for China when the country
effects are controlled for.The number of FTAs’ effect on AD filings is negative for China while it
is positive for India. This suggests that FTAs help to reduce the use of AD to accomplish the
purpose of free trade for China, while India is more likely to protect domestic industries due to
facing more imports from FTAs partners. We find that AD filings in China are consistent with the
theoretical predictions of increasing trade protectionism during economic recessions, while the
2008 economic recession had the opposite effect on AD filings by India.
Significance test of difference
The baseline estimates suggest some similarities and differences between what drives AD
filings for China and India. We find that some variables (tariff rate, foreign GDP growth and echo
effect) only have significant effects on one country, while others (retaliation, FTA and the
recession) have significant effects but with different signs. Furthermore, for some variables
(domestic GDP growth, industrial structure, trade dependence, real exchange rate and import
penetration) we identify common effects but with different magnitudes between the two countries.
In order to investigate whether the differences are statistically significant, we pool the data for
China and India and run the following regression:
ܣܦ௧=ߜ+ܣᇱܺ+ߜ݅݊݀݅ܽ+ܤᇱܺ∗݅݊݀݅ܽ (2)
The explanatory variables, vector X, are as in our baseline regression model and the dummy
explanatory variables for China’s AD filings are significantly different from those for India’s, we
test the null hypothesis H0: bChina=bIndia, with bChina=A and bIndia =A+B in this model. The results
[image:14.595.97.499.161.418.2]of this test are reported in Table 4.
Table 4.Results of Test of Coefficient Differences
Variables China India Pooled
Data Test
Macroeconomic
Variables
GDPit-1 - - Y
TARit-1 ns - N
STRit - - N
DEPit + + Y
FGDPjt-1 + ns Y
EXijt-1 + + N
IMPijt + + N
Strategic
Variables
TFTijt-1 +(ns) ns N
RETit-1 +(ns) - Y
CLUBjt-1 - + Y
DEFLjt-1 ns + Y
ECHOjt + +(ns) Y
Other
Variables
FTAit - + Y
RECt + - Y
Notes: “+”, “-” and “ns” denote significantly positive, significantly negative, and not significant, respectively. “+(ns)” and “-(ns)”
respectively denote significantly positive and significantly negative in some specifications. “Y” and “N” indicates whether China and
India are significantly different (Y) or not (N).
According to the test results, there are significant differences both in terms of the magnitude
and the sign of specific coefficients between the estimated models for the two countries. First, we
focus on the differences in the magnitude. For GDP growth, the effect on China is greater than on
India. The significantly negative effect of GDP growth may partly explain why ADs initiated by
China are much fewer than by India. China experienced the fastest growth among the major
economies in the world over the period of anlysis, while India grew more slowly and with more
fluctuation (see Figure 2 and Figure 3). As for the greater positive effect of trade dependence on
China, a possible explanation is that the trade ratio for China is much higher than for India (see
Table 1) and therefore AD use by China was more sensitive to the change in trade dependence.
As for the differences in sign, except for general retaliation as mentioned above, there are
two other variables, i.e. FTA and recession, the coefficients on which have opposite signs. The
significantly negative FTA effect for China and significantly positive effect for India could be
explained as follows. On the one hand, India already participates in more FTAs than China so the
positive marginal effect is diminishing for India. On the other hand, it reflects the fact that China
is increasingly engaging in trading partnerships through FTAs and is therefore reducing AD use as
on AD filings for China is consistent with our expectation. However, the effect of recession for
India is significantly negative. This can be explained by the previous finding that India’s AD use
is negatively associated with retaliation. Since 2008, the economic growth of many countries has
slowed down and therefore have been more likely to adopt protectionist policies which leads to
fewer AD being initiated by India due to the threat of retaliation.
[image:15.595.53.550.226.759.2]Comparative analysis of AD defendants across target countries
Table 5.Results of Estimates for Developed and Developing Target Countries
China India
AD dummy AD cases AD dummy AD cases
Developing
countries
Developed
countries
Developing
countries
Developed
countries
Developing
countries
Developed
countries
Developing
countries
Developed
countries
Macroeconomic
Variables
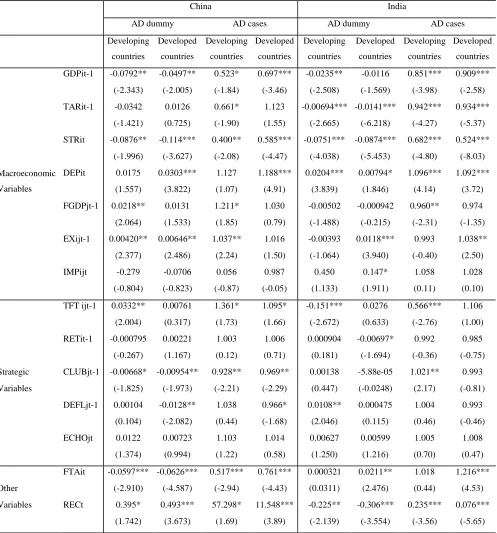
GDPit-1 -0.0792** -0.0497** 0.523* 0.697*** -0.0235** -0.0116 0.851*** 0.909***
(-2.343) (-2.005) (-1.84) (-3.46) (-2.508) (-1.569) (-3.98) (-2.58)
TARit-1 -0.0342 0.0126 0.661* 1.123 -0.00694*** -0.0141*** 0.942*** 0.934***
(-1.421) (0.725) (-1.90) (1.55) (-2.665) (-6.218) (-4.27) (-5.37)
STRit -0.0876** -0.114*** 0.400** 0.585*** -0.0751*** -0.0874*** 0.682*** 0.524***
(-1.996) (-3.627) (-2.08) (-4.47) (-4.038) (-5.453) (-4.80) (-8.03)
DEPit 0.0175 0.0303*** 1.127 1.188*** 0.0204*** 0.00794* 1.096*** 1.092***
(1.557) (3.822) (1.07) (4.91) (3.839) (1.846) (4.14) (3.72)
FGDPjt-1 0.0218** 0.0131 1.211* 1.030 -0.00502 -0.000942 0.960** 0.974
(2.064) (1.533) (1.85) (0.79) (-1.488) (-0.215) (-2.31) (-1.35)
EXijt-1 0.00420** 0.00646** 1.037** 1.016 -0.00393 0.0118*** 0.993 1.038**
(2.377) (2.486) (2.24) (1.50) (-1.064) (3.940) (-0.40) (2.50)
IMPijt -0.279 -0.0706 0.056 0.987 0.450 0.147* 1.058 1.028
(-0.804) (-0.823) (-0.87) (-0.05) (1.133) (1.911) (0.11) (0.10)
Strategic
Variables
TFT ijt-1 0.0332** 0.00761 1.361* 1.095* -0.151*** 0.0276 0.566*** 1.106
(2.004) (0.317) (1.73) (1.66) (-2.672) (0.633) (-2.76) (1.00)
RETit-1 -0.000795 0.00221 1.003 1.006 0.000904 -0.00697* 0.992 0.985
(-0.267) (1.167) (0.12) (0.71) (0.181) (-1.694) (-0.36) (-0.75)
CLUBjt-1 -0.00668* -0.00954** 0.928** 0.969** 0.00138 -5.88e-05 1.021** 0.993
(-1.825) (-1.973) (-2.21) (-2.29) (0.447) (-0.0248) (2.17) (-0.81)
DEFLjt-1 0.00104 -0.0128** 1.038 0.966* 0.0108** 0.000475 1.004 0.993
(0.104) (-2.082) (0.44) (-1.68) (2.046) (0.115) (0.46) (-0.46)
ECHOjt 0.0122 0.00723 1.103 1.014 0.00627 0.00599 1.005 1.008
(1.374) (0.994) (1.22) (0.58) (1.250) (1.216) (0.70) (0.47)
Other
Variables
FTAit -0.0597*** -0.0626*** 0.517*** 0.761*** 0.000321 0.0211** 1.018 1.216***
(-2.910) (-4.587) (-2.94) (-4.43) (0.0311) (2.476) (0.44) (4.53)
RECt 0.395* 0.493*** 57.298* 11.548*** -0.225** -0.306*** 0.235*** 0.076***
Country fixed effect Yes Yes Yes Yes Yes Yes Yes Yes
Regression method Probit Probit Negative
Binomial
Negative
Binomial Probit Probit
Negative
Binomial
Negative
Binomial
Observations 177 301 177 301 526 734 526 749
Notes: ***, **, * denote significance at 1%, 5% and 10%, respectively.
We now investigate whether China and India treat target countries differently, and
disaggregate our sample between developed and developing countries in the target populations.
The results of these estimations are reported in Table 5.
In terms of the macroeconomic perspective, the main differences are found for trade
dependence and foreign GDP growth in China’s AD against developed and developing countries.
Trade dependence and foreign GDP have significantly positive effects for both developed and
developing countries. The reason for the former is that China faces strong import pressure from
developed countries, against which its AD actions are mainly targeted (the number of AD against
developed countries is twice that against developing countries). The reason for the latter is that
China’s exports are mainly low quality manufacturing products, which means the China’s
products tend to be similar and engage in export competition with products from developing
countries. Compared to China, India’s filings against developed and developing countries are less
discriminatory, which is also reflected in the fact that there are no developed or developing
countries which India systematically targets. In the regression with sub samples, there is more
solid evidence that the AD pattern of India is less regular, containing more random features.
Although differences exist in terms of the strategic patterns between China and India, for
both countries the strategic effects with respect to developing countries are more significant. The
tit-for-tat retaliation and club effects are the main strategic motivation for China and these two
effects are more significant when targeting developing countries. To some extent, this reflects
increasingly how more developing countries than developed countries tend to be defendants of
AD cases. In global AD proliferation, developing countries are not only replacing developed
countries to be the major initiators, but are also becoming the major targets of AD use. Disputes
between developing countries are also on the rise (Bao, 2012).
Participation in FTAs reduces AD filings against developed and developing countries by
China. Meanwhile, for India FTA participation increases its filings against developed countries
but has no significant effect when it comes to developing countries. As for the 2008 economic
recession, while China’s filings increase consistently across the board, India reduces cases against
developing countries but increases cases against developed countries.
Endogeneity issues and robustness checks
We need to consider whether our findings are affected by any endogeneity issues. We have
foreign GDP growth rate, real exchange rate and weighted average tariff rate, which should help
to attenuate any potential endogeneity problem. As for the endogenous choice of targeted
countries, we employ specifications both with and without country fixed effects. We also
disaggregate our sample on country-industry (HS2) level to investigate whether China and India
use AD differently across industries, and control for industry fixed effects (see Table 6).
Additionally, we consider whether there are some possible omitted variables such as China’s
accession into the WTO which are affecting the results, but we find that they are insignificant and
make no difference to our results.
In the comparative analysis of AD patterns and the significance test of difference, we use
appropriate models (probit model for binary variables and count model for count variables)both
with and without country fixed effect to run the regressions and obtain similar results, which
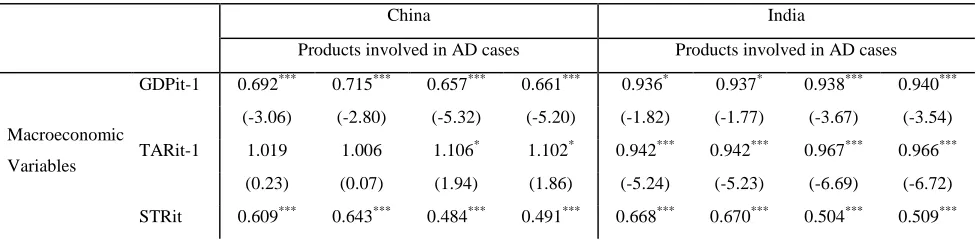
shows that our results are generally robust. For further robustness checks, we adjust model (1) by
replacing the dependent variable with the number of product categories involved in AD cases. We
use this alternative dependent variable because, on the one hand, the number of AD each year is
limited and, on the other, the products involved in AD are generally from more than one category.
Given that products are classified in the Global Antidumping Database into HS6 for some cases
and HS8 for others, we classify the products by HS6 to maintain consistency. Regression results
[image:17.595.53.545.440.760.2]based on the new model are reported in Table 7.
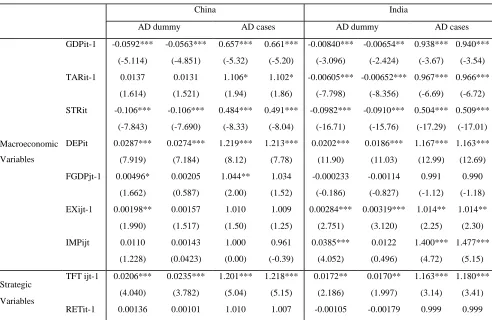
Table 6. Results for Comparative Analysis with Country-Industry Level Data
China India
AD dummy AD cases AD dummy AD cases
Macroeconomic
Variables
GDPit-1 -0.0592*** -0.0563*** 0.657*** 0.661*** -0.00840*** -0.00654** 0.938*** 0.940***
(-5.114) (-4.851) (-5.32) (-5.20) (-3.096) (-2.424) (-3.67) (-3.54)
TARit-1 0.0137 0.0131 1.106* 1.102* -0.00605*** -0.00652*** 0.967*** 0.966***
(1.614) (1.521) (1.94) (1.86) (-7.798) (-8.356) (-6.69) (-6.72)
STRit -0.106*** -0.106*** 0.484*** 0.491*** -0.0982*** -0.0910*** 0.504*** 0.509***
(-7.843) (-7.690) (-8.33) (-8.04) (-16.71) (-15.76) (-17.29) (-17.01)
DEPit 0.0287*** 0.0274*** 1.219*** 1.213*** 0.0202*** 0.0186*** 1.167*** 1.163***
(7.919) (7.184) (8.12) (7.78) (11.90) (11.03) (12.99) (12.69)
FGDPjt-1 0.00496* 0.00205 1.044** 1.034 -0.000233 -0.00114 0.991 0.990
(1.662) (0.587) (2.00) (1.52) (-0.186) (-0.827) (-1.12) (-1.18)
EXijt-1 0.00198** 0.00157 1.010 1.009 0.00284*** 0.00319*** 1.014** 1.014**
(1.990) (1.517) (1.50) (1.25) (2.751) (3.120) (2.25) (2.30)
IMPijt 0.0110 0.00143 1.000 0.961 0.0385*** 0.0122 1.400*** 1.477***
(1.228) (0.0423) (0.00) (-0.39) (4.052) (0.496) (4.72) (5.15)
Strategic
Variables
TFT ijt-1 0.0206*** 0.0235*** 1.201*** 1.218*** 0.0172** 0.0170** 1.163*** 1.180***
(4.040) (3.782) (5.04) (5.15) (2.186) (1.997) (3.14) (3.41)
(1.564) (1.111) (1.51) (1.09) (-0.685) (-1.180) (-0.13) (-0.09)
CLUBjt-1 -0.00636*** -0.00632*** 0.954*** 0.954*** 0.000490 0.000195 1.001 1.001
(-5.892) (-4.284) (-6.10) (-5.86) (0.912) (0.302) (0.29) (0.34)
DEFLjt-1 -0.00310 -0.00450* 0.972** 0.970** 0.00321*** 0.00292*** 1.026*** 1.026***
(-1.460) (-1.816) (-2.21) (-2.26) (5.479) (4.532) (7.84) (7.66)
ECHOjt 0.0106*** 0.00774*** 1.069*** 1.059*** -5.27e-05 -0.000205 0.999 0.999
(5.008) (2.859) (5.09) (4.11) (-0.0922) (-0.302) (-0.31) (-0.27)
Other
Variables
FTAit -0.0575*** -0.0559*** 0.682*** 0.691*** 0.0171*** 0.0149*** 1.101*** 1.097***
(-9.244) (-8.639) (-8.47) (-8.16) (5.479) (4.847) (4.88) (4.73)
RECt 0.500*** 0.476*** 28.604*** 26.281*** -0.306*** -0.286*** 0.114*** 0.118***
(7.482) (7.033) (7.04) (6.81) (-9.827) (-9.384) (-10.71) (-10.58)
Country fixed effect No Yes No Yes No Yes No Yes
Industry fixed effect No Yes No Yes No Yes No Yes
Regression method Probit Probit Negative
Binomial
Negative
Binomial Probit Probit
Negative
Binomial
Negative
Binomial
Observations 1,826 1,826 1826 1826 7,696 7,680 7,696 7,665
Notes: ***, **, * denote significance at 1%, 5% and 10%, respectively.
By comparing the results in Table 2 with Table 6, we find that there are some differences
between the country level and country-industry level analysis for China and basically no
differences for India. For India, the sign and the significance of all the variables is largely
unchanged with the exception of the tit-for-tat retaliation variable, which becomes significantly
positive in the new model. The intuition for the change is straightforward: tit-for-tat retaliation in
India is different across industries and therefore the positive effect dominates when we examine
the total effect at the country level. The results for China are robust in general, though the
significance of some macroeconomic variables (foreign GDP, real exchange rate and import
penetration) become insignificant especially with industry fixed effects controlled for, while some
strategic variables (tit-for-tat retaliation and AD club effect) become more significant. The former
shows the effect of these variables disappears when considering them at the industry level. The
latter suggests that the strategic consideration is more sensitive in specific industries. Carefully
comparing the new results in Table 7 with those in Table 2 and Table 6, we find our results are
[image:18.595.54.542.643.763.2]quite robust. The signs of all variables and the significance of most variables are unchanged.
Table 7. Results for Comparative Analysis with Product-level data
China India
Products involved in AD cases Products involved in AD cases
Macroeconomic
Variables
GDPit-1 0.692*** 0.715*** 0.657*** 0.661*** 0.936* 0.937* 0.938*** 0.940***
(-3.06) (-2.80) (-5.32) (-5.20) (-1.82) (-1.77) (-3.67) (-3.54)
TARit-1 1.019 1.006 1.106* 1.102* 0.942*** 0.942*** 0.967*** 0.966***
(0.23) (0.07) (1.94) (1.86) (-5.24) (-5.23) (-6.69) (-6.72)
(-3.54) (-3.10) (-8.33) (-8.04) (-5.44) (-5.39) (-17.29) (-17.01)
DEPit 1.146*** 1.127*** 1.219*** 1.213*** 1.043** 1.043** 1.167*** 1.163***
(3.59) (3.13) (8.12) (7.78) (2.11) (2.11) (12.99) (12.69)
FGDPjt-1 1.115*** 1.087* 1.044** 1.034 1.002 1.004 0.991 0.990
(2.66) (1.92) (2.00) (1.52) (0.13) (0.25) (-1.12) (-1.18)
EXijt-1 1.022** 1.019* 1.010 1.009 1.017 1.016 1.014** 1.014**
(2.39) (1.85) (1.50) (1.25) (1.20) (1.12) (2.25) (2.30)
IMPijt 1.970*** 2.468*** 1.000 0.961 2.392*** 2.377*** 1.400*** 1.477***
(5.54) (4.27) (0.00) (-0.39) (4.79) (4.02) (4.72) (5.15)
Strategic
Variables
TFT ijt-1 0.983 0.998 1.201*** 1.218*** 1.065 1.074 1.163*** 1.180***
(-0.29) (-0.03) (5.04) (5.15) (0.53) (0.60) (3.14) (3.41)
RETit-1 1.016 1.010 1.010 1.007 0.990 0.991 0.999 0.999
(1.54) (0.98) (1.51) (1.09) (-0.50) (-0.48) (-0.13) (-0.09)
CLUBjt-1 0.996 1.007 0.954*** 0.954*** 0.999 0.996 1.001 1.001
(-0.36) (0.52) (-6.10) (-5.86) (-0.15) (-0.46) (0.29) (0.34)
DEFLjt-1 0.980 0.978 0.972** 0.970** 1.033*** 1.035*** 1.026*** 1.026***
(-0.90) (-0.90) (-2.21) (-2.26) (3.12) (3.11) (7.84) (7.66)
ECHOjt 1.073*** 1.069*** 1.069*** 1.059*** 1.036*** 1.038*** 0.999 0.999
(3.13) (2.63) (5.09) (4.11) (3.28) (3.34) (-0.31) (-0.27)
Other
Variables
FTAit 0.706*** 0.725*** 0.682*** 0.691*** 1.051 1.049 1.101*** 1.097***
(-5.15) (-4.80) (-8.47) (-8.16) (1.31) (1.25) (4.88) (4.73)
RECt 14.361*** 10.914*** 28.604*** 26.281*** 0.403** 0.411** 0.114*** 0.118***
(3.87) (3.52) (7.04) (6.81) (-2.30) (-2.25) (-10.71) (-10.58)
Country fixed effect No Yes No Yes No Yes No Yes
Industry fixed effect No No No Yes No No No Yes
Regression method Negative
Binomial
Negative
Binomial
Negative
Binomial
Negative
Binomial
Negative
Binomial
Negative
Binomial
Negative
Binomial
Negative
Binomial
Observations 478 478 1,826 1,826 1,291 1,275 7,696 7,665
Notes: ***, **, * denote significance at 1%, 5% and 10%, respectively.
V.
Conclusions
This paper aims to explain the differences in AD patterns in the cases of China and India from
the perspective of looking at various determinants of AD use, which are broadly classified into
three categories: macroeconomic, strategic and other determinants. We find evidence of
systematic influences on Chinas AD filings, except for the unexpected, positive effect of foreign
GDP growth, which may be attributed to globalization effects. Compared to China, AD use by
India displays less systematic features, especially in terms of strategic factors.
We also find that AD filings in Chinas case are more constrained by economic growth, the AD
club effect and FTA participation, which may partly explain why China initiates fewer AD filings
effects and more significantly by some negative effects which vary across industries. But such
differences across industries do not exist in the case of India. Differences also exist between the
two countries in the retaliatory and contagion patterns of AD filings. Interestingly, India’s
retaliatory pattern is more similar to that of the developed countries.
In terms of AD targets, China’s AD filings target developed countries more than developing
countries, especially before the recession, while India targets developing countries somewhat
more than developed countries. The present, positive analysis of differences and similarities in the
drivers of AD provides no basis, however, for drawing normative implications or conclusions
about the relative desirability or effectiveness of AD policies in the two countries. Policy makers
in the two countries may well be interested know, nevertheless, how their own use of AD
measures differs from that of another major and increasingly outward-oriented developing country.
Indeed, trade policy makers in the trading partners (current and potential targets of AD measures)
of both China and India may well interested also knowing how and why AD use differs in the two
countries.
References
:
Aggarwal, Aradhna (2004) Macro Economic Determinants of Antidumping: A Comparative Analysis of Developed and Developing Countries,World Development, 32, 1043-57
Ahn, Dukgeun and ShinWonkyu (2011) Analysis of Anti-Dumping Use in Free Trade Agreements,
Journal of World Trade, 45, 431-56.
Bagwell, Kyle and Robert Staiger (2003) Protection and the Business Cycle, Advances in Economic Analysis and Policy, 3, 1 -43.
Bagwell, Kyle and Robert Staiger (1990) A Theory of Managed Trade, American Economic Review, 80, 779-95.
Bao, Xiaohua and Larry Qiu (2011) Is China’s Antidumping More Retaliatory than that of the US?
Review of International Economics, 2, 374-89.
Bao,Xiaohua (2011) Has China Faced Discriminative Antidumping? Management World (in Chinese), 3, 32-43.
Bao,Xiaohua (2012) Why Global Antidumping Grows: a Study on Antidumping Motivation and ‘North-South’ Differences,Economic Management(in Chinese), 34, 10-21.
Baruah, N.andana (2007) An Analysis of Factors Influencing the Antidumping Behavior in India”,
The World Economy,30, 1170-1191.
Blonigen, Bruce and Chad Bown (2003) Antidumping and Retaliation Threats, Journal of International Economics ,60, 249-73.
Blonigen, Bruce (2006)Working the System, Firm Learning and the Antidumping Process,
European Journal of Political Economy, 22, 715-31..
Bown, Chad (2012) Global Antidumping Database,http://econ.worldbank.org/ttbd/gad/
Bown, Chad and Meredith Crowley (2013) Import Protection, Business Cycles, and Exchange Rates: Evidence from the Great Recession,Journal of International Economics, 90, 50-64.
Bown, Chad and Meredith Crowley (2014) Emerging Economics, Trade Policy and Macroeconomic Shocks,Journal of Development Economics, 111, 261–73..
Bown, Chad and Patricia Tovar (2011) Trade Liberalization, Antidumping, and Safeguards: Evidence from India’s Tariff Reform,Journal of Development Economics,96, 115-25.
Crowley, Meredith (2010) Split Decisions in Antidumping Cases, B.E. Journal of Economic Analysis and Policy,10, 1935-82
Dong, Baomin (2013) Cost-Based Anti-dumping As A Repeated Game, Economic Record, 89, 95–105.
Feinberg, Robert (2005) U.S. Antidumping Enforcement and Macroeconomic Indicators Revisited: Do Petitioners Learn?,Review of World Economics, 141, 612-22.
Feinberg, Robert,1989, Exchange Rates and Unfair Trade,Review of Economics and Statistics, 71, 704-07.
Feinberg, Robert and Kara Reynolds (2006) The Spread of Antidumping Regimes and the Role of Retaliation in Filings,Southern Economic Journal, 72, 877-90.
Finger, Michael and Julio Nogués (eds) (2005) Safeguards and Antidumping in Latin American Trade Liberalization: Fighting Fire with Fire, New York:Palgrave.
Francois, Joseph and Gunnar Niels (2006) Business Cycles, the Exchange Rate, and Demand for Antidumping Protection in Mexico,Review of Development Economics, 10, 388-99.
Gawande K, Hoekman B, Cui Y (2011). Determinants of Trade Policy Responses to the 2008 Financial Crisis. World Bank Policy Research Working Paper Series, WPS5862
Irwin, Douglas (2005)The Rise of US Antidumping Activity in Historical Perspective”,The World Economy, 28, 651-68.
Knetter, Michael and Thomas Prusa (2003) Macroeconomic Factors and Antidumping Filings: Evidence from Four Countries,Journal of International Economics, 61, 1-17..
Leidy, Michael (1997) Macroeconomic Conditions and Pressures for Protection under Antidumping and Countervailing Duty Laws: Empirical Evidence from the United States,
International Monetary Fund Staff Paper, 44(1).
Mah,Jai and Yongdae Kim (2006)Antidumping Duties and Macroeconomic Variables: The Case of Korea,Journal of Policy Modeling, 28,157–62.
Moore, Michael, and Maurizio Zanardi (2009) Does Antidumping Use Contribute to Trade Liberalization in Developing Countries?,Canadian Journal of Economics, 42, 469–95.
Moore, Michael, and Maurizio Zanardi (2011) Trade Liberalization and Antidumping: Is There a Substitution Effect?”,Review of Development Economics, 1, 601–19.
Niels, Gunnar and Joseph Francois (2006) Business Cycles, the Exchange Rate and Demand for Antidumping Protection in Mexico,Review of Development Economics, 10, 388-99.
Prusa, Thomas and Susan Skeath (2002) The Economic and Strategic Motives for Antidumping Filings,Review of World Economics, 138, 389-413.
Sadni-Jallab, Mustapha, Monnet Gbakou and Rene Sandretto (2006) Antidumping Procedures and Macroeconomic Factors: A Comparison between the United States and the European Union,
Global Economic Journal, 6, 1-22.
Vandenbussche, Hylke and Maurizio Zanardi (2008) What Explains the Proliferation of Antidumping Laws,Economic Policy, 23, 98-103.
Wang,Xiaosong and ShexiangXie (2009) Why on Earth Does China Face Antidumping?Management World(in Chinese), 12, 27-38.
Yang, Xiaoyun and Zhaocheng Yao (2012)A Contrastive Study on Chinese and Indian Antidumping Behavior,Journal of International Trade(in Chinese), 7, 132-39.
Zeng, Ka (2011) The Political Economy of Developing Country Antidumping Investigations against China,International Interactions, 37, 190-214.
Zhang, Yan and Jianguo, Xie (2011) Do Regional Trade Agreements Decrease Members’ Antidumping Threat: an Analysis of Chinese Experience, Journal of International Trade (in Chinese), 8,30-39.
[image:22.595.95.511.346.762.2]Appendix
:
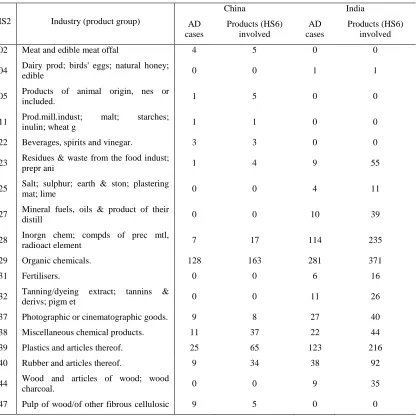
Table A1. Industries Targeted by China and India
HS2 Industry (product group)
China India
AD cases
Products (HS6) involved
AD cases
Products (HS6) involved
02 Meat and edible meat offal 4 5 0 0
04 Dairy prod; birds' eggs; natural honey;
edible 0 0 1 1
05 Products of animal origin, nes or
included. 1 5 0 0
11 Prod.mill.indust; malt; starches;
inulin; wheat g 1 1 0 0
22 Beverages, spirits and vinegar. 3 3 0 0
23 Residues & waste from the food indust;
prepr ani 1 4 9 55
25 Salt; sulphur; earth & ston; plastering
mat; lime 0 0 4 11
27 Mineral fuels, oils & product of their
distill 0 0 10 39
28 Inorgn chem; compds of prec mtl,
radioact element 7 17 114 235
29 Organic chemicals. 128 163 281 371
31 Fertilisers. 0 0 6 16
32 Tanning/dyeing extract; tannins &
derivs; pigm et 0 0 11 26
37 Photographic or cinematographic goods. 9 8 27 40
38 Miscellaneous chemical products. 11 37 22 44
39 Plastics and articles thereof. 25 65 123 216
40 Rubber and articles thereof. 9 34 38 92
44 Wood and articles of wood; wood
charcoal. 0 0 9 35
mat;
48 Paper & paperboard; art of paper pulp,
paper/p 34 37 24 42
50 Silk. 0 0 5 21
53 Other vegetable textile fibres; paper
yarn & w 0 0 2 14
54 Man-made filaments. 12 14 36 47
55 Man-made staple fibres. 2 3 42 79
56 Wadding, felt & nonwoven; yarns;
twine, cordage, 0 0 5 10
58 Special woven fab; tufted tex fab; lace;
tapes 0 0 2 10
59 Impregnated, coated, cover/laminated
textile fabr 0 0 8 19
64 Footwear, gaiters and the like; parts of
such 0 0 4 6
68 Art of stone, plaster, cement, asbestos,
mica/sim 0 0 22 19
69 Ceramic products. 0 0 7 23
70 Glass and glassware. 2 4 39 33
72 Iron and steel. 77 26 354 163
73 Articles of iron or steel. 19 12 16 52
74 Copper and articles thereof. 0 0 7 24
76 Aluminium and articles thereof. 0 0 14 36
81 Other base metals; cermets; articles
thereof. 0 0 2 5
84 Nuclear reactors, boilers, mchy & mech
appliance; 0 0 42 125
85 Electrical mchy equip parts thereof;
sound record 0 0 101 144
87 Vehicles o/t railw/tramw roll-stock, pts
& access 5 5 7 28
90 Optical, photo, cine, meas, checking,