Exploring Gastrointestinal Variables Affecting Drug and
Formulation Behavior: Methodologies, Challenges and
Opportunities
Bart Hens1,5, Maura Corsetti2,3, Robin Spiller2, Luca Marciani2, Tim Vanuytsel3, Jan Tack3, Arjang
Talattof4*, Gordon L. Amidon5, Mirko Koziolek6,7, Werner Weitschies7, Clive G. Wilson8, Roelof J.
Bennink9, Joachim Brouwers1, Patrick Augustijns1
1 Drug Delivery & Disposition, KU Leuven, Leuven, Belgium
2 Nottingham Digestive Diseases Centre and NIHR Biomedical Research Unit in Gastrointestinal and
Liver Diseases at Nottingham University Hospitals NHS Trust and the University of Nottingham
3 Translational Research Center for Gastrointestinal Disorders (TARGID), KU Leuven, Leuven,
Belgium
4 Office of Generic Drugs, Center for Drug Evaluation and Research, U.S. Food and Drug
Administration, Silver Spring, Maryland, USA.
5 College of Pharmacy, University of Michigan, Ann Arbor, Michigan, USA
6 Drug Delivery, Disposition and Dynamics, Monash Institute of Pharmaceutical Sciences, Monash
University, Parkville, Australia
7 Center of Drug Absorption and Transport, Department of Pharmaceutical Technology and
Biopharmacy, University of Greifswald, Greifswald, Germany
8 Strathclyde Institute of Pharmacy and Biomedical Sciences, University of Strathclyde, Glasgow,
United Kingdom
9 Academic Medical Center Amsterdam, Department of Nuclear Medicine, Amsterdam, The
Netherlands
* Disclaimer: The views expressed in this article are those of the authors and not necessarily those of
Corresponding author: Patrick Augustijns – [email protected]
Address: Drug Delivery & Disposition, Campus Gasthuisberg O&N 2, Box 921, Herestraat 49, 3000 Leuven, Belgium. Tel.: +32 16 330301 ; fax: +32 16 330305.
1
1. Abstract
Various gastrointestinal (GI) factors affect drug and formulation behavior after oral administration,
including GI transfer, motility, pH and GI fluid volume and composition. An in-depth understanding of
these physiological and anatomical variables is critical for a continued progress in oral drug
development. In this review, different methodologies (invasive versus non-invasive) to explore the
impact of physiological variables on formulation behavior in the human GI tract are presented, revealing
their strengths and limitations. The techniques mentioned allow for an improved understanding of the
role of following GI variables: gastric emptying (magnetic resonance imaging (MRI), scintigraphy,
acetaminophen absorption technique, ultrasonography, breath test, intraluminal sampling and
telemetry), motility (MRI, small intestinal/colonic manometry and telemetry), GI volume changes (MRI
and ultrasonography), temperature (telemetry) and intraluminal pH (intraluminal sampling and
telemetry).
2. Introduction
In 2015, the FDA’s Center for Drug Evaluation and Research (CDER) approved 45 new drugs for
clinical use (U.S. Food and Drug Administration, 2016). Of these new drugs, 55% were commercialized
as oral formulations either as tablets (16), capsules (8) or granules (1), indicating that the oral route of
administration is still of major interest. For the last couple of decades, efforts are underway to develop
and validate biorelevant in vitro and in silico tools to predict the oral absorption of new drug products prior to the start of animal studies or clinical trials (Lennernäs et al., 2014). Reliable models are essential
to reduce the occurrence of failures in a late phase, resulting in time- and cost-saving drug development.
After oral intake, a drug formulation is challenged by several gastrointestinal (GI) barriers. Complex
variables such as pH, GI secretions and GI transit/motility along the GI tract can affect drug release and
absorption in a positive or negative way depending on the physicochemical properties of the drug
compound (e.g. pH/pKa interplay for ionizable drugs) and/or the formulation characteristics (e.g.
pH-sensitive coating). In addition, inter-subject variability in characteristics of the GI environment may
cause variable drug absorption and systemic drug availability (Riethorst et al., 2015). Determining the
median and range for specific GI variables, and understanding how they influence oral drug behavior
2 The present review provides an overview of different methodologies that can be applied to study
physiological variables of the human GI tract and their impact on oral drug absorption in healthy and
patient populations. The methodologies have been subdivided into two groups: (i) noninvasive and (ii)
invasive methodologies. Although some of the methodologies are more historical than operational, they
have been of paramount importance for innovations in drug and formulation development; in addition,
they have created the basis for several novel methodologies, leading to an in-depth comprehension of
different GI variables: gastric emptying (magnetic resonance imaging (MRI), scintigraphy,
acetaminophen absorption technique, ultrasonography, breath test, intraluminal sampling and
telemetry), motility (MRI, small intestinal/colonic manometry and telemetry), GI volume changes (MRI
and ultrasonography), temperature (telemetry) and GI pH (intraluminal sampling and telemetry).
3. Noninvasive methodologies
a. Scintigraphy
Disturbances in the normal movement of food along the GI tract can be associated with abdominal pain,
early satiety and nausea. Measurement of GI transit, especially gastric emptying (GE), therefore has
become a routine and important test in clinical physics and gastroenterology clinics for patients with
dyspeptic symptoms. Techniques previously used by physiologists include gastric intubation to sample
dye dilution, sampling of gastric meal volumes (recoverable after different periods; Hunt, 1963), or the
movement of radio-opaque markers using X-rays. The principle of incorporating gamma-emitting
radiopharmaceuticals into a food matrix or a formulation allowed the non-invasive visualization of the
ligand with a much reduced dose compared to X-rays and less interference with normal function
(Digenis et al., 1977).
Studies of GE using scintigraphic techniques with radiolabeled standard meals were introduced by
Griffith and colleagues in 1966 (Griffith et al., 1966) and further refined in the seventies with the
introduction of simultaneous measurement of GE of both solids and liquids in 1976 (Heading et al.,
1976). This was facilitated by labeling the phases with radionuclides of different energies that could be
distinguished by gating in separate channels. GE scintigraphy has been used for more than 50 years for
clinical and investigative purposes, and is usually ordered to confirm or exclude whether gastroparesis
3 has become the gold standard for the evaluation of GE of solids and liquids in all types of GI disorders
and for assessing the efficacy of gastroprokinetic drugs and surgical procedures (Cuomo et al., 2001).
Besides planar scintigraphy, single-photon emission computed tomography (SPECT) can be performed.
The extra dimension of this technique is the ability to detect changes in gastric accommodation after
intravenous injection of the radiopharmaceutical 99mTc-pertechnetate which shows uptake in the gastric
mucosa (Bennink et al., 2004). It was demonstrated that dynamic gastric scintigraphy allows
visualization and characterization of antral contractions and can also be used to evaluate the distribution
of food inside the stomach and to quantify the emptying of a radiolabeled test meal from each
compartment (Bennink et al., 1998). In the scintigraphic determination of GE, there are many parameters
which can affect the final result. Factors such as meal size and composition, subject age and weight and
measurement technique are known to influence GE. It is therefore of paramount importance that, as
much as possible, standardized conditions are used in performing scintigraphic GE studies. Until
recently, there were no accepted standards for performing GE scintigraphy. This problem raised
concerns about the continued acceptance of GE scintigraphy without consistent methodology (Maurer,
2008). As a result, in 2007 a consensus recommendation was published jointly by the Gastrointestinal
Council of the Society of Nuclear Medicine and Molecular Imaging and the American
Neurogastroenterology and Motility Society (Abell et al., 2008). The consensus group recommended a
solid-meal GE test “using readily available technology and normative data, which can provide clinicians
with standardized results”. This consensus recommendation was adopted by the Society of Nuclear
Medicine and Molecular Imaging (Donohoe et al., 2009) and was included in a joint practice guideline
from the American College of Radiology/Society for Pediatric Radiology and the Society of Nuclear
Medicine and Molecular Imaging. In interpreting GE studies, one needs to understand the multiple
factors that affect GE, particularly the separate roles of the fundus and antrum. Visual inspection of early
distribution of a solid meal in the stomach has become increasingly recognized as important. Although
liquids rapidly disperse throughout the stomach, solids will initially localize predominantly in the fundus
until slow, sustained fundal contractions move them to the antrum (Bennink et al., 1998). The normal
values for scintigraphic GE studies are usually based on male controls or a mixed control population.
4 occasionally noted in studies (Datz et al., 1987). The effect of gender on GE remains controversial
though there is more and more evidence that women have slower GE rates (Wang et al., 2015). In female
volunteers, “delayed” GE of solids seems to be related to a prolonged lag phase during which no
emptying is observed, decelerating the emptying rate (Bennink et al., 1998). Moreover, GE seemed to
be delayed in elderly compared to young subjects (Soenen et al., 2015). It has been demonstrated that
motor dysfunction of the upper GI tract and/or colon is common in patients with functional (nonorganic)
upper and/or lower GI symptoms. An association has been reported between delayed GE of solids and
liquids and symptoms of postprandial fullness, early satiety, nausea and vomiting by several groups
(Sarnelli et al., 2003; Stanghellini et al., 1996), although not confirmed by other studies (Talley et al.,
2006).
Following the behavior of oral formulations in the upper GI tract
Early studies exploring the behavior of drug formulations utilized the expertise developed in
partnerships between pharmaceutical sciences and radionuclide imaging since the potential for
understanding the in vivo release of drugs and relating this to absorption was unsurpassed by any other imaging technology (Hardy and Wilson, 1981). The availability of technetium-99m eluted as [99mTc]
sodium pertechnetate from a portable Mo-99 generator further strengthened the acceptance of
scintigraphy as a clinical tool. The isotope has ideal properties: a half-life of 6.03 h and an energy of
140 keV, without beta-radiation resulting in a low radiation burden. For the study of the behavior of
drug formulations in the GI lumen, it was important to determine the gut compartment in which the
formulation disintegrated. The use of non-absorbed marker materials was essential, as otherwise the
view of the gut would be swamped by hepatic blood flow. For this reason, chelates such as [99m
Tc]-labeled diethylene-triaminepentaacetic acid ([99mTc]-DTPA) were widely used as solution markers and
Amberlite resins as material to mimic undissolved particulate (e.g. in a hard gelatin capsule). An
example image of late dispersion and emptying in a volunteer who received a capsule formulation
containing indium-111- labeled Amberlite IR120 (presented by the highlighted colour) is shown in
5
Figure 1: Emptying following dispersion of a capsule containing micronised Amberlite labeled with Indium-111.
Early studies conducted by the Nottingham group investigated factors such as differential GE of drugs
relative to meal according to size of the matrix (Davis et al., 1984). It has been established in dogs that
large objects were more likely to be retained in the fed state. This retention was also seen in man,
accentuated by intake of a heavy meal with larger enteric coated dosage forms (Wilson et al., 1989),
whereas systems that disintegrated or dispersed into component particulates emptied with the liquid
phase. Results for swelling dosage forms were inconsistent due to the variable initiation of the
housekeeper sequence (migrating motor complex or MMC) relative to the rate of swelling. Similarly,
floating dosage forms needed sufficient contents to be present and were very sensitive to posture
(Bennett et al., 1984). For Biopharmaceutics Classification System (BCS) class I compounds, the rate
of emptying of the stomach determines the absorption profile, since dissolution may occur in the
stomach and drug uptake occurs as soon as it enters the small intestine. Based on this principle, the
acetaminophen absorption technique was introduced as an alternative technique for measuring GE
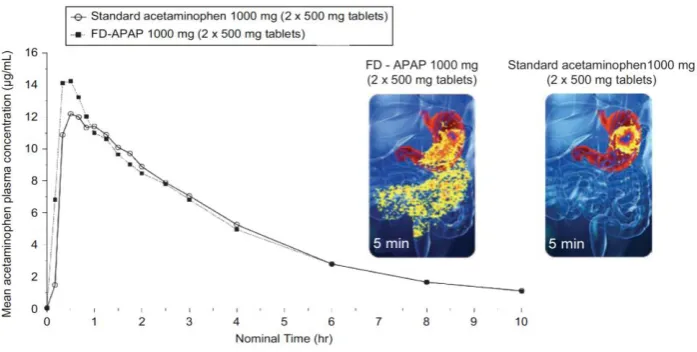
(discussed in the next section: Acetaminophen Absorption Technique). In the development of a novel
fast acting formulation containing paracetamol (FD-APAP), the granulate was labeled by the addition
of [111In]-labeled DTPA (Wilson et al., 2011). Because scintigraphy allows a more rapid sampling than
taking blood, the effects of small changes in dissolution rate of a drug compound become more evident
6
Figure 2: Composite of the pharmacokinetic data and the illustrated images for standard acetaminophen 1000 mg dose (2 x 500 mg tablets) and fast acting formulation containing paracetamol 1000 mg dose (FD-APAP; 2 x 500 mg tablets. Adopted from
Wilson et al. (2011). Copyright Taylor & Francis 2011.
Regarding small intestinal transit times (SITT), scintigraphy demonstrated reasonably constant transit
times of approximately 3 h ( 3 ± 1 h; mean ± SEM ) in 201 normal subjects, irrespective of prandial
state (ranging from fasted state to heavy breakfast) and formulation type (solutions, small pellets, and
single units (matrix tablets and osmotic pumps)).
Gastro-retention is a principle which can be used to deliver, for instance, weakly basic drug compounds
which have good acid solubility but which precipitate upon entry in the upper intestine. Such materials
have a pH-based absorption window in the proximal intestine. By retaining a formulation in the stomach,
the drug can be allowed to percolate into the duodenum at a slow rate maintaining the systemic exposure
more effectively than an immediate release formulation for instance. There are several mechanisms
including flotation, swelling, and folding and coating (Lopes et al., 2016). Scintigraphy can be used to
measure the residence time and dispersion of the formulation in the stomach to evaluate the extent of
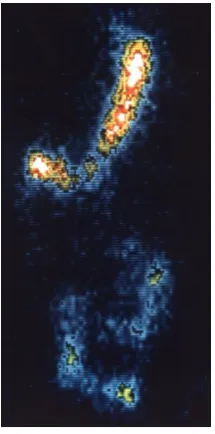
coating. For example, sucralfate is used to treat and prevent ulcers by forming a precipitate on the exuded
proteins lost from the ulcer site. The compound will form strong complexes with indium – labeled
radiopharmaceuticals. A formulation of [113mIn] -labeled sucralfate was administered to volunteers and
7
Figure 3: Scintiscan of [113mTn]-labeled sucralfate after swallowing 20 ml labeled suspension.
In a related fashion, gastro-retentive dosage forms can be radiolabeled by incorporation of a
non-absorbed radiopharmaceutical. This is useful for evaluating swelling dosage forms and floating systems.
Swelling, by changing the geometry, could sustain delivery by a physicochemical rather than solely a
physiological mechanism once it had left the stomach. Scintigraphy assists by unambiguously
demonstrating that the sustaining action is in part due to residence in the stomach.
b. Acetaminophen absorption technique
Since the seventies, new insights have been generated in the variability of therapeutic drug outcomes
among patient populations. Different physiological factors such as intestinal motility, GE rate,
splanchnic blood flow and volume, composition and pH of GI fluids were explored in detail in animal
experiments. Their clinical relevance, however, remained uncertain as only a few studies were carried
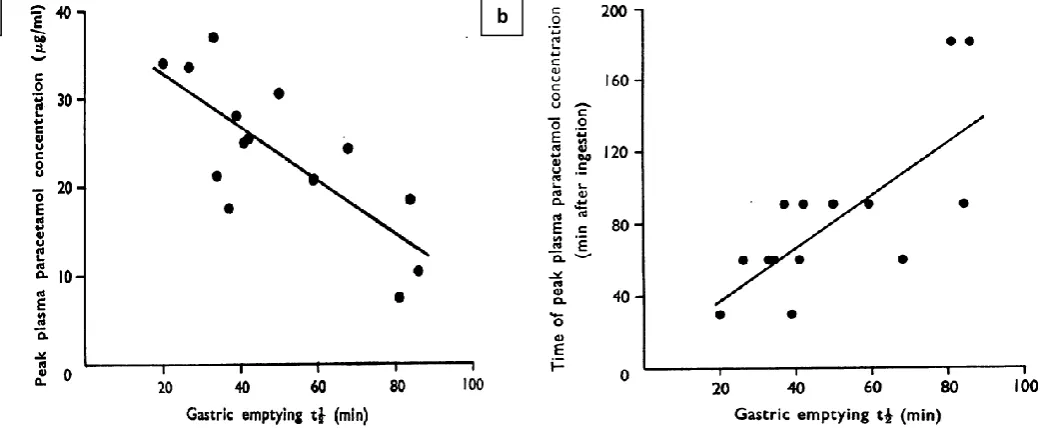
out in man. In 1973, Heading et al. investigated the relationship between gastric half time (T1/2, G) and
the plasma Cmax and Tmax of acetaminophen (paracetamol) in patients (Heading et al., 1973).
Acetaminophen is classified as a highly soluble and highly permeable drug (BCS class 1) (Amidon et
al., 1995). Based on these properties, it can be hypothesized that GE directly influences paracetamol
8 the drug is delivered to the small intestine. Within 6 days following acetaminophen absorption study,
the GE rate (expressed as gastric half-time; T1/2, G) was measured by a sequential scintigraphic technique
using the chelate indium-113m DTPA, the gold standard technique to measure GE in those days.
Maximum plasma concentrations (Cmax) and time to maximum plasma concentrations (Tmax) of
[image:10.595.46.568.213.430.2]acetaminophen were strongly correlated to T1/2, G, as depicted in Figure 4a and Figure 4b, respectively.
Figure 4: (a) Relationship between T1/2, G and the peak plasma acetaminophen (i.e. paracetamol) concentration (r= -0.77, p < 0.005). (b) Relationship between GE half time (T1/2, G) and the time of the peak plasma acetaminophen concentration (r= 0.76, p < 0.005). Adopted from
Heading et al. (1973). Copyright Wiley 1973.
Although statistically significant correlations were observed for the entire population of 14 patients, the
GE of 5 out of 14 patients did not correlate with the plasma Cmax nor Tmax of acetaminophen. In this
study, the authors claimed that interindividual variation in the rate of drug absorption was due to
differences in the rate of GE, which in turn depends on (i) disease state, (ii) endocrine and autonomic
activity and (iii) GI variables such as volume, temperature, pH and composition of the stomach contents.
Willems and colleagues reviewed studies carried out from 1973 until 1996 and concluded that the lack
of a standardized protocol confounded the pharmacokinetic parameter (Cmax, Tmax, AUC, etc.)that was
able to describe the process of GE appropriately (Sanaka et al., 1997; Willems et al., 2001). Moreover,
caloric differences between test meals and the use of different dosage forms (tablet versus solution)
make it difficult to interpret and compare all studies with each other (Sanaka et al., 1998). Therefore,
because of these drawbacks, other techniques are more preferred to study gastric emptying.
9
c. Radio-opaque markers
Radio-opaque markers (i.e. barium, platinum, tantalum, gold) are high-density particles of metals or
compounds that will absorb radiation and can be visualized by radiography (X-rays). Back in 1969,
Hinton et al. explored the use of radio-opaque markers to measure GI transit times in healthy subjects
and in ileostomy subjects (Hinton et al., 1969). Twenty solid cylindrical pellets of polythene with various
thickness (2, 3 or 5 mm), containing 20% (w/w) of barium sulphate, were orally administered before
breakfast.
Based on radiographs of the stool of 25 healthy volunteers, pellets could be visualized and data were
presented as (a) the time when the first markers appeared and (b) when 80% of the markers appeared in
the feces. The first marker(s) passed within 30 hours (range: 9-59 h) and 80% of the markers passed in
45 hours (range: 25-84 h, except for one volunteer: 150 h). In ileostomy subjects, the average GI transit
time was 2.5 h, ranging from 0.75 to 4.75 h.
Rather than working with stool samples, abdominal radiographs can estimate transit times in the
different colonic segments. In 1987, Metcalf and colleagues measured colonic transit times with the use
of distinctive markers, ingested by 24 healthy subjects on 3 consecutive days (Metcalf et al., 1987).
Daily abdominal X-rays were taken to visualize the position of these markers. Transit times were
calculated by the following equation:
T = ∆t ×𝑁𝑛 (Equation 1)
Where T is the transit time in a given colonic segment, ∆t is the time between two marker ingestions (in
this case 24 h), n is the number of markers counted in a given colonic segment and N is the number of
markers ingested daily. A mean colonic transit time of 35.0 h was calculated in this study for healthy
volunteers. In case of patients complaining of functional constipation, Pomerri and colleagues
investigated colonic transit times in 50 patients who were asked to ingest 10 identical cylindrical
radio-opaque markers every day during 10 days (Pomerri et al., 2008). In addition to the radio-radio-opaque markers,
8 to 10 ml of a commercial thick 113% (w/v) barium paste was co-administered as a colonic tracer. On
10 administered doses of radio-opaque markers and, subsequently, colonic transit times were calculated by
Equation 1.
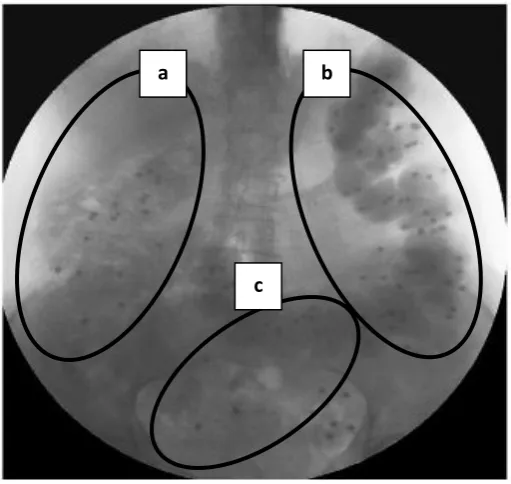
Figure 5 depicts the fluoroscopic image of a constipated patient at day 11 of the study. The paste of the
barium formulation that was orally ingested clearly identifies the different regions of the colon. Colonic
segments of interest were the right colon (Figure 5A; ileocecal junction together with the ascending
colon and right part of the transverse colon), the left colon (Figure 5B; left part of the transverse colon
[image:12.595.174.430.275.517.2]and the descending colon) and the recto-sigmoid colon (Figure 5C).
Figure 5: Fluoroscopic image showing small radio-opaque particles present in the different anatomical segments of the colon; a: right colonic segment; b: left colonic segment; c: recto-sigmoid colon. Adapted from Pomerri et al. (2008). Copyright Elsevier 2008.
Results indicated a transit time of 30.5 ± 24.4 h for the right colonic segment, a transit time of 42.9 ±
34.9 h for the left colonic segment and 23.6 ± 21.4 h for the recto-sigmoid colon, resulting in a total
colonic transit time of 96.9 ± 62.0 h. Focusing on colonic drug delivery, important lessons need to be
kept in mind. Despite the reasonably constant small intestinal transit time (cfr. supra: Scintigraphy), the
food or drug matrix spends a considerable time at the ileocecal junction, which functions mechanistically
as a valve allowing fecal material to become more concentrated before transfer to the colon (Davis et
al., 1986). For time-dependent colonic drug delivery systems, which will release drug after a
predetermined lag time, movement through this junction can be a significant variable (Jose et al., 2009;
a b
11 Kinget et al., 1998; Pišlar et al., 2015; Wilson, 2010). Moreover, in case of GI disorders (ulcerative
colitis and Crohn’s disease), episodes of diarrhea can reduce colonic transit times in such a way that
drug delivery at the site of the colon will be inefficient (van der Sijp et al., 1993).
Comparing different studies regarding GI transit times is quite challenging when using radio-opaque
markers: most studies do not report appropriately what happened after the intake of the markers
(mealtimes, medication use, personal activities, etc.). Therefore, standardized protocols are necessary
and indispensable in order to further rely on this technique and to allow comparison between results
with other studies.
d. Ultrasonography
As already mentioned, scintigraphy is the gold standard for measurement of GE (Wilding, 2002). The
emitted radiation and high costs, however, are still well-argued reasons to look for alternative
techniques. Ultrasonography (also known as echography) is a non-invasive, low cost and safe
methodology to study GE in patients and healthy persons (Gilja et al., 1999). A transducer is placed on
the abdominal skin, with contact gel to enhance wave conduction, and generates an ‘ultrasound’ with
such a high frequency that is not audible to humans. These ultrasound waves will travel through the
body and will be echoed back to the interface between hard and soft structures of tissues to make a
distinction across the different organs. These reflected waves will be displayed as images
(ultrasonograms) to the operator (Bateman and Whittingham, 1982).
In 1984, King et al. applied transabdominal two-dimensional (2D) ultrasonography in order to study (i)
terminal antral contractions, (ii) duodenal contractions, (iii) forward flow movement of gastric content
and (iv) retrograde flow movements through the pylorus (King et al., 1984). Seventeen healthy
volunteers were given a test meal of 500 ml of water flavored with orange juice and warmed to 37°C,
to which 0.5 g chopped and sieved bran was added. Subsequently, volunteers were sitting in an upright
position and the upper abdomen was scanned directly after ingestion of the meal up to 30 min (Figure
12
Figure 6: (a) Ultrasonographic image of the upper abdomen after ingestion of the test meal. Stomach and proximal duodenum are distended and bran particles can be seen as small white specks suspended in gastric contents. Concentric antral contraction, which is throwing an acoustic shadow, is travelling along the mid portion of the antrum towards the pylorus. (b) Peristaltic wave has progressed along the antrum and is now approaching the pylorus. (c) An overview of all different organs that can be detected after ultrasonography. Adopted from King et
al. (1984). Copyright British Medical Journal 1984.
In the same study, four volunteers were selected to investigate antroduodenal motility and transpyloric
fluid movement (Figure 7).
Figure 7: Comparison of terminal antral contractions, duodenal contractions, forward flow and retrograde flow through pylorus with their corresponding duration of time. Adopted from King et al. (1984). Copyright British Medical Journal 1984.
Duodenal contractions can be seen to occur after the midpoint of the antral contractions. Forward flow
of gastric content was mostly observed immediately before or after terminal antral contractions, whereas
retrograde flow of intestinal contents was observed immediately before duodenal contractions take
[image:14.595.187.404.446.655.2]13 place. Accurate assessment of intragastric volumes, however, was not possible with this
two-dimensional technique. A three-two-dimensional (3D) view of the stomach can assess the volumes of the
different gastric compartments and their emptying characteristics. In addition to the ultrasound
transducer, a commercially available magnetometer-based position and orientation measurement (POM)
was added to the system in order to obtain 3D images (Gilja et al., 1997). Examples of 3D wireframes
of the stomach after intake of a 500 ml soup meal are depicted in Figure 8. The average compartmental
[image:15.595.162.411.252.574.2]postprandial gastric volumes in 14 healthy male volunteers are shown in Figure 9.
Figure 8: 3D wireframes of the stomach of a healthy subject reconstructed from ultrasound images obtained by magnetic scanhead tracking. Panel A presents fasting stomach volumes, whereas panels B, C and D present postprandial stomach volumes after 5, 10 and 15 min of intake
14
Figure 9: Gastric volumes in the distal, proximal and total part of the stomach as a function of time after administration of 500 ml of soup to 14 male volunteers. Gastric volumes were measured in the distal and proximal compartments of the stomach. Adopted from Gilja et al.
(1997). Copyright Elsevier 1997.
The observed T1/2, G was 22.1 ± 3.8 min. Intragastric volume distribution, expressed as the ratio between
proximal and distal gastric volumes, varied from 3.6 ± 2.1 (5 min after meal) to 2.7 ± 1.9 (30 min after
meal), indicating progressive redistribution of the meal towards the distal stomach. This technique is
easy to handle, non-invasive and does not involve the use of radiation. The success of this technique,
however, is totally dependent on the expertise of the researcher.
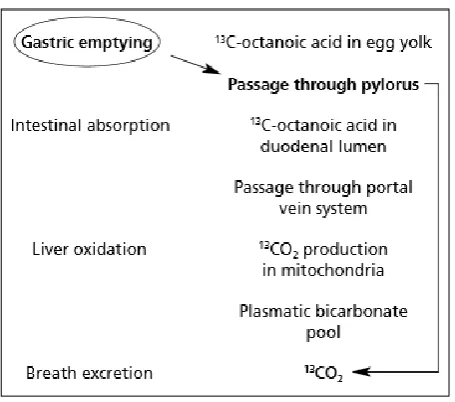
e. Breath test
The gastric emptying breath test is a non-invasive, non-operator dependent technique, based on stable
(e.g. 13C) or radioactive (e.g. 14C) isotope testing in the breath after ingestion of a labeled solid and/or
liquid meal. In a typical protocol, 13C or 14C octanoic acid (i.e. medium chain fatty acid) is solubilized
in egg yolk and cooked in an omelet, which is eaten by the subject together with a piece of toast and a
glass of water (Ghoos et al., 1993; Perri et al., 2005). Once the omelet has reached the duodenum, rapid
disintegration of the labeled solid phase occurs with subsequent absorption and oxidation of 13C/14C
octanoic acid to 13CO
2/14CO2, respectively, which can be measured in breath samples of the
volunteer/patient. Since gastric emptying to the duodenum is the rate-limiting step in this entire process,
the rate of 13CO
2/14CO2 appearing in the breath as a function of time is reflecting the GE rate. The stable
isotope 13C is preferred over radioactive 14C to reduce radiation burden to patients, volunteers and the
15 the respective solid and liquid parts of the meal is needed. The metabolic pathway is depicted in Figure
[image:17.595.186.414.131.332.2]10.
Figure 10: Subsequent metabolic steps of 13C-octanoic acid in egg yolk after oral administration. Adopted from Perri et al. (2005). Copyright European Review for Medical and Pharmacological Sciences 2005.
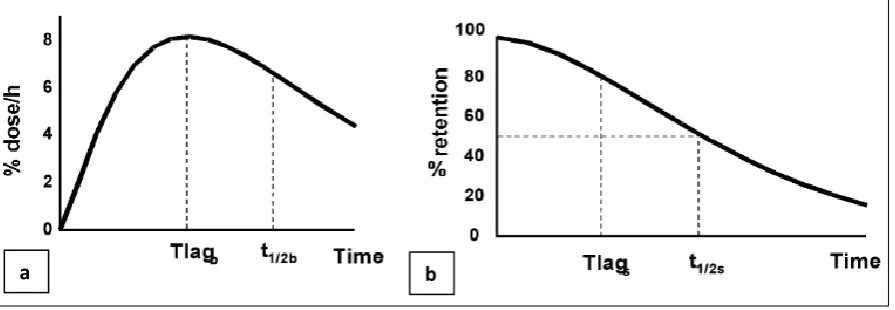
Ghoos and colleagues collected exhaled 13CO
2 from 36 subjects (16 healthy volunteers and 20 patients
with dyspeptic symptoms) after eating a scrambled egg of which the yolk was doped with 100 mg 13C
octanoic acid and the egg white was labeled with 3 mCi of 99mTc albumin colloid (Ghoos et al., 1993).
Half-life of gastric emptying (T1/2, G) was estimated based on the 13CO2 breath excretion (% dose/h) and
gamma radiation (% retention of 99mTc albumin colloid) by making use of mathematical derivations
16
Figure 11: (a) Breath test: 13CO2 breath excretion in (% dose/h) as a function of time after ingestion of 13C-octanoic acid. Tlagb stands for the time to maximum 13CO2 excretion; t1/2b is the breath test determined GE time. (b) Scintigraphic test: % gastric radioactivity retention as a function of time after ingestion of 99mTc. T1/2s is the time at which half of the γ-emitting labeled meal is retained in the stomach and Tlags is the time needed for the antral contractions to grind solids into particles small enough to pass through the pylorus. Adopted from Perri et al.
(2005). Copyright European Review for Medical and Pharmacological Sciences 2005.
T1/2, G derived from the breath test (t1/2b) and from the scintigraphy study (t1/2s) showed a correlation
coefficient of 0.89. A mean value of 72 ± 22 min was observed for t1/2b. This study demonstrated that
the breath test can be a valid alternative to scintigraphy to assess GE.
As many factors (i.e. disease, drugs, gastric surgery, endocrine disorders, etc.) can accelerate or delay
GE, these should be taken into account in drug and formulation development for these specific
populations. To assess acceleration and delay in GE, Maes and colleagues performed a study in nine
healthy volunteers using 14C octanoic acid breath test for solids (Maes et al., 1994). On three consecutive
days, volunteers were tested in three different conditions: (i) without medication, (ii) 30 minutes after
intravenous administration of 200 mg of erythromycin (motilin-receptor agonist with strong prokinetic
properties) and (iii) 60 minutes after oral administration of 30 mg of propantheline (an anti-muscarinic,
transit-inhibiting agent). In all nine subjects, T1/2, G decreased after intravenous administration of
erythromycin (p = 0.0020) and increased after oral administration of propantheline (p = 0.0168), as depicted in Figure 12.
17
Figure 12: Comparison of T1/2, G in each individual in normal conditions and after administration of erythromycin and propantheline. Adopted from Maes et al. (1994). Copyright British Medical Journal 1994.
For all three test conditions, T1/2, G were 37.44 ± 21.32 min (erythromycin), 71.22 ± 26.68 min (basal),
and 141.44 ± 87.74 min (propantheline). These values can serve as reference data for optimization of in vitro/in silico models. These half-emptying times can easily be programmed in in vitro models that are frequently applied to predict the in vivo performance of a drug in postprandial conditions. For example, standard implemented T1/2, G in TIM-1 model is set on 80 min, mimicking the in vivo situation in fed
state conditions (Brouwers et al., 2011). In case of an accelerated or delayed state of GE, the T1/2, G can
easily be reprogrammed (Hens et al., 2014). Which technique to use for measuring GE (scintigraphy,
acetaminophen absorption technique, breath test, ultrasonography, etc.), will depend on the impact of
the technique for the volunteer/patient, ethical considerations, costs and facilities available for
performing the study.
f. Magnetic resonance imaging (MRI)
Magnetic resonance imaging (MRI) images the hydrogen protons whose signal characteristics change
depending on their physicochemical environment, mobility and concentration. It has multi-planar
capability, good imaging speed and resolution, and superb soft tissue contrast, which is tunable to
different tissues and fluids. After an initial slow development, MRI of gastrointestinal function has
18 unique data on the undisturbed bowel environment and therefore has the ability to improve the in vitro/in vivo relevance of drug disposition modeling. MRI is inherently suited to image fluids and organ volumes. Gastric volumes and GE have been measured since the inception of GI MRI (Evans et al.,
1993; Schwizer et al., 1992; Stehling et al., 1989). Gastric secretion has been investigated by monitoring
the dilution of a gadolinium (Gd) contrast agent (Curcic et al., 2015; Hoad et al., 2015) and gastric
volume data are increasingly being handled using semi-automated data processing (Bharucha et al.,
2014). More recently, the attention is shifting to monitoring the in vivo environment of standard drug testing conditions. A recent study investigated gastric fluid contents under the standard fasting and fed
oral dosage form testing conditions (Mudie et al., 2014, Koziolek et al., 2014). This work has been
extended to the small bowel environment. MRI showed that liquid in the small bowel is present in
discrete liquid “pockets” (Schiller et al., 2005); these have been quantified under conditions representing
bioavailability/bioequivalence (BA/BE) studies at fasted baseline and after a 240 ml glass of water,
using methods validated against naso-duodenal infusion (Hoad et al., 2007). The method is based on a
heavily T2 (i.e. time when 63% of the transverse magnetization has decayed) weighted sequence that
images only freely mobile water. The signal from less mobile water molecules, for instance associated
[image:20.595.157.471.484.594.2]with mucus, will have decayed before the imaging time and is therefore not included (Figure 13).
Figure 13: MRI images of the stomach and small bowel of a healthy volunteer after ingestion of 240 ml water. (A) stomach; (B) abdomen. (C) Maximum intensity projection small bowel water pockets. Separate water pockets are rendered in different colors.
Adopted from Mudie et al. (2014). Copyright ACS 2014.
MRI has been used in a limited number of studies to directly visualize a drug product. In one study, the
intragastric distribution of a colloidal carrier based on Gd-labeled liposomes was studied (Faas et al.,
2001). In another study, MRI was used to monitor the gastric position and residence time of
gastric-retentive tablets labeled with iron particles or Gd chelates (Steingoetter et al., 2003). In addition, MRI
has been used to indirectly visualize the effect of an oral formulation on the GI system. These include
A B C
Liver
Stomach
Spleen
Spine
Duodenum
Jejunum
Ileum Liver
Duodenum
Jejunum
19 imaging the effect of a polyethylene glycol bowel preparation on bowel fluids distribution and colonic
motility (Marciani et al., 2014) and the formation and time courses of sodium alginates formulations for
gastroesophageal reflux (Marciani et al., 2002; Sweis et al., 2013). Cine-MRI can image the GI tract
with sufficient speed to visualize motility. This can be done on the stomach looking at antral motility
frequency and amplitude (Kunz et al., 1998; Marciani et al., 2001; Schwizer et al., 1994, 1996; Wright
et al., 1999). More recently, the technique has been extended to the small bowel (Hahnemann et al.,
2015; Menys et al., 2014; Odille et al., 2012) and to the colon (Buhmann et al., 2005; Menys et al.,
2014). Small bowel motility is most commonly acquired under MRI enterography (Patak et al., 2001)
whereby the subjects are asked to ingest a large amount of fluid to distend the bowel walls. Respiratory
motion is a problem for quantitation. Either breath hold acquisition (Froehlich et al., 2005) or
post-processing data registration techniques (Hamy et al., 2014) can be employed to overcome this issue and
enable quantitation. Another parameter that MRI can measure is bowel transit. This has been done using
‘transit capsule markers’ filled with MRI-visible fluid. The imaging was based either on standard 1H
MRI (Chaddock et al., 2014; Schiller et al., 2005) but also on 19F MRI (Hahn et al., 2011, 2012, 2014),
an interesting approach though the availability of the necessary hardware is scarce. The position of the
MRI markers can be visualized and transit determined in a fashion similar to the radiological methods
(Chaddock et al., 2014). A limitation is the relatively large size of the capsules which are likely to stay
inside the stomach until a migrating motor complex moves them into the small bowel. Hence their transit
time may differ from that of small tablets but this limitation could be removed by the development of
smaller markers or by making use of magnetic marker monitoring (MMM). In this approach, an oral
dosage form will be marked with ferromagnetic material to create a magnetic dipole that can be traced
in the gastrointestinal tract as a function of time after magnetization in a strong magnetic field. As such,
the transit of these dosage forms can accurately be visualized as 3D pathways, enabling the evaluation
of, for instance, gastric residence and emptying of an oral dosage form. This is demonstrated in Figure
14, where the passage of a non-disintegrating capsule through the stomach of a healthy male subject is
20
Figure 14: Passages of a non-disintegrating capsule through the stomach monitored in four repeated experiments in a healthy volunteer. (a) Experiment 1 (gastric emptying time: 24 min), (b) Experiment 2 (gastric emptying time: 20 min), (c) Experiment 3
(gastric emptying time: 14 min) and (d) Experiment 4 (gastric emptying time: 25 min). Adopted from Weitschies et al., 2010. Copyright Elsevier 2010.
4. Invasive methodologies
a. Intraluminal sampling methodology
Intraluminal sampling and subsequent characterization of the aspirated human gastrointestinal fluids is
a versatile approach to investigate different aspects of drug and formulation behavior. The use of
intestinal catheters to explore drug and formulation behavior dates back to the eighties, starting with
perfusion of intestinal segments to evaluate in vivo drug permeability, stability and dissolution. Afterwards, the sampling technology was applied to study the intraluminal behavior of orally
21
Figure 15: Schematic of tube placement with aspiration channels in the stomach (1), duodenum (2), proximal jejunum (3), and distal jejunum (4).
In 1985, Jobin et al. perfused different regions of the GI tract with a solution of metoprolol.
Disappearance of the drug over time in the aspirated intestinal fluid and appearance in the plasma
indicated intestinal absorption. Approximately 60% of drug that was emptied from the stomach was
absorbed from the duodenum, whereas 50% of metoprolol that left from the duodenum was absorbed
from the proximal jejunum (Jobin et al., 1985). A more refined technique to study human permeability
for different drug compounds is the Loc-I-Gut® perfusion technique. A multilumen catheter is equipped
with two balloons which are inflated to isolate a specific region of interest along the intestinal tract that
is perfused with a drug solution. Based on the disappearance of the drug in the aspirated intestinal fluid,
the net human effective permeability can be calculated (Dahan et al., 2012; Lennernäs, 1998). Moreover,
the Loc-I-Gut® perfusion technique has also been widely applied to explore intestinal drug metabolism
(Petri et al., 2003; Tannergren et al., 2003) and in vivo dissolution of drugs in the intestinal tract when the segment of interest will be perfused with a suspension of the drug (Bønløkke et al., 1997).
Aside from intestinal perfusion, intubation techniques allow exploring intraluminal drug concentrations
after oral administration of drug formulations. In combination with the simultaneous assessment of
systemic drug concentration, this allows the evaluation of (i) how a drug and its corresponding
1 2 3
22 formulation behave after oral intake, (ii) how this behavior affects drug absorption and (iii) how certain
GI variables (e.g. GE, pH, secretions, transit times, etc.) influence oral drug disposition in man
(Brouwers and Augustijns, 2014). Many drug compounds nowadays exhibit very poor aqueous
solubility. Their fate depends on the formulation or dosing strategy in order to achieve sufficient
therapeutic systemic concentrations. Enabling formulations such as solid dispersions, nano- and
microparticles and cyclodextrin/co-solvent based solutions are examples of methods used to increase
solubilization or achieve supersaturated solution of the drug, with the ultimate goal of enhancing oral
absorption. Aspiration of gastric and duodenal fluids in parallel with blood sampling resulted in new
insights into how these enabling strategies behave after oral intake (Brouwers et al., 2006; Geboers et
al., 2015; Hens et al., 2015a; Stappaerts et al., 2015). Moreover, drug solubility measurements in these
aspirated fluids can reveal whether the drug was supersaturated at the time of aspiration or directly
started to precipitate (Hens et al., 2015b; Psachoulias et al., 2011; Van Den Abeele et al., 2015).
In addition to being instrumental in exploring gastrointestinal formulation behavior, the sampling
technique can also be used to collect blank gastrointestinal fluids. These fluids can then be used as
solvent system in in vitro assays (e.g. solubility determination (Augustijns et al., 2014; Kostewicz et al., 2014b), permeability assays (Wuyts et al., 2015a, 2015b) and supersaturation evaluation (Bevernage et
al., 2013)), or, upon characterization, as reference for the optimization of simulated gastrointestinal
fluids. Characterization of intestinal fluids collected from healthy volunteers in terms of pH, bile salts,
phospholipids, cholesterol and lipid degradation products indicate large differences in composition
which potentially implies differences in solubilizing capacity that may eventually account for
inter-individual variations in systemic exposure after oral administration of lipophilic drugs (Kalantzi et al.,
2006; Lindahl et al., 1997; Riethorst et al., 2015). Unraveling the composition of these intestinal fluids
has led to the development of simulated intestinal fluids (fasted and fed state simulated intestinal fluids)
and have been further optimized throughout the years. Substantial inter-individual differences have also
been demonstrated by electron microscopy imaging of the colloidal structures present in intestinal fluids,
especially after intake of a meal (Fatouros et al., 2009; Müllertz et al., 2012; Riethorst et al., 2016).
23 liquid content, buffer capacity and pH compared to the present fluids in the upper small intestine (Reppas
et al., 2015). These differences may significantly influence the performance of drugs during their
residence in the lower parts of the intestine. Unraveling the composition of colonic fluids led to better
insights in colonic drug delivery strategies, resulting in pH-responsive and bacterially-triggered drug
delivery technology (Basit et al., 2004, 2009; Ibekwe et al., 2008; McConnell et al., 2008; Vertzoni et
al., 2010a), as well as optimized dissolution media to assess the performance of for instance
colon-targeted drug formulations in the lower intestine. These findings have led to the development of
biorelevant fasted and fed state simulated colonic fluid (FaSSCoF and FeSSCoF, respectively),
developed to mimic the fluids collected from the ascending colon in healthy adults (Vertzoni et al.,
2010b). Thinking beyond the intestine, a lot of interest goes out to the dynamic yet complex environment
of the stomach (Van Den Abeele et al., 2016b). The acidic pH as reported in literature may have a major
impact on oral drug behavior along the GI tract in case of weakly basic compounds. Reported median
values ranging from 1.55 to 1.8 may enhance drug’s gastric dissolution, depending on the dissociation
constant(s) of the drug compound. Besides gastric pH, gastric motility has shown to affect drug
distribution along the stomach (Van Den Abeele et al., 2016a). Further studies should focus on how
gastric motility will affect drug appearance in plasma in terms of Cmax and Tmax which may explain the
failure of bioequivalence studies in some cases due to variability in gastrointestinal motility among
subjects when an oral drug is administered (Talattof et al., 2016a). Characterization of gastric fluids has
led to the development of simulated gastric media, referred to as fasted and fed state simulated gastric
fluid (FaSSGF and FeSSGF, respectively). Biorelevant implementation of pH, bile salts and
phospholipids is reflected in FaSSGF, whereas FeSSGF is composed of equal amounts of FaSSGF and
a liquid meal, as frequently applied in intraluminal profiling studies in fed state conditions (Vertzoni et
al., 2007).
Site-specific aspiration has led to the exploration of formulation behavior in the more distal parts of the
GI tract, especially when dealing with delayed/controlled release formulations (Hens et al., 2016).
Measuring drug concentrations at multiple site-specific locations along the GI tract will expand our
24 redesigned aspiration catheter (3 meters in length with 4 aspiration ports located in the stomach,
duodenum/proximal jejunum, mid jejunum, and distal jejunum/ileum, depicted in Figure 15) to quantify
mesalamine concentrations along the various regions of the GI tract following ingestion correlating
pharmacokinetics with local availability of medications within the GI tract (Brown et al., 2014).
Previously, Marathe et al. showed that the systemic availability of metformin, which is primarily
absorbed in the small intestine, is significantly improved with delayed GE (Marathe et al., 2000). Oberle
and Amidon linked the double peak phenomenon in plasma levels of cimetidine with the variable gastric
emptying and transit along the intestinal tract combined with a short plasma elimination half-life and
poor absorption (Oberle and Amidon, 1987). As stated by Brouwers and Augustijns, gastrointestinal
profiling has moved forward last decades to evaluate intraluminal drug and formulation behavior in
humans. Intensified use of this technique will guide us to the next level in optimization of in vitro and
in silico tools for intestinal absorption (Brouwers and Augustijns, 2014).
b. Small intestinal manometry
GI motility and the associated migrating motor or myoelectric complex (MMC) play a crucial role in
transporting ingested material from the stomach through the intestine and into the colon by means of
segmental and peristaltic contractions (Cannon, 1912; Deloose et al., 2012). The propagating wave of
peristalsis is regulated by hormones, paracrine signaling, and the autonomic nervous system, while
segmentation is carried out by longitudinal muscle relaxation and circular muscle contraction thereby
mixing GI contents with digestive enzymes and ensuring composition uniformity and sufficient
epithelial contact for absorption (Culen et al., 2013). The GE rate is controlled by gastric distention
promoting emptying and intestinal stimuli slowing emptying (Hunt, 1963). Contractile activity propels
matter from the stomach into the small bowel where segmental contractions beginning in the duodenum
reach the terminal ileum in approximately 2 hours (Grivel and Ruckebusch, 1972). The MMC is defined
by three distinct phases: phase I is an inert period with little activity; phase II features sporadic
contractions gradually ascending in magnitude but with little net forward movement of gastric contents;
and phase III is characterized by powerful, high frequency contractile bursts that promote emptying of
contents where peak flow rates are observed (Deloose et al., 2012; Kerlin et al., 1982). As the contractile
25 the distal small bowel (Sarna and Otterson, 1989). A typical phase I through III tracing is shown in
Figure 16, adapted from Hansen (Hansen, 2002).
Figure 16: Tracing showing phase I, phase II, and phase III of the fasting cycle in the antrum (A1 & A2), duodenum (D1 & D2), and jejunum (J1 & J2).Adopted from Hansen (2002). Copyright Physiological Research 2002.
In the context of drug products, GI motility has become the focus of an increasing number of studies,
especially in how it affects formulations with respect to transit and dissolution (Chen et al., 2013; Greiff
and Rowbotham, 1994). Recent modeling approaches have been undertaken to incorporate variable GI
transit times (Hénin et al., 2012) as well as simulate such physiological effects on oral drug products
and their GI residence times, which can impact the extent of absorption and ultimately
bioavailability/bioequivalence (Talattof et al., 2016b). Motility can be measured by means of
manometry, employing catheters perfused with deionized water to record intestinal pressure in the
duodenum, jejunum, and ileum. The spacing of the ports on motility catheters serves not only for
recording of local pressure but also for determining the propagation velocities of contractile activities.
The pressure is measured with a capillary infusion pump system with pressure transducers transforming
intraluminal pressure into electrical signals via the strain gauge transducers (Figure 17). With improving
technologies, high resolution manometric studies can potentially reveal new insights into of GI motility.
It is thus important to acknowledge the complexities of GI motility as a source of tremendous intrinsic
variability that needs further investigation, perhaps linked with higher-level physiology of slow wave
26 remain unclear (Myers et al., 2002; O’Grady et al., 2010).
Figure 17: A 16-channel pressure recording of an anterograde antroduodenal phase III of the MMC (upper panel) and two sequences shown with high temporal resolution (lower panel). The start point of the duodenal pressure waves is indicated by a black dot and the direction of propagation of the duodenal pressure waves indicated. A, antrum; D, duodenum; S, pyloric sleeve. Adopted from Castedal and Abrahamsson
(2001). Copyright Blackwell Science Ltd 2011.
c. Colonic manometry
The colon represents the distal part of the GI tract and plays an important role in the maintenance of
electrolyte and fluid balance, in the metabolism of carbohydrates and bile acids, in the absorption of
fatty acids and as a reservoir for feces. It is generally believed that it achieves these functions through
the prolongation of the residence of its contents inside the lumen, which explains the longer colonic
residence time as compared to small bowel transit time (approximately 35 hours vs 4 hours, respectively)
in healthy subjects (Phillips, 1984).
Colonic motility is an important determinant of colonic transit and can be studied by different techniques
including colonic manometry. As reported by Dinning and colleagues, the study of colonic motility was
performed with catheters applying different recording systems (water-perfused or solid state) but
generally allowing to measure the pressure created by colonic contractions on a limited number of
pressure sensors (from 4 to 16) spaced 7-12 cm one from each other (conventional or low-resolution
[image:28.595.225.361.129.393.2]27 are complicated by a number of technical difficulties that typically necessitate partial or total removal
of colonic contents in order to position a recording catheter. Therefore, most of these studies have been
conducted in pre-cleaned colon applying a colonoscopy-assisted retrograde intubation via the anus. Only
a limited number of studies have been conducted using retrograde intubation in non-prepared colon (Rao
et al., 2001). Even fewer studies have been performed by means of anterograde intubation via
naso-colonic intubation (Bampton et al., 2001).
In the case of 24-hours conventional manometry, it has been demonstrated that colonic motility mainly
consists of non-propagated activity as opposed to propagated sequences of low amplitude (5-60 mmHg)
and high amplitude (more than 100 mmHg) occurring only 2.4 ± 0.1 and 0.4 ± 0.1 per hour, respectively
(Bampton et al., 2001). Both anterograde and retrograde propagating sequences have been described as
well as simultaneous pan-colonic low-amplitude pressurization events (Bampton et al., 2001; Rao et al.,
2001). In healthy subjects, colonic motility in general is reduced during sleeping time and significantly
increases at awakening and during meals (Rao et al., 2001). It has been reported that anterograde
propagating sequences occur more frequently during the awaking period, simultaneous sequences
significantly increase at awakening and after the meal, retrograde sequences represent a minority of the
colonic motor patterns, and high-amplitude propagating sequences occur at awakening and about 1-2
hours after the meal (Bampton et al., 2001; Rao et al., 2001).
Recently, the introduction of the high-resolution manometry (HRM) has revealed new aspects of the
colonic motility in healthy volunteers (Dinning et al., 2013). Two types of catheters have been applied:
a fiber-optic catheter with up to 90 recording sensors spaced 1 cm from each other (Dinning et al., 2013)
and a solid state catheter with up to 40 pressure sensors spaced 1-2.5 cm from each other (Chen et al.,
2014; Corsetti et al., 2016). In a study with a fiber-optic catheter, the majority of activity in the
postprandial period were retrograde propagating sequences, mainly occurring in the sigmoid region
(Dinning et al., 2013). The relevance of simultaneous pressurization sequences, previously observed in
conventional manometry studies, was confirmed in several studies using a HRM solid state catheter
(Chen et al., 2014; Corsetti et al., 2016). Based on preliminary data in healthy adults, this activity seems
28 decreases afterwards, in concert with increased occurrence of retrograde propagating colonic sequences
in the left colon (Chen et al., 2014; Corsetti et al., 2016).
With respect to the role of different colonic motor patterns on transport of colonic contents, few data are
available in the literature. In studies combining the conventional manometry with scintigraphic
assessment of bolus movements, it has been demonstrated that colonic propulsion is relatively infrequent
(only 30% of propagating sequences are propulsive) and is associated with propagating sequences
originating in the more proximal part of the colon, which have a higher amplitude and lower velocity of
propagation (Cook et al., 2000). In studies focusing on the pre- and postprandial period, it has been
observed that before the meal, the presence of simultaneous sequences associates with almost no
movement of colonic contents (Bazzocchi et al., 1990). During the first 30 minutes after the meal, the
presence of simultaneous and retrograde sequences in the sigmoid colon is associated with movement
of colonic contents in retrograde direction (Bazzocchi et al., 1990). After this period, the colonic
contents move both in anterograde and retrograde direction until the occurrence of the high-amplitude
propagating sequences, which normally move the majority of colonic contents from the proximal part
(transverse) to the distal colon, inducing the sensation and, in a next step, the activation of defecation
(Bazzocchi et al., 1990; Herbst et al., 1997). Anterograde and retrograde low-amplitude propagating
sequences are believed to play a major role in the mixing function, which allows the colon to absorb
water and nutrients and slow the progression of luminal contents (Phillips, 1984). The increase of both
simultaneous and retrograde activity, observed by both conventional and high resolution manometry in
the left colon during the postprandial period, has been hypothesized to play a role in facilitating the
retrograde transport of colonic contents to the transverse colon, producing the necessary distension to
generate high-amplitude propagating sequences occurring later after the meal (Bazzocchi et al., 1990).
Regarding colonic motility alterations in bowel disorders, all but one study used conventional
manometry. Overall, these studies have demonstrated that the colonic response to a meal (i.e. the number
of retrograde propagating sequences and the number of high-amplitude propagating sequences) is
reduced in adults with functional constipation as compared to healthy subjects (Dinning et al., 2013). In
29 sequences was increased, while simultaneous and retrograde activity was less frequent (Herbst et al.,
1997). A similar increase in anterograde propagating sequences has been observed in patients with
moderately active ulcerative colitis, but not in patients in remission (Bassotti et al., 2014).
When compared with the small bowel, the colon in general plays a minor role in the absorption of oral
drugs. However, its role is relevant for the absorption of certain drugs specifically delivered to the colon
or metabolized to their active form in the colon (e.g. sulfasalazine) for local treatment (i.e. inflammatory
bowel disease). Moreover, numerous studies have recently shown the importance of the colon as a target
for oral absorption: large drug molecules such as proteins and peptides that are known to degrade in the
acidic environment of the stomach may show moderate colonic absorption, if delivered intact in the
colon (Amidon et al., 2015). Finally, the colon may contribute to the absorption of drugs with extended
or delayed absorption kinetics, including highly dosed, low solubility drugs and modified release dosage
forms (Markopoulos et al., 2015).
Several factors have been reported to influence the absorption and activity of colon delivered drugs,
including low volume and high viscosity and low volume of colonic fluids (challenging drug
dissolution), colonic pH (the colonic pH varies across the different segments of the colon and this can
affect the pharmacokinetic and pharmacodynamics of drugs), the presence of bacteria (which produce
different enzymes able to metabolize drugs and to induce the formation of active or inactive metabolites)
and the colonic transit time (which can modify the bioavailability of drugs as such) (Amidon et al., 2015;
Kostewicz et al., 2014a).
Considering that colonic manometry needs bowel preparation and positioning assisted by colonoscopy,
this technique could be less attractive as compared to other non-invasive methodologies (e.g. cine-MRI)
to study the influence of colonic motility on oral absorption and activity of drugs. However, it can be
considered in studies aiming to assess the influence of colonic motility on colonic and systemic profiling
of an orally administered drug targeting the colon. In these cases, catheters to collect colonic fluids can
be advanced together with the manometry probe in the colon and maintained during the entire duration
30 d. Telemetry
The interest in telemetric capsules in the field of oral biopharmaceutics has increased in recent years due
to significant progress in developing supporting technologies and the improved accessibility of certified
commercial products. Telemetric capsules are used by physicians to examine the GI tract for organic
pathologies and to characterize transit conditions in health and disease. For the pharmaceutical scientist,
the spectrum of applications is wider as both the sensor and the delivery technologies are useful. These
allow identification of the luminal conditions, visualization of disintegration/drug release in the gut, and
calibration of regional drug absorption. Apart from the marketed products that are presented in Table 1
and discussed below, recent publications describe prototypes developed to overcome limitations of the
currently available devices, incorporating functions such as anchoring and repositioning, steerable
31
Table 1: Selection of telemetric capsules used in the field of oral biopharmaceutics.
Dimensions
(mm x mm)
Application in oral
biopharmaceutics
Remarks
Heidelberg
pH capsule 21 x 8
Investigation of luminal pH profiles
Extensive experience (> 100 studies)
SmartPill® 26 x 13 Investigation of luminal pH,
temperature and pressure profiles CE* certification
Enterion® 32 x 11 Regional drug absorption studies Drug actively released as bolus
Tracking by scintigraphy
InteliSite® 35 x 10 Regional drug absorption studies Drug passively released as bolus
Tracking by scintigraphy
IntelliCap® 27 x 11 Regional drug absorption studies
Investigation of luminal pH and temperature profiles
Drug actively released either in controlled manner or as bolus
CE certification
PillCam® 26 x 11 Visualization of in vivo behavior
of oral dosage forms
CE certification
*CE: Conformité Européene/ European Conformity
The GI pH value is one of the major parameters determining intraluminal solubility of the majority of
orally administered drugs, but unfortunately, the number of techniques to measure GI pH values is
limited. In contrast to commonly applied aspiration techniques and pH catheters, telemetric capsules
represent a comfortable alternative. As they are ingested in the same way as capsules or tablets and
move freely through the gut, they generate profiles that provide valuable information about the
physiological transit conditions of solid oral dosage forms. A major drawback of pH-sensing telemetric
capsules is the pH drift of the commonly applied ion-selective field effect transistor (ISFET) sensors
32 (Abbas et al., 2014). One of the first systems used in biopharmaceutics, was the Heidelberg pH capsule.
In 1990, Dressman and co-workers used this system to measure GI pH profiles in the stomach and
duodenum after a high-fat meal (Dressman et al., 1990). These data provided important insights into fed
state human GI physiology and were the basis for the development of biorelevant dissolution tests.
In addition to high-temporal pH and temperature monitoring, the SmartPill® system offers the unique
opportunity to measure pressure within the GI tract (Cassilly et al., 2008). The GI motility can be crucial
for oral drug delivery as high pressures can cause unwanted drug release profiles such as dose dumping.
In contrast to catheters used for manometry, SmartPill® is freely moving within the GI tract; thus, the
generated pressure profiles are representative for large non-digestible dosage forms such as hydrogel
matrix tablets. The transit conditions after ingestion of the high-caloric, high-fat FDA standard breakfast
used for fed state BA/BE studies were determined by use of SmartPill® in a recent study by Koziolek
and co-workers (Koziolek et al., 2015) (Figure 18). It was shown in this study that the maximum
pressures in the human GI tract amount to 293 ± 109 mbar and typically arise shortly before or during
[image:34.595.172.431.433.613.2]GE (Koziolek et al., 2015).
Figure 18: Individual pH (black), pressure (red) and temperature (blue) profiles over time measured by administering the SmartPill system 30 min after beginning of the intake of the high-caloric, high-fat standard breakfast recommended for food-effect studies. (GE: gastric
emptying, CA: colonic arrival). Adopted from Koziolek et al. (2015). Copyright Elsevier 2015.
Telemetric capsule systems can further be used to study regional drug absorption in the GI tract. As
such, they may aid development and characterization of new formulations as the presence of absorption
windows or the potential for colon targeting can be evaluated. Drug release is initiated either passively
33 Enterion®, IntelliCap®). The volume that can be released is typically below 1 ml (Goffredo et al., 2015).
The IntelliCap® system is currently the most advanced system. It can be programmed to release a drug
either continuously or as a bolus by a miniaturized pump (Becker et al., 2014; van der Schaar et al.,
[image:35.595.183.412.181.381.2]2013). The system consists of a body and a cap (Figure 19).
Figure 19: The orally swallowable IntelliCap® system to quantify regional drug absorption in the human GI tract. Adopted from Becker et al., 2014. Copyright Springer Link 2014.
The cap is clipped onto the body and consists of a medication container that can be filled with a drug
liquid. Based on real-time pH and temperature profiles, the drug can be released at a certain region of
the GI tract making the system a valuable tool for regional drug absorption studies (Becker et al., 2014).
Söderlind and co-workers investigated the value of the IntelliCap® system for regional drug absorption
studies by comparing the plasma concentration profiles of metoprolol (BCS class I) after three different
release profiles with the administration of an oral solution. They showed that the system was suitable to
deliver the drug in a controlled manner over a period of up to 14 h. However, the IntelliCap® version
used in this study was not able to deliver uniform drug pulses, which would limit its suitability for
studies aiming at the immediate release of a drug at a certain place (e.g. colon targeting) (Söderlind et
al., 2015). Recently, an updated version of the IntelliCap (IntelliCap FR) was developed to ensure the
fast release of a drug in either liquid or solid form; however, clinical data proving the usefulness of this
![Figure 3: Scintiscan of [113mTn]-labeled sucralfate after swallowing 20 ml labeled suspension](https://thumb-us.123doks.com/thumbv2/123dok_us/8570752.368440/9.595.138.434.73.348/figure-scintiscan-mtn-labeled-sucralfate-swallowing-labeled-suspension.webp)