For Peer Review
Topography-driven isolation, speciation and a global increase of endemism with elevation
Journal: Global Ecology and Biogeography Manuscript ID GEB-2015-0069.R3
Manuscript Type: Research Papers Date Submitted by the Author: 16-Mar-2016
Complete List of Authors: Steinbauer, Manuel; University of Bayreuth, Department of Biogeography Field, Richard; University of Nottingham, School of Geography;
Grytnes, John-Arvid; University of Bergen, Department of Biology Trigas, Panayiotis; University of Athens, Laboratory of Systematic Botany Ah-Peng, Claudine; Université de La Réunion, UMR PVBMT
Attorre, Fabio; Sapienza Università di Roma, Biologia Vegetale Birks, John; University of Bergen and Bjerknes Centre for Climate Research, Bergen, Department of Biology
Borges, Paulo; Universidade dos Açores, Ciências Agrárias
Cardoso, Pedro; Finnish Museum of Natural History, University of Helsinki Chou, Chang-Hung; China Medical University, Research Centre for Biodiversity
De Sanctis, Michele; Sapienza University of Rome, Plant Biology
Menezes de Sequeira, Miguel; Universidade da Madeira, Centro de Ciências da Vida
Duarte, Maria; Tropical Research Institute, Travessa Conde da Ribeira da Silva Elias, Rui; Universidade dos Açores, Ciências Agrárias
Fernández-Palacios, José-Maria; Univ. de La Laguna, Departamento de Ecología
Gabriel, Rosalina; Universidade dos Açores, Ciências Agrárias Gerau, Roy; Missouri Botanical Garden, Missouri Botanical Garden Gillespie, Rosemary; University of California,, Division of Organisms and Environment
Greimler, Josef; University of Vienna, Department of Botany and Biodiversity Research
Harter, David; University of Bayreuth, Department of Biogeography Huang, Tsurng-Juhn; China Medical University, Research Centre for Biodiversity
Irl, Severin; University of Bayreuth, Disturbance Ecology
Jeanmonod, Daniel; Université de Genève, Laboratoire de systématique végétale et biodiversité
Jentsch, Anke; University of Bayreuth, Department of Disturbance Ecology Jump, Alistair; Univ. of Stirling, Biological and Environmental Sciences Kueffer, Christoph; Swiss Federal Institute of Technology Zurich (ETH), Institute of Integrative Biology
For Peer Review
and Environmental StudiesRomeiras, Maria; Tropical Research Institute, Travessa Conde da Ribeira Strasberg, Dominique; Université de La Réunion, UMR PVBMT
Stuessy, Tod; The Ohio State University, Herbarium, Museum of Biological Diversity
Svenning, Jens-Christian; Aarhus University, Department of Bioscience Vetaas, Ole; University of Bergen, Department of Geography
Beierkuhnlein, Carl; University of Bayreuth, Department of Biogeography
Keywords:
altitude, biogeographic processes, diversity, ecological mechanisms, endemism, global relationship, isolation, latitudinal gradient, mixed-effects models , sky islands
2
For Peer Review
Topography-driven isolation, speciation and a global increase of
1
endemism with elevation
2 3
Short title: Topographic isolation and endemism
4 5
Manuel J. Steinbauer1,2, Richard Field3, John-Arvid Grytnes4, Panayiotis Trigas5, Claudine Ah-Peng6,
6
Fabio Attorre7, H. John B. Birks4,8 Paulo A.V. Borges9, Pedro Cardoso9,10, Chang-Hung Chou11,
7
Michele De Sanctis7, Miguel M. de Sequeira12, Maria C. Duarte13,14, Rui B. Elias9, José María
8
Fernández-Palacios15, Rosalina Gabriel9, Roy E. Gereau16, Rosemary G. Gillespie17, Josef Greimler18,
9
David E.V. Harter1, Tsurng-Juhn Huang11, Severin D.H. Irl1 , Daniel Jeanmonod19, Anke Jentsch20,
10
Alistair S. Jump21, Christoph Kueffer22, Sandra Nogué23,4, Rüdiger Otto15, Jonathan Price24, Maria M.
11
Romeiras14,25, Dominique Strasberg6, Tod Stuessy26, Jens-Christian Svenning2, Ole R. Vetaas27, Carl
12
Beierkuhnlein1
13 14
1
Department of Biogeography, BayCEER, University of Bayreuth, D-95440 Bayreuth, Germany 15
2
Section for Ecoinformatics & Biodiversity, Department of Bioscience, Aarhus University, 8000 16
Aarhus, Denmark 17
3
School of Geography, University of Nottingham, University Park, NG7 2RD, UK 18
4
Ecological& Environmental Change Research Group, Department of Biology, University of Bergen, 19
PO Box 7803, N-5020 Bergen, Norway 20
5
Laboratory of Systematic Botany, Department of Crop Science, Agricultural University of Athens, 21
Iera Odos 75, 11855, Athens, Greece 22
6
Université de La Réunion, UMR PVBMT, 15 Avenue René Cassin, CS 92003, 97744, Saint-Denis, 23
Cedex, France 24
7
Department of Environmental Biology, University Sapienza of Rome, I-00185, Rome, Italy 25
8
Environmental Change Research Centre, University College London, London, WC1E 6BT, UK 26
9
Centre for Ecology, Evolution and Environmental Changes (Ce3C) and Azorean Biodiversity Group, 27
Universidade dos Açores, Rua Capitão Joãod´Ávila, sn 9700-042 Angra do Heroísmo, 28
Terceira, Açores, Portugal 29
10
Finnish Museum of Natural History, University of Helsinki, POBox 17, 00014 Helsinki, Finland 30
11
Research Centre for Biodiversity, China Medical Univ., Taichung, Taiwan 40402, Republic of 31
China 32
12
GBM, Universidade da Madeira, Centro de Ciências da Vida, Campus da Penteada, 9000-390, 33
Funchal, Portugal 34
13
Tropical Research Institute, Travessa Conde da Ribeira 9, Lisbon, Portugal 35
14
Centre for Ecology, Evolution and Environmental Changes (Ce3C), Faculty of Sciences, University 36
of Lisbon, Campo Grande, Portugal 37
15
Island Ecology and Biogeography Research Group. Instituto Universitario de Enfermedades 38
Tropicales y Salud Pública de Canarias (IUETSPC), Universidad de La Laguna, Tenerife, 39
Canary Islands 38206, Spain. 40
16
Missouri Botanical Garden, P.O. Box 299, St. Louis, Missouri,63166-0299, USA 41
17
Environmental Science, University of California Berkeley, 130 Mulford Hall, Berkeley, CA 94720-42
3114 43
18
Department of Botany and Biodiversity Research, University of Vienna, Rennweg 14, A-1030, 44
Vienna, Austria 45
19
Laboratoire de systématique végétale et biodiversité, Université de Genève et Conservatoire et 46
Jardin botaniques de la Ville de Genève, case postale 60, 1292 Chambésy, Suisse. 47
20
Department of Disturbance Ecology, BayCEER, University of Bayreuth, DE-95447 Bayreuth, 48
Germany 49
21
Biological and Environmental Sciences, School of Natural Sciences, Univ. of Stirling, Stirling, FK9 50
4LA, UK 51
22
For Peer Review
23
Oxford Long-term Ecology Lab, Biodiversity Institute, Department of Zoology, University of Oxford, 54
OX1 3PS, Oxford, UK 55
24
Department of Geography and Environmental Studies, University of Hawai'i at Hilo 200 W. Kawili 56
St., Hilo, HI 96720-4091 57
25
University of Lisbon, Faculty of Science, Biosystems and Integrative Sciences Institute (BioISI), 58
Campo Grande 1749-016 Lisbon, Portugal 59
26
Herbarium, Museum of Biological Diversity, The Ohio State University, 1315 Kinnear Road, 60
Columbus, Ohio 43212, USA 61
27
Department of Geography, University of Bergen, PB 7802, N-5020 Bergen, Norway 62
63 64
Keywords: altitude, biogeographic processes, diversity, ecological mechanisms, endemism, global
65
relationship, isolation, latitudinal gradient, mixed-effects models, sky islands
66 67
Corresponding author: Manuel Steinbauer, Department of Biogeography, BayCEER, University of
68
Bayreuth, D-95440 Bayreuth, Germany, Phone: +49921552211, [email protected]
69 70
Summary: This Research paper has 5 figures, no table or text box, 239 words in the abstract, 4356
71
words in the main text (excluding abstract, acknowledgements, references, table and figure legends)
72
and contains 59 references.
73 74 2
For Peer Review
Abstract
75
Aim: Higher-elevation areas on islands and continental mountains tend to be separated by longer
76
distances, predicting higher endemism at higher elevations; our study is the first to test the generality
77
of the predicted pattern. We also compare it empirically with contrasting expectations from
78
hypotheses invoking higher speciation with area, temperature and species richness.
79
Location: 32 insular and 18 continental elevational gradients from around the world.
80
Methods: We compiled entire floras with elevation-specific occurrence information, and calculated
81
the proportion of native species that are endemic (‘percent endemism’) in 100 m bands, for each of the
82
50 elevational gradients. Using generalized linear models, we tested the relationships between percent
83
endemism and elevation, isolation, temperature, area and species richness.
84
Results: Percent endemism consistently increased monotonically with elevation, globally. This was
85
independent of richness–elevation relationships, which had varying shapes but decreased with
86
elevation at high elevations. The endemism-elevation relationships were consistent with
isolation-87
related predictions, but inconsistent with hypotheses related to area, richness and temperature.
88
Main conclusions: Higher per-species speciation rates caused by increasing isolation with elevation
89
are the most plausible and parsimonious explanation for the globally consistent pattern of higher
90
endemism at higher elevations that we identify. We suggest that topography-driven isolation increases
91
speciation rates in mountainous areas, across all elevations, and increasingly towards the equator. If
92
so, it represents a mechanism that may contribute to generating latitudinal diversity gradients in a way
93
that is consistent with both present-day and palaeontological evidence.
94 95 96 97 2
For Peer Review
Introduction
98
Globally pervasive and repeated geographic biodiversity patterns such as latitudinal and elevational
99
diversity gradients are strongly affected by the evolution of species (Wallace, 1880; Rohde, 1992;
100
Allen & Gillooly, 2006; Mittelbach et al., 2007). Indeed, these patterns must result from gains and
101
losses of species over time, and speciation is one key type of gain (the other being immigration).
102
Therefore various hypotheses have been advanced to explain spatial variation in speciation rates that
103
operate through distinct mechanisms and are not necessarily mutually exclusive. One prominent
104
explanation, favoured by Rohde (1992), and more recently by Brown (2014) and others as part of the
105
‘metabolic theory of ecology’, proposes that speciation rate increases with temperature (hypothesis 1).
106
This would cause higher rates of speciation in lower latitudes and at lower elevations. Another popular
107
potential mechanism is that more intense biotic interactions promote speciation, including the
108
‘diversity begets diversity’ hypothesis (hypothesis 2; Van Valen, 1973; Rohde, 1992; Gillooly et al., 109
2004; Emerson & Kolm, 2005). As a consequence, species-rich systems with intense species
110
interactions would show higher rates of speciation. Larger areas are also thought to promote speciation
111
(hypothesis 3; Losos & Schluter, 2000), including the increasing chance of allopatric divergence
112
(Kisel & Barraclough, 2010). All these mechanisms predict higher speciation rate per species and
113
increased addition to overall species numbers within a specified area (i.e. speciation rate per area).
114
Elevational gradients provide unique opportunities for testing hypotheses deduced from
115
models and theories advanced to explain diversity gradients (McCain & Sanders, 2010; Hutter et al., 116
2013). The leading theories outlined above, which seek to (partly) explain species richness gradients
117
via equivalent gradients of speciation, are typically associated with latitudinal gradients, but are not
118
specific to them, and the mechanisms they invoke should also apply at the smaller geographic extents
119
of elevational gradients. All of them predict either negative or hump-shaped relationships between
120
elevation and speciation rate because lower elevations are warmer, the area occupied by altitudinal
121
belts tends to be larger at lower elevations and low to mid elevations tend to have more species
122
(Rahbek, 1995; McCain, 2005). According to all these theories, the proportion of native species
123
originating from local speciation should be lowest at high elevations – assuming, as do those theories,
124
that extinction is not systematically lower at high elevation.
125 2
For Peer Review
Another speciation driver is isolation (Coyne & Orr, 2004). Isolation by sea, for example, is
126
thought to be integral to explaining speciation on islands. This factor is reflected in the large number
127
of endemic island species, which disproportionally contribute to the global species pool (Kreft et al., 128
2008). More generally, the promotion of speciation by gene-flow barriers is widely known (Coyne &
129
Orr, 2004). The barriers may include geographic distance or specific features such as sea separating
130
terrestrial systems or land separating marine systems, depending on the organisms concerned. They
131
may also include topographic features such as mountain ranges dividing low-elevation systems or
132
major valleys dividing high-elevation systems. Indeed, Gillespie & Roderick (2014) found that the
133
chance of population isolation increases in more topographically diverse areas because of gene-flow
134
barriers. Allopatric speciation is therefore usually cited to explain specific species richness patterns
135
involving particular barriers, or to explain island biogeographic (e.g. Whittaker & Fernández-Palacios,
136
2007) or regional (e.g. Qian & Ricklefs, 2000) diversity patterns – but not previously considered to
137
vary systematically enough to account for global-scale biodiversity gradients such as elevational or
138
latitudinal ones (Mittelbach et al., 2007). Thus, isolation is not a prominent mechanism invoked in
139
attempts to explain grand clines in biodiversity, and there are few studies examining effects of
140
isolation at a global scale.
141
Geographical isolation tends to increase with elevation whether or not mountains resemble the
142
conical shape of many volcanic islands (Elsen & Tingler, 2015). It has been known since von
143
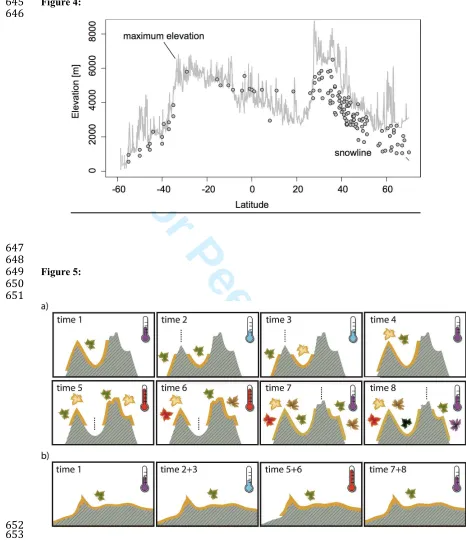
Humboldt & Bonpland (1807) that most species are confined to fairly specific zones within an
144
elevational gradient; the mechanism may be that upward movement is restricted mainly by
145
physiological tolerance and downward movement mainly by competition (Ghalambor et al., 2006).
146
This confinement to particular elevational zones creates isolation, even in the absence of a clear
147
feature acting as a barrier. In particular, for non-lowland species, the geographical extent of
148
inhospitable lower-elevation terrain separating suitable habitat (which may or may not also include
149
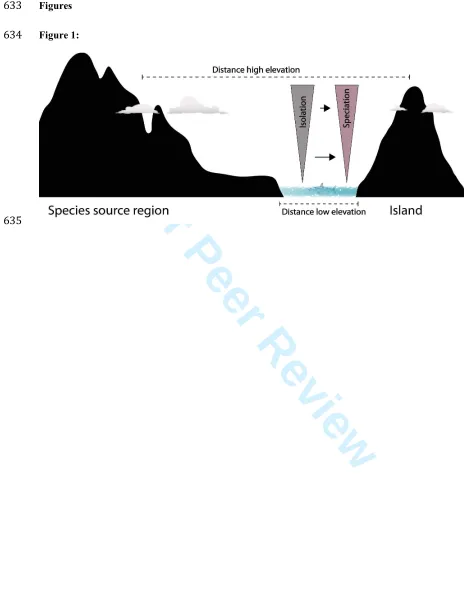
water) increases with elevation (Fig. 1; Steinbauer et al., 2013). Although the distinction is partly a
150
matter of degree, we use the term ‘topographic isolation’ to refer to isolation by a specific feature that
151
acts as a distinct barrier (e.g. sea or a mountain pass) and ‘elevational isolation’ to refer to the isolation
152 2
For Peer Review
caused by elevational difference. We use ‘topography-driven isolation’ to refer to a combination of the
153
two.
154
If isolation is an important driver of speciation (by reducing gene flow), elevation-driven
155
isolation should result in repeated patterns of increasing speciation with elevation (hypothesis 4).
156
There is indeed support from phylogenetic studies for an increase in diversification with elevation
157
(Hutter et al., 2013; Merckx et al., 2015) particularly in high-elevation “island-like habitats” (Hughes
158
& Eastwood 2006). Phylogenetic evidence indicates that many high-elevation endemics across the
159
globe are phylogenetically young taxa resulting from recent fast diversification (e.g. New Zealand
160
Alps, Winkworth et al., 2004; the Andes, Hutter et al., 2013; or on South American Tepuis, Salerno et 161
al., 2012; East Malaysia, Merckx et al., 2015). Although speciation and endemism are not
162
automatically linked, trends in endemism should broadly reflect gradients of speciation. Some studies
163
report consistent increases in per-species levels of endemism with elevation in localized areas (e.g.
164
Kessler, 2002; Vetaas & Grytnes, 2002; Mallet-Rodrigues et al., 2010; Jump et al., 2012; Nogué et al., 165
2013, Irl et al., 2015), but no global synthesis has yet been attempted. Here, for the first time, we test
166
the global generality of this pattern.
167
The reasoning on elevation-driven isolation implies that elevational zones effectively act as
168
islands that become smaller and more remote with increasing elevation. The concept of mountain-tops
169
as islands is not new (e.g. Mayr & Diamond, 1976), but it is less common to conceptualise the island
170
biogeography of elevational zones as a continuous gradient. Thus, higher-elevation zones are more
171
isolated from each other, less connected and have smaller extent than lower-elevation zones.
172
Following the concepts of island biogeography, and given sufficient elevational range, higher
173
elevations should therefore be expected to be (1) decreasingly species rich but (2) contain increasingly
174
high proportions of endemics, assuming sufficient time for speciation (Fig. 1). The first prediction is
175
in line with the leading hypotheses outlined above that invoke the mechanisms of increased speciation
176
with temperature, area and biodiversity. The second prediction of higher per-species endemism at
177
higher elevations, however, contrasts with the higher per-species endemism at low to mid-elevations
178
predicted by those other hypotheses. While the mechanisms underlying these hypotheses are not
179 2
For Peer Review
mutually exclusive, the opposing predictions allow a comparative test of the importance of isolation
180
for speciation in a global context.
181
Here we use 50 elevational gradients from around the world, covering entire plant floras, to
182
evaluate the global relationship between the proportion of native species that are endemic (hereafter
183
‘percent endemism’) and elevation. We focus on elevational gradients on islands, where speciation can
184
be most reliably inferred from endemism. We also test whether the relationship between endemism
185
and elevation applies to continental mountains, where elevational isolation is present but the additional
186
isolation by sea does not apply. Using our island data, we test the predictions from the four hypotheses
187
that percent endemism should be positively related to each of (1) temperature, (2) species richness, (3)
188
area and (4) isolation.
189 190
Methods
191
We assembled complete native floras for 32 high-elevation islands and 18 continental mountain
192
systems, with maximum elevation reaching up to 4200 m for islands and 6000 m for continents, drawn
193
from all major oceans and continents except Antarctica (Table S1, and Appendix 1 – Data Sources).
194
Key selection criteria were (1) a long elevational gradient (preferably more than 1000 m, but
195
occasionally slightly less), (2) enough endemic species (definition below) for the response variable
196
(percent endemism) to contain sufficient variance to model with confidence, (3) good coverage of the
197
flora and (4) reliable presence–absence data along the elevational gradient for all the species. All
198
datasets we accessed that satisfied these criteria were included. However, criteria 1 and (particularly) 2
199
resulted in no datasets poleward of 54° (Tierra del Fuego): at high latitudes there are typically very
200
few species that qualify as ‘endemic’ using our criterion (see below). We focused on vascular plant
201
species (though 28% of the datasets were only for seed plants and the Peru Andes only include woody
202
species) because it is for this taxon that spatially explicit data are most available. Because we aimed to
203
identify general patterns, we performed parallel analyses (which showed strikingly similar results;
204
Figure S1) for arthropod data from six Azorean islands for which high-quality, spatially explicit data
205
were available (Borges et al., 2010).
206 2
For Peer Review
Native species richness and endemic species richness were calculated for 100 m elevational
207
belts. Endemic species were defined as species native only to the archipelago (defined as the focal
208
island in cases where it is closer to a continent than to another island, e.g. Cyprus) or mountain range.
209
The response variable was the percentage of native species that are endemic (percent
210
endemism), the best available proxy for per-species speciation rates (Steinbauer et al., 2013). The use
211
of percentage values also has the major advantage over richness-based indices that the values are
212
independent of environment–richness and area–richness relationships, which tend to override other
213
patterns in biogeography (thus in our datasets there is no consistent relationship between elevation and
214
endemic species richness). Further, this method is relatively robust to sampling biases (Steinbauer et 215
al., 2013).
216
Since percentages based on few species are unreliable, we excluded elevational belts with
217
fewer than 10 native species. We assessed the reliability of the percent endemism values using
218
bootstrapping: we drew species from the pool of all natives (endemic and non-endemic) in each 100 m
219
elevational belt, with replacement, until we reached the total observed species richness. This was done
220
1000 times for each data point, the central 95% (i.e. between the 2.5% and 97.5% quantiles) of the
221
resulting percent endemism values providing the confidence envelope. Most analyses used generalized
222
linear models with binomial errors and a logit link, and parallel ordinary least-squares regressions for
223
comparison. Mixed-effects modelling with binomial errors and logit link was used to assess the global
224
relationship between percent endemism and elevation, with island vs. continental mountain included
225
as a random effect, and was performed using R package lme4version 1.1-7 in R version 3.2.0.
226
Temperature, area and isolation were quantified as follows, for islands only. A global digital
227
elevation model with 30 m resolution (ASTER GDEM, a product of METI and NASA) was used to
228
slice all investigated islands into 100 m elevational bands, resulting in 560 bands in total. Resolution
229
was resampled to 60 m for Tasmania and Taiwan to meet computational limits. Mean annual
230
temperature from 1 km resolution WorldClim data was downscaled using the ASTER GDEM and an
231
elevational lapse rate of 0.6°C/100 m. Area and mean temperature of each elevational band were
232
calculated. Isolation was quantified using an established approach (Weigelt & Kreft, 2013): ‘distance
233
to a climatically similar landmass’. This was approximated as the distance of the elevational band to
234 2
For Peer Review
the nearest terrestrial area outside the archipelago that has a similar (within 1°C) mean annual
235
temperature. To match our definition of endemism (archipelago endemics), all other islands belonging
236
to the same archipelago as the focal elevational belt were removed before quantifying isolation. Our
237
measure of climatic similarity does not include precipitation because precipitation interpolations for
238
islands from global data are highly problematic. The Juan Fernández Islands (Robinson Crusoe and
239
Alejandro Selkirk) were excluded from this analysis because of missing WorldClim data, and Corsica
240
was excluded because the elevational species distribution resolution is too coarse for 100 m bands.
241
Processing of spatial data was done using R packages raster version 2.3-40, maptools version 0.8-36
242
and rgeos version 0.3-8.
243
In order to test the predictions from the four hypotheses 1) area, 2) temperature, 3) isolation
244
and 4) species richness of each elevational band were directly related to percent endemism across all
245
the islands in our dataset. First, we correlated percent endemism with the four predictors separately.
246
Variation accounted for by predictors was quantified using McFadden's pseudo-R2 (1-(log likelihood
247
of the full model/log likelihood of the null model)). We log-transformed area, richness and isolation
248
because this improved residuals and model performance. Secondly, we combined the four predictors
249
in one model and used plots of partial residuals to visualise the modelled effects. Finally, we rebuilt
250
this multiple model using standardized predictor variables and used the model coefficients to indicate
251
relative importance.
252 253
Results
254
The plant floras of the 32 high-elevation insular and 18 continental mountain systems compiled for
255
this study differed considerably in overall species richness (range 75–3186, mean 776 for islands;
256
range 127–8067, mean 1454 for continental mountains) and overall percent endemism (range 3–80%,
257
mean 41% for islands; range 3–72%, mean 33% for continental mountains). The dataset we analysed
258
comprised 51,009 species records with specific elevational occurrence information. The peak of
259
Robinson Crusoe Island (915 m) was the elevational band with the highest percent endemism (96%).
260
We found a globally consistent and highly significant pattern of monotonic increase in percent
261
endemism with increased elevation (Fig. 2). We found this when analysing island systems, continental
262 2
For Peer Review
mountain systems, or both combined (P<0.001 in all cases). The pattern was independent of
263
underlying richness–elevation gradients, which had differing shapes but consistently decreased with
264
elevation at high elevations (Fig. S2). In most cases, percent endemism more than doubled from the
265
lowest to the highest elevations, in some cases increasing more than tenfold. Assessed individually, 28
266
of the 32 island relationships and all 18 of the continental mountain relationships were significantly
267
positive (P<0.001 for all except Pico in Azores, where P<0.05). The other four (Alejandro Selkirk, La
268
Gomera, El Hierro, Tierra del Fuego) had no significant relationship between percent endemism and
269
elevation.
270
Isolation had by far the greatest explanatory power of the four predictor variables in our
271
hypothesis testing. Analysed individually, its pseudo-r² was 0.78 (P<0.001). The relationship was
272
positive (increased percent endemism with isolation), as predicted by the isolation hypothesis. Species
273
richness (pseudo-r²=0.23), area (pseudo-r²=0.15) and temperature (pseudo-r²=0.04) were all
274
negatively correlated with percent endemism, significantly so (P<0.001 for all), opposing the
275
predictions of the related hypotheses (metabolic theory of ecology, speciation–area relationship,
276
diversity begets diversity). Using ordinary least-squares regression, the results were qualitatively
277
identical, but the r² for isolation was slightly lower (0.71). Including all four predictors in one multiple
278
model reinforced the dominance of isolation (Fig. 3), and adding area, temperature and species
279
richness only increased the ordinary least-squares R² to 0.74 (from 0.71), and the pseudo-R² actually
280
decreased to 0.75 (from 0.78). In the multiple model, the effects of species richness and area were
281
weakly positive (Fig. 3), unlike in the single regressions. The biggest residuals represented
282
unexpectedly high percent endemism throughout Socotra, and on the peaks of Jamaica and Fogo
283
(Cape Verde).
284 285
Discussion
286
The monotonic increase in percent endemism with elevation, previously known from a range of case
287
studies, is here documented globally for the first time, over long elevational gradients on continents
288
and islands alike. The increase is remarkably globally consistent for a pattern measured in nature at
289
fine grain and landscape extent, and much more consistent than the equivalent species richness–
290 2
For Peer Review
elevation gradients in the same data (Fig. S2). This consistency indicates that the relationship applies
291
globally and implies that it is predictable. The different geological ages of the islands and continental
292
mountains in our dataset suggest that the pattern may also be repeated through time. Relationships that
293
are predictable in space and time can contribute to a general explanation of pervasive biodiversity
294
patterns (Whittaker et al., 2001). Our results allow us to evaluate probable isolation effects against
295
those of temperature, area and richness within our study system, and we find that these probable
296
isolation effects are dominant. Our findings also allow us to contribute towards a general explanation
297
for the anomalously high biodiversity of tropical and sub-tropical mountains, and in turn towards
298
understanding latitudinal biodiversity gradients. We now expand on these points.
299
Endemism, speciation rates and evaluation of the hypotheses 300
For the long elevational gradients in our data, the patterns of percent endemism are consistent with the
301
predictions of the isolation hypothesis, but not with those of the metabolic theory of biology, nor the
302
area and diversity-begets-diversity hypotheses. Those predictions were made on the basis that percent
303
endemism is a reasonable proxy for per-species speciation rate. But to what extent does the increase in
304
percent endemism reflect increasing speciation rate with elevation? Speciation rate, as conceptualized
305
in this manuscript, is the average time one species takes to diverge into two reproductively isolated
306
species (e.g. Knope et al., 2012; see also Yule, 1924). The use of percent endemism to measure
307
speciation rate involves the assumption that the large majority of endemic species on islands (or
308
mountains) derives from in situ speciation. This assumption has considerable support, at least for
309
oceanic islands (Stuessy et al., 2006), and we consider it reasonable to assume that most of the
310
endemic species in our island data evolved within the archipelago (another key reason for using
311
archipelago-level endemism). The fact that the same relationship between elevation and endemism is
312
also found for continental mountains (Fig. 2) suggests that in situ speciation may also account for most
313
of the endemics in our continental mountain data. This is consistent with phylogenetic studies showing
314
increased diversification rate with elevation in continental mountains (Hutter et al., 2013; Merckx et 315
al., 2015).
316
Percent endemism is likely to be affected also by extinction, and possibly by other circumstances (e.g.
317
palaeoendemism, dispersal limitation of endemics and altitudinal differences in immigration rate;
318 2
For Peer Review
Steinbauer et al., 2012). The presence of elevational gradients reduces extinction risk caused by
319
climatic changes as species can track their climatic niche by shifting over short spatial distances along
320
strong climatic gradients (Sandel et al., 2011; Fjeldså et al., 2012). On high-elevation islands,
321
extinction risk may be slightly higher towards the summit and at the coast were some species might
322
meet their temperature range limits (McCain 2005). However, oceanic influences tend to cause more
323
stable climates particularly in low elevations, likely mitigating climate induced extinctions there
324
(Cronk, 1997). We thus expect extinction rates to mainly increase with elevation because of smaller
325
areas and more variable climate; this would lead to decreasing percent endemism with elevation if
326
temporal species turnover is faster than clado- and anagenetic evolutionary processes, but we found an
327
increase. Higher extinction rates may enhance speciation opportunities for the remaining species.
328
Also, historical land-use changes in lowlands may affect percent endemism there. However, our
329
analyses are based only on native species (not aliens), and we consider it very unlikely that land use
330
and other human influences affect endemic species so differently from native non-endemic species
331
(e.g. via the loss of defensive mechanisms), and in such a globally consistent manner, that they cause
332
the strong and consistent pattern we find.
333
Assuming, then, that percent endemism reflects per-species speciation rate reasonably well,
334
the strong increase in percent endemism with elevation is contrary to predictions derived from the
335
metabolic theory and the biotic interactions (‘diversity begets diversity’) and area hypotheses. This is
336
consistent with findings by McCain & Sanders (2010) that the metabolic theory does not explain
337
diversity patterns along elevational gradients. With their elevational ranges varying from about 800–
338
6000 m, our 50 datasets all represent strong temperature gradients (approximately 5–40 °C
339
temperature ranges), and both species richness and area of elevational bands tend to vary within each
340
dataset by orders of magnitude (Figs 3 and S2). If those are the main drivers of speciation in our study
341
areas then they should account for more variation in percent endemism than does isolation, but they do
342
not. This widespread increase in percent endemism with elevation and the strong effect attributed to
343
isolation are, however, consistent with an increase in speciation driven by elevational isolation. It is
344
also consistent with the notion of an island biogeography of elevational zones. Thus there is a strong
345 2
For Peer Review
indication that elevation-induced isolation overrides possible effects of temperature, biotic interactions
346
and area on speciation along the elevational gradients investigated here.
347
Reduction with elevation in species’ ability to disperse between elevation zones could help
348
account for the pattern in Fig. 2, and would represent an influence of topography-driven isolation
349
additional to speciation. While the mechanism of topography-driven isolation is invariant with time,
350
sufficient time is required for speciation to result from isolation. One reason why few high-latitude
351
mountains contain endemic species is because most have suffered recent massive extinction by
352
glaciation. Note that this lack of endemic species (and also low native plant species richness at high
353
elevations in high latitudes) excludes high latitudes from our analyses, while being consistent with,
354
and expected from, our reasoning.
355
Topography-driven isolation may drive diversification increasingly towards the tropics 356
While, on the basis of our findings, we cannot reject other theories for latitudinal gradients, our
357
findings and reasoning are in line with empirical studies that found stronger coarse-resolution
358
correlations in lower latitudes between species richness and topography than with other potential
359
drivers (e.g. Kreft & Jetz, 2007). It has also been suggested that speciation associated with tropical
360
mountains may have fuelled today’s tropical diversity (Hughes & Eastwood, 2006; Thomas et al., 361
2008; Fjeldså et al., 2012); phylogenetic research provides qualified support (Särkinen et al., 2012),
362
and there are examples of the ancestors of tropical lowland lineages being montane (e.g. Elias et al., 363
2009). Our findings are consistent with this notion, and imply that topography-driven isolation is an
364
important mechanism increasing speciation rate towards the equator.
365
Systematic global variation in the isolating influence of elevation was proposed by Janzen
366
(1967; see also Osborne, 2012), who argued that smaller climatic niches of tropical taxa (which do not
367
have to tolerate much seasonal variation in temperature) mean much stronger dispersal limitation
368
caused by topography in warmer, less seasonal climates than in higher latitudes. Despite the title of
369
Janzen’s paper, this reasoning applies to crossing lower elevations (e.g. valleys) as well as higher ones
370
(e.g. mountain passes), though the magnitude of the effect may not scale linearly (Ghalambor et al.,
371
2006). In addition to the direct effect of smaller niches, the reduced seasonality at lower latitudes may
372
also select for lower dispersal ability (Jocque et al., 2010).
373 2
For Peer Review
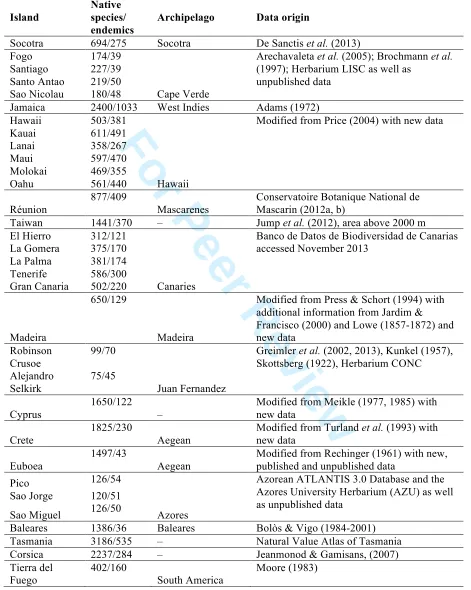
In addition to Janzen’s suggested increase in effective elevation at low latitudes, the ‘glacial
374
buzzsaw’ tends to decrease absolute elevations at high latitudes (Egholm et al., 2009; Fig. 4). This is
375
because, during periods of repeated glaciations of poleward regions (as currently, in the Quaternary),
376
higher-latitude mountains are particularly eroded by glaciers and ice sheets. We suggest that these
377
latitudinal trends in both absolute and effective elevational ranges combine to cause much higher
378
probabilities of isolation, and thus promote higher speciation rates per unit area, in mountainous areas
379
at lower latitudes. The slope of the relationship between percent endemism and elevation may or may
380
not change with latitude, but the chance of isolation by topography at any elevation is much greater at
381
lower latitudes. From this, we suggest that the latitudinal diversity gradient may result in part from
382
mountains being much higher in bioclimatic and ecological terms at lower latitudes, working as
383
speciation pumps that can enhance species richness also in surrounding lowlands (Gillespie &
384
Roderick, 2014).
385
Temporal dynamics in topography-driven isolation 386
Changing environmental conditions, such as during Milankovitch glacial–interglacial cycles, and the
387
associated range shifts of species, may repeatedly divide and merge populations at varying elevations,
388
again working as speciation pumps (Fig. 5; Qian & Ricklefs, 2000; Cadena et al., 2012; Gillespie &
389
Roderick, 2014) similar to those reported for oceanic island archipelagos (Ricklefs & Bermingham,
390
2007). This process will increase allopatric speciation by repeated isolation as well as hybridization
391
and polyploidy in the phases of remixing of related taxa. While Milankovitch glacial–interglacial
392
cycles may thus hinder speciation in areas with low topographical complexity (Dynesius & Jansson
393
2000), they may boost diversification in mountain ranges, where isolation is likely and the extinction
394
risk low because of low climate-change velocity (Sandel et al., 2011; Fjeldså et al., 2012).
395
Topography-enhanced speciation by repeated isolation has previously been proposed as a mechanism
396
to increase tropical biodiversity (Nores, 1999; Haffer & Prance, 2001; Elias et al., 2009), but in rather
397
specific ways, such that its relevance for the latitudinal diversity gradient may have been underplayed.
398
On much longer timescales, strong latitudinal diversity gradients comparable to what we
399
observe today may be restricted to periods of the Phanerozoic characterized by ‘icehouse’ climatic
400
regimes (Mannion et al., 2014). Among other reasons, the absence of the ‘glacial buzzsaw’ during
401 2
For Peer Review
much of Earth’s history would reduce the latitudinal gradient in topography-driven isolation,
402
especially when combined with shallower latitudinal gradients of temperature and seasonality. Thus,
403
times with weakened latitudinal diversity gradients during Earth history may also have been times in
404
which latitudinal trends in topography-driven isolation were much weaker.
405
Nature conservation implications 406
The globally consistent increase in percent endemism with elevation has important
nature-407
conservation implications. High-elevation ecosystems consistently harbour disproportionally high
408
ratios of unique species in relatively small areas, and many are ideal for nature conservation because
409
they are not well suited to other land uses (not least on islands, where tourism tends to be based in the
410
lowlands; Sandel & Svenning, 2013). However, high-elevation endemic species may be adversely
411
affected by climate change, particularly those whose climatic envelopes are set to disappear (Elsen &
412
Tingler, 2015, Harter et al., 2015). Even so, if elevation drives speciation, future speciation may be
413
maximised by conserving mountainous areas, especially at lower latitudes.
414
Conclusion 415
We suggest that an increase in speciation caused by the isolating effect of topography may
416
significantly contribute to an explanation of latitudinal gradients of beta and gamma diversity, and to
417
variations in those gradients with geological time. This importance of isolation for speciation is
418
consistent with the increase in percent endemism with elevation that we find on high islands and
419
continental mountains around the world.
420 421
Acknowledgements
422
We thank Thomas Gillespie, David Currie and two anonymous referees for their constructive criticism
423
of an earlier version of this paper. Brody Sandel was very supportive when handling the spatial data.
424
M.J.S. was supported by the Danish Carlsbergfondet Project Number CF14-0148. H.J.B.B. compiled
425
several of the datasets with support from the University of Bergen’s Meltzer Fund. M.C.D. and
426
M.M.R. were funded by FCT project : PTDC/BIA-BIC/4113/2012; P.B., P.C., R.E. and R.G. were
427
funded by projects DRCT- M2.1.2/I/027/2011 and DRCT- M2.1.2/I/005/2011.
428 2
For Peer Review
References
429
Allen, A.P. & Gillooly, J.F. (2006) Assessing latitudinal gradients in speciation rates and biodiversity
430
at the global scale. Ecology Letters, 9, 947–954.
431
Borges, P.A.V., Gabriel, R., Arroz, A., Costa, A., Cunha, R., Silva, L., Mendonça, E., Martins, A.F.,
432
Reis, F. & Cardoso, P. (2010) The Azorean Biodiversity Portal: an internet database for regional
433
biodiversity outreach. Systematics and Biodiversity, 8, 423-434.
434
Brown, J.H. (2014) Why are there so many species in the tropics? Journal of Biogeography,41, 8–22.
435
Cadena, C.D., Kozak, K.H., Gomez, J.P., Parra, J.L., McCain, C.M., Bowie, R.C.K., Carnaval, A.C.,
436
Moritz, C., Rahbek, C., Roberts, T.E., Sanders, N.J., Schneider, C.J., VanDerWal, J., Zamudio,
437
K.R. & Graham, C.H. (2012) Latitude, elevational climatic zonation and speciation in New World
438
vertebrates. Proceedings of the Royal Society B, 279, 194–201.
439
Coyne, J.A. & Orr, H.A. (2004) Speciation. Sinauer Associates, Sunderland, MA. 545 pp.
440
Cronk, Q.C.B. (1997). Islands: stability, diversity, conservation. Biodiversity and Conservation, 6,
441
477-493
442
Egholm, N.S.B., Pedersen, V.K. & Lesemann, J.E. (2009) Glacial effects limiting mountain height.
443
Nature, 460, 884–887.
444
Elias, M., Joron, M., Willmott, K., Silva-Brandao, K.L., Kaiser, V., Arias, C.F., Gomez Piñerez, L.M.,
445
Uribe, S., Brower, A.V., Freitas, A.V. & Jiggins, C.D. (2009). Out of the Andes: patterns of
446
diversification in clearwing butterflies. Molecular Ecology, 18, 1716–1729.
447
Elsen, P.M. & Tingler, R.W. (2015) Global mountain topography and the fate of montane species
448
under climate change. Nature Climate Change, 5, 772–776.
449
Emerson, B.C. & Kolm, N. (2005) Species diversity can drive speciation. Nature,434, 1015–1017.
450
Fjeldså, J., Bowie, R.C.K. & Rahbek, C. (2012) The role of mountain ranges in the diversification of
451
birds. Annual Review of Ecology and Systematics, 43, 249–265.
452
Ghalambor, C.K., Huey, R.B., Martin, P.R., Tewksbury, J.T. & Wang, G. (2006) Are mountain passes
453
higher in the tropics? Janzen’s hypothesis revisited. Integrative and Comparative Biology, 46, 5–
454
17.
455
Gillespie, R.G. & Roderick, G.K. (2014) Geology and climate drive diversification. Nature,509, 297–
456
298.
457
Gillooly, J.F., Allen, A.P., Savage, V.-M. & West, G.B. (2004) Towards a metabolic theory of
458
ecology. Ecology,85, 1771-1789.
459
Haffer, J. & Prance, G.T. (2001) Climatic forcing of evolution in Amazonia during the Cenozoic: on
460 2
For Peer Review
the refuge theory of biotic differentiation. Amazoniana,16, 579–605.
461
Harter, D.E.V., Irl, S.D.H., Seo, B., Steinbauer, M.J., Gillespie, R., Triantis, K.A:.,
Fernández-462
Palacios, J.M. & Beierkuhnlein, C. (2015) Impact of global climate change on the floras of oceanic
463
islands – Projections, implications and current knowledge. Perspectives in Plant Ecology, 464
Evolution and Systematics, 17, 160–183.
465
Hermes, H. (1955). Die Lage der oberen Waldgrenze in den Gebirgen der Erde und ihr Abstand zur
466
Schneegrenze. Kölner Geographische Abhandlungen, 277pp.
467
Hughes, C. & Eastwood, R. (2006) Island radiation on a continental scale: Exceptional rates of plant
468
diversification after uplift of the Andes. Proceedings of the Royal Society B, 103, 10334–10339.
469
Humboldt, A. & Bonpland, A. (1807) Le voyage aux régions equinoxiales du Nouveau Continent, fait
470
en 1799–1804, Paris.
471
Hutter, C.R., Guayasamin, J.M. & Wiens, J.J. (2013) Explaining Andean megadiversity: the
472
evolutionary and ecological causes of glassfrog elevational richness patterns. Ecology Letters, 16,
473
1135-1144.
474
Irl, S.D.H., Harter, D.E.V., Steinbauer, M.J., Gallego Puyol, D., Fernández-Palacios, J.M., Jentsch, A.,
475
Beierkuhnlein, C. (2015) Climate vs. topography – spatial patterns of plant species diversity and
476
endemism on a high-elevation island. Journal of Ecology, doi: 10.1111/1365-2745.12463
477
Janzen, D.H. (1967) Why mountain passes are higher in the tropics. The American Naturalist, 101,
478
233–249.
479
Jocque, M., Field, R., Brendonck, L. & de Meester, L. (2010) Climatic control of dispersal–ecological
480
specialization trade-offs: a metacommunity process at the heart of the latitudinal diversity gradient?
481
Global Ecology and Biogeography, 19, 244–252.
482
Jump, A.S., Huang, T.-J. & Chou, C.-H. (2012) Rapid altitudinal migration of mountain plants in
483
Taiwan and its implications for high altitude biodiversity. Ecography,35, 204-210.
484
Kessler, M. (2002) The elevational gradient of Andean plant endemism: varying influences of
taxon-485
specific traits and topography at different taxonomic levels. Journal of Biogeography,29, 1159–
486
1165.
487
Kisel, Y. & Barraclough, T.G. (2010) Speciation has a spatial scale that depends on levels of gene
488
flow. The American Naturalist, 175, 316–334.
489
Knope, M.L., Morden, C.W., Funk, V.A. & Fukami, T. (2012) Area and the rapid radiation of
490
Hawaiian Bidens (Asteraceae). Journal of Biogeography, 39, 1206-1216.
491
Kreft, H. & Jetz, W. (2007)Global patterns and determinants of vascular plant diversity. Proceedings 492
of the National Academy of Sciences, 104, 5925–5930.
493 2
For Peer Review
Kreft, H., Jetz, W., Mutke, J., Kier, G. & Barthlott, W. (2008) Global diversity of island floras from a
494
macroecological perspective. Ecology Letters,11, 116-127.
495
Losos, J.B. & Schluter, D. (2000) Analysis of an evolutionary species–area relationship. Nature,408,
496
847–850.
497
Mallet-Rodrigues, F., Parrini, R., Pimentel, L.M.S. & Bessa, R. (2010) Altitudinal distribution of birds
498
in a mountainous region in southeastern Brazil. Zoologia,27, 503–522.
499
Mannion, P.D., Upchurch, P., Benson, R.B. & Goswami, A. (2014) The latitudinal biodiversity
500
gradient through deep time. Trends in Ecology and Evolution,29, 42–50.
501
Mayr, E., & Diamond, J.M. (1976). Birds on islands in the sky: origin of the montane avifauna of
502
northern Melanesia. Proceedings of the National Academy of Sciences,73, 1765-1769.
503
McCain, C.M. (2005) Elevational gradients in diversity of small mammals. Ecology,86, 366–372.
504
McCain, C.M. & Sanders, N.J. (2010) Metabolic theory and elevational diversity of vertebrate
505
ectotherms. Ecology, 91, 601-609.
506
Merckx, V.S.F.T., Hendriks, K.P., Beentjes, K.K., Mennes, C.B., Becking, L.E., Peijnenburg,
507
K.T.C.A., Afendy, A., Arumugam, N., de Boer, H., Biun, A., Buang, M.M., Chen, P-P., Chung,
508
A.Y.C., Dow, R., Feijen, F.A.A., Feijen, H., Soest, C.F., Geml, J., Geurts, R., Gravendeel, B.,
509
Hovenkamp, P., Imbun, P., Ipor, I., Janssens, S.B., Jocque, M., Kappes, H., Khoo, E., Koomen, P.,
510
Lens, F., Majapun, R.J., Morgado, L.N., Neupane, S., Nieser, N., Pereira, J.T., Rahman, H.,
511
Sabran, S., Sawang, A., Schwallier, R.M., Shim, P.-S., Smit, H., Sol, N., Spait, M., Stech, M.,
512
Stokvis, F., Sugau, J.B., Suleiman, M., Sumail, S., Thomas, D.C., van Tol, J., Tuh, F.Y.Y., Yahya,
513
B.E., Nais, J., Repin, R., Lakim, M. & Schilthuizen, M. (2015) Evolution of endemism on a young
514
tropical mountain. Nature, 524, 347-350.
515
Mittelbach, G.G., Schemske, D.W., Cornell, H.V., Allen, A.P., Brown, J.M., Bush, M.B., Harrison,
516
S.P., Hurlbert, A.H., Knowlton, N., Lessios, H.A., McCain, C.M., McCune, A.R., McDade, L.A.,
517
McPeek, M.A., Near, T.J., Price, T.D., Ricklefs, R.E., Roy, K., Sax, D.F., Schluter, D., Sobel, J.M.
518
& Turelli, M. (2007) Evolution and the latitudinal diversity gradient: speciation, extinction and
519
biogeography. Ecology Letters,10, 315–331.
520
Nogué, S., Rull, V. & Vegas-Vilarrúbia, T. (2013) Elevational gradients in the neotropical table
521
mountains: patterns of endemism and implications for conservation. Diversity and Distribution,19,
522
676-687.
523
Nores, M. (1999) An alternative hypothesis for the origin of Amazonian bird diversity. Journal of 524
Biogeography, 26, 475–485.
525
Osborne, P.L. (2012) Tropical Ecosystems and Ecological Concepts. 2nd edition, Cambridge
526
University Press, Cambridge.
527 2
For Peer Review
Qian, H. & Ricklefs, R.E. (2000) Large-scale processes and the Asian bias in species diversity of
528
temperate plants. Nature, 407, 180–182.
529
Rahbek, C. (1995) The elevational gradient of species richness: a uniform pattern? Ecography, 18,
530
200–205.
531
Rohde, K. (1992) Latitudinal gradients in species diversity: the search for the primary cause. Oikos, 532
65, 514–527.
533
Ricklefs, R.E. & Bermingham, E. (2007) The causes of evolutionary radiations in archipelagos:
534
Passerine birds in the Lesser Antilles. The American Naturalist, 169, 285–297.
535
Salerno, P.E., Ron, S.R., Señaris, C., Rojas-Runjaic, F.J.M., Noonan, B.P. & Cannatella D.C. (2012)
536
Ancient Tepui summits harbour young rather than old lineages of endemic frogs. Evolution,66,
537
3000–3013.
538
Sandel, B., Arge, L., Dalsgaard, B., Davies, R.G., Gaston, K.J., Sutherland, W.J. & Svenning, J.-C.
539
(2011). The Influence of Late Quaternary Climate-Change Velocity on Species Endemism.
540
Science, 334, 660-664.
541
Sandel, B. & Svenning, J.-C. (2013). Human impacts drive a global topographic signature in tree
542
cover. Nature Communications, 4, 2474.
543
Särkinen, T., Pennington, R.T., Lavin, M., Simon, M.F. & Hughes, C.E. (2012) Evolutionary islands
544
in the Andes: persistence and isolation explain high endemism in Andean dry tropical forests.
545
Journal of Biogeography, 39, 884–900.
546
Steinbauer, M.J., Otto, R., Naranjo-Cigala, A., Beierkuhnlein, C. & Fernandez-Palacios, J.M. (2012)
547
Increase of island endemism with altitude – speciation processes on oceanic islands. Ecography, 548
35, 23–32.
549
Steinbauer, M.J., Irl, S.D.H. & Beierkuhnlein, C. (2013) Elevation-driven ecological isolation
550
promotes diversification on Mediterranean islands, Acta Oecologica, 47, 52-56.
551
Stuessy, T.F., Jakubowsky, G., Gómez, R.S., Pfosser, M., Schlüter, P.M., Fer, T., Sun, B.Y. & Kato,
552
H. (2006) Anagenetic evolution in island plants. Journal of Biogeography,33, 1259-1265.
553
Thomas, G.H., Orme, C.D.L., Davies, R.G., Olson, V.A., Bennett, P.M., Gaston, K.J., Owens, I.P.F. &
554
Blackburn, T.M. (2008) Regional variation in the historical components of global avian species
555
richness. Global Ecology and Biogeography, 17, 340–351.
556
Van Valen, L. (1973) A new evolutionary law. Evolutionary Theory, 1, 1–30.
557
Vetaas, O.R. & Grytnes, J.A. (2002) Distribution of vascular plant species richness and endemic
558
richness along the Himalayan elevation gradient in Nepal. Global Ecology and Biogeography, 11,
559
291–301.
560 2
For Peer Review
Wallace, A.R. (1880) Island Life: Or, The Phenomena and Causes of Insular Faunas and Floras.
561
Macmillan & Co., London.
562
Weigelt, P. & Kreft, H. (2013) Quantifying island isolation – insights from global patterns of insular
563
plant species richness. Ecography, 36, 417–429.
564
Whittaker, R.J. & Fernández-Palacios, J.M. (2007) Island Biogeography: Ecology, Evolution, and 565
Conservation. Second Edition. Oxford University Press, Oxford.
566
Whittaker, R.J., Willis, K.J. & Field, R. (2001) Scale and species richness: towards a general,
567
hierarchical theory of species diversity. Journal of Biogeography, 28, 453–470.
568
Winkworth, R.C., Wagstaff, S.J., Glenny, D. & Lockhart, P.J. (2004) Evolution of the New Zealand
569
mountain flora: Origins, diversification and dispersal. Organisms Diversity & Evolution. 5, 237–
570
247.
571
Yule, G.U. (1924) A mathematical theory of evolution, based on the conclusions of Dr J. C. Willis.
572
Philosophical Transactions of the Royal Society B, 213, 21-87.
573 574
Biosketches & author contributions
575
Manuel Steinbauer`s research interest is the quantification and understanding of causal drivers behind
576
the dynamics and geography of biota. Manuel Steinbauer is thus investigating biogeographic
577
patterns with particular focus on scale-dependent patterns/processes, theoretical ecology, dispersal
578
and isolated systems like island or mountains.
579
Richard Field’s main interests are in biodiversity patterns, conservation biogeography (particularly
580
with reference to tropical rainforests) and island biogeography.
581
Author contributions: M.J.S. had the original idea and designed the study with R.F. M.J.S. and R.F.
582
led the writing. M.J.S. J.A.G., P.T., C.A.P., F.A., H.J.B.B. P.A.V.B, P.C., C.H.C., M.D.S., M.C.D.,
583
R.B.E., R.G., J.G., T.J.H., D.J., A.S.J., J.P., M.M.R., D.S., T.S. and O.R.V. provided data. M.J.S.
584
performed the analyses and designed the figure. All authors discussed the approach, implementation
585
and results and contributed to the manuscript. C.B. supervised the project.
586 587 2
For Peer Review
Figure legends
588
Figure 1: On islands or mountains, high elevation ecosystems are more isolated than low-elevation
589
ecosystems. This is because potential source regions for colonizing species (or individuals) are further
590
away (geographic isolation) and smaller (target area effect) than low-elevation ecosystems. Greater
591
isolation should be reflected in a higher speciation rate.
592 593
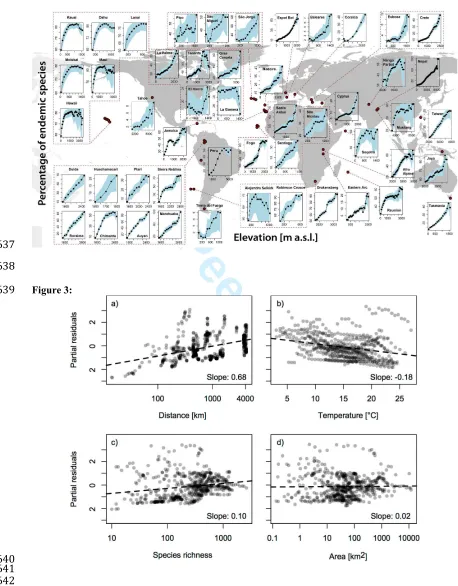
Figure 2: Elevation–percent endemism relationships globally. Vertical axes show the percentage of
594
native species that are endemic (note the varying scales); horizontal axes show elevation in 100 m
595
bands. Blue shading indicates 95% envelopes from bootstrap resampling (see Methods summary).
596
Graphs surrounded by dashed boxes belong to the same archipelago or region. Assessed individually
597
using generalized linear models (binomial), 28 of the 32 island and all of the 18 continental mountain
598
relationships are significantly positive (P < 0.001 for all except Pico, where P < 0.05). The other four
599
(Alejandro Selkirk, La Gomera, El Hierro, Tierra del Fuego) were non-significant.
600 601
Figure 3: Partial residuals of the multiple generalized linear model accounting for percent endemism
602
in elevational bands using area, temperature, species richness and isolation, plotted against each
603
variable. Each panel shows the relationship between the variable and the residuals from a model
604
excluding this variable, and including the other three. Panels are ordered in descending order of
605
explanatory power of the predictor in the model. Points are semi-transparent to visualise the density of
606
points on the graphs, so apparently darker points represent several points in the same place. ‘Slope’
607
indicates the slope coefficients from a generalised linear model (logit-link) with standardised variables
608
(to support comparability).
609 610
Figure 4: The elevational range where plants grow is limited by mountain elevation and the
611
permanent snowline. Both increase from high latitudes towards the subtropics and tropics. This and
612
the possibility of species having smaller ecological niches towards the tropics increases the chance of
613
topography-driven isolation and thus speciation towards the tropics (Figure 5). The grey line displays
614 2
For Peer Review
the highest elevation value per latitudinal band, derived from a 1km² resolution digital elevation
615
model. The points show the permanent snowline, based on data extracted from Hermes (1955).
616 617
Figure 5: (a) The isolating effect of mountain topography may act as a speciation pump in the
618
presence of climatic fluctuations while (b) landscapes with less variable topography may lack this
619
mode of speciation. The figure is a simplified conceptualisation, the coloured thermometers
620
illustrating climatic changes: red representing warm periods, pale blue for cold periods and dark blue
621
for intermediate temperatures. Thick lines on top of the landscape cross-sections show the
622
distributional range of the clade at each time-point. Changes in leaves (colour and form) indicate
623
divergence (incipient/actual speciation). Speciation may be the result of isolated evolution of lineages
624
(isolation barriers indicated by dashed lines), but also of hybridization and polyploidy when
625
differentiated taxa merge after isolation (not shown but also enhanced by topography). Note that
626
isolation in mountain ranges may occur in valleys or mountain peaks. For simplicity, the illustration
627
assumes (i) that each isolation event is long enough to cause speciation, and (ii) that there is no niche
628
shift or adaptive radiation.
629 630 631 632 2
For Peer Review
Figures
633
Figure 1:
634
635 2
[image:25.612.54.518.73.662.2]For Peer Review
Figure 2:
636
637 638
Figure 3:
639
640 641 642 643 644 2
[image:26.612.61.519.83.669.2]For Peer Review
Figure 4:
645 646
647 648
Figure 5:
649 650 651
652 653 654 2
[image:27.612.52.518.71.613.2]