METHOD DEVELOPMENT AND VALIDATION OF METFORMIN BY
USING REVERSE- PHASE HIGH PERFORMANCE LIQUID
CHROMATOGRAPHY
Krishna Mohan Chinnala, B. Parijatha, D. Santhoshi Priya and Alapati Sahithi*
School of Pharmacy, Nalla Narasimha Reddy Education Society’s Group of Institutions, Hyderabad, Telangana, INDIA.
ABSTRACT
The method development and validation of Metformin based on Ultra-Violet spectrophotometry. This compound belongs to the class of organic compounds known as biguanides. These are organic compound containing two N-linked guanidines. Metformin is an oral anti diabetic drug in preventing complications of type 2 diabetes and it is a good first line therapy for a over obese with type 2 diabetes, it is currently available in more than 60countries worldwide. As a result of the importance of this oral hypoglycaemic agent in the treatment of non insulin dependent diabetes mellitus. The reported methods include the chromatographic methods such as HPLC. HPLC has been reported for the determination of Metformin chromatographic methods, these are complex, tedious, time consuming and are not suitable for routine analysis. However, Ultraviolet spectrophotometric methods which are simple and fast for ideal and routine analysis. We observed the maximum absorbance at 235&274nm for Metformin solution ELICO SL-159 make Ultra-Violet visible spectrophotometry spectrum model UV-2450, has been recorded when scanned in the ultraviolet region, using mobile aceto nitrile: phosphate buffer (30:70) with a flow rate of 1.0ml/minute and wave length at 225 nm. Thus, it was selected as the analytical wavelength. The development method was found to be simple, sensitive, accurate, precise and specific as evidenced by non-interference from the excipients presented in the marketed injection.
KEYWORDS: Metformin, reverse phase HPLC, ultraviolet spectroscopy, sensitive,
accurate.
Volume 6, Issue 8, 1725-1735. Research Article ISSN 2277– 7105
*Corresponding Author
Prof. Alapati Sahithi
School of Pharmacy, Nalla
Narasimha Reddy Education
Society’s Group of
Institutions, Hyderabad,
Telangana, INDIA. Article Received on 12 June 2017,
Revised on 02 July 2017, Accepted on 22 July 2017
INTRODUCTION
Metformin
The discovery of metformin was began with synthesis of galegine like compounds derived from Gallega officinalis, it is a plant traditionally employed in Europe as a drug for diabetes treatment for many years. In 1950, Stern et al. discovered the clinical usefulness of metformin while working in Paris.[1] They observed that the dose-response of metformin was related to its glucose lowering capacity.
Metformin as a non-insuline oral hypoglycaemic which acts primarily in the liver by reducing glucose output and also by avoiding glucose uptake in the peripheral tissues. These effects are mediated by the activation of an upstream kinase, liver kinase B1 (LKB-1), which in turn regulates the downstream kinase adenosine monophosphatase protein kinase (AMPK). AMPK phosphorylates a transcriptional co-activator, transducer of regulated CREB protein 2 (TORC2), resulting in its inactivation which consequently downregulates transcriptional events that promote synthesis of gluconeogenic enzymes and by the inhibition of mitochondrial respiration has also been proposed to contribute to the reduction of gluconeogenesis, as it reduces the energy supply to the cells for this process.[2] HPLC has been reported for the determination of Metformin chromatographic methods, these are complex, tedious, time consuming and are not suitable for routine analysis.
This compound belongs to the class of organic compounds known as biguanides.[3] These are organic compound containing two N-linked guanidines.
Figure1. Structure of Metformin
IUPAC Name: 1-carbamimidamido-N, N-dimethylmethanimidamide Chemical formula: C4H11N5
Categories: Anti diabetic Agent Weight: 129.1636
Description: White Crystalline Powder
MATERIALS AND METHODS
Table 1: List of Instruments:
S. No. Instruments
1. HITACHI L2130 with D Elite 2000 Software with Isocratic with UV-Visible Detector (L-2400),
2 ELICO SL-159 UV – Vis spectrophotometer 3 Electronic Balance (SHIMADZU ATY224) 4 Ultra Sonicator (Wensar wuc-2L)
5 Thermal Oven
6 Waters ODS (C18) RP Column, 250 mm x 4.6 mm.
7 PH Analyzer (ELICO)
8 Triple Quartz Distillation Unit (BOROSIL)
Table 2: List of Chemicals, Reagents and Standards Used:
S.No Name Specifications Manufacturer/Supplier
Purity Grade
1. Doubled distilled water ---- ---- SD fine-Chem Ltd; Mumbai
2. Methanol 99.9% A.R. Loba Chem; Mumbai.
3. Acetonitrile 99.9% HPLC Loba Chem; Mumbai.
4. Potassium dihydrogen
orthophosphate 99.9 L.R. SD fine-Chem Ltd; Mumbai
5. glacial acetic acid 99.9 L.R. SD fine-Chem Ltd; Mumbai
6. Triethylamine 99.9% L.R SD fine-Chem Ltd; Mumbai (L.R-Laboratory Reagent, A.R- Analytical Reagent, HPLC- High Performance Liquid Chromatography).
Table 3: Solubility Study
REAGENTS SOLUBILITY
Methanol Sparingly soluble Ethanol Slightly soluble Acetonitrile Soluble
1 M HCl Insoluble 1M NaOH Insoluble Water Insoluble
METHOD DEVELOPMENT
HPLC Instrumentation & Conditions
Standard & sample preparation for UV-spectrophotometer analysis[4]: 25 mg of Metformin standard was transferred into 25 ml volumetric flask, dissolved & make up to volume with mobile phase. Further dilution was done by transferring 0.5 ml of the above solution into a 10ml volumetric flask and make up to volume with mobile phase.
The standard & sample stock solutions[5] were prepared separately by dissolving standard & sample in a solvent in mobile phase diluting with the same solvent (After optimization of all conditions) for UV analysis. It scanned in the UV spectrum in the range of 200 to 400nm. This has been performed to know the maxima of Metformin, so that the same wave number can be utilized in HPLC UV detector for estimating the Metformin. While scanning the Metformin solution we observed the maxima at 265 nm. The UV spectrum has been recorded on ELICO SL-159 make UV – Vis spectrophotometer model UV-2450.
Optimized Chromatographic Conditions
Column : C18 Develosil ODS HG-5 RP 150mm x
4.6mm 5µm particle size
Mobile Phase : ACN: phosphate buffer = 30:70 Flow Rate : 1.0ml/minute
Wave length : 225 nm Injection volume : 20 µl Run time : 10 minutes Column temperature : Ambient Sampler cooler : Ambient
Mobile Phase Preparation[6]: The mobile phase used in this analysis consists of a mixture of
phosphate buffer and Acetronitrile in a ratio of 70:30.700 ml of buffer was added and properly mixed with 300 ml of Acetronitrile and a homogenous solution is achieved. This mobile phase was filled and Sonicated for 15 minutes before the experiment.
Sample & Standard Preparation for the Analysis: 25 mg of Metformin standard was
RESULT AND DISCUSSION
Method development and optimization
The amount of drugs in Panex tablet was found to be 49.10 (0.498) mg/tab for Metformin and 99.55 (0.494) mg/tab for Metformin. To develop a precise, linear, specific & suitable stability indicating RP-HPLC method for analysis of Metformin, different chromatographic conditions were applied & the results observed are presented in previous chapters. Isocratic elution is simple, requires only one pump & flat baseline separation for easy and reproducible results. So, it was preferred for the current study over gradient elution. In case of RP-HPLC various columns are available, but here develosil ODS HG-5 RP C18, 5m and 15cmx4.6mm
internal diameter. Column was preferred because using this column peak shape, resolution and absorbance were good. Mobile phase & diluents for preparation of various samples were finalized after studying the solubility of API in different solvents of our disposal (methanol, acetonitrile, dichloromethane, water, 0.1N NaOH, 0.1NHCl). The drug was found to be highly soluble in methanol & dichloromethane and partially soluble in acetonitrile. Drug was insoluble in water.
2.01
2.33
5.57
0 1 2 3 4 5 6 7
RetentionTime(min) 0
50 100 150 200 250 300
Intensity
[image:5.595.178.418.396.526.2](mV)
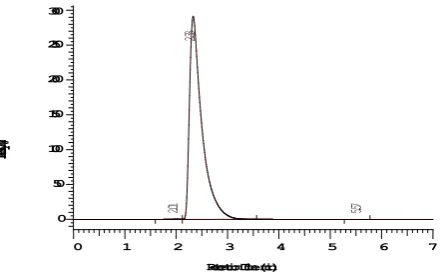
Figure.2. Chromatogram for Metformin (Rt2.39)
2.01
2.33
5.57
0 1 2 3 4 5 6 7
RetentionTime(min) 0
50 100 150 200 250 300
Intensity
(mV)
Figure 3. HPLC spectrum of Metformin (50 ppm) in optimized conditions (RT 2.33
[image:5.595.177.398.566.704.2]Using these solvents with appropriate composition newer methods can be developed and validated. Detection wavelength was selected after scanning the standard solution of drug over 200 to 400nm. From the U.V spectrum of Metformin it is evident that most of the HPLC work can be accomplished in the wavelength range of 240-300 nm conveniently. Further, a flow rate of 1 ml/min & an injection volume of 20 ml were found to be the best analysis.
[image:6.595.163.435.240.393.2]The result shows the developed method is yet another suitable method for assay which can help in the analysis of Metformin in different formulations.
Figure. 4: Chromatogram for blank interference
2.01
2.33
5.57
0 1 2 3 4 5 6 7
RetentionTime(min) 0
50
100 150 200 250 300
Intensit
[image:6.595.171.404.426.585.2]y (mV)
Figure. 5: Chromatogram for standard
METHOD VALIDATION
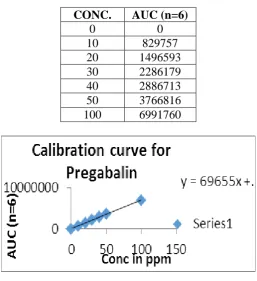
Table. 4: Linearity Data
Figure 6: Linearity data of Metformin
LOD & LOQ: The Minimum concentration level at which the analyte can be reliable
detected (LOD) & quantified (LOQ) were found to be 0.01 & 0.03 µg/ml respectively.
Accuracy
Recovery study[8]: To determine the accuracy of the proposed method, recovery studies were
carried out by adding different amounts (80%, 100% and 120%) of pure drug of Metformin were taken and added to the pre-analyzed formulation of concentration 10g/ml. From that percentage recovery values were calculated.
Table. 5: Accuracy Readings:
CONC. AUC (n=6)
0 0
10 829757 20 1496593 30 2286179 40 2886713 50 3766816 100 6991760
Sample ID Concentration (µg/ml) %Recovery of Statistical Analysis
Pure drug Formulation Pure drug
S1 : 80 % 16 20 101.3 Mean= 100.2733%
S2 : 80 % 16 20 99.25 S.D. = 1.025004
S3 : 80 % 16 20 100.27 % R.S.D.= 1.02221
S4 : 100 % 20 20 99.14 Mean= 99.18%
S5 : 100 % 20 20 99.29 S.D. = 0.096437
S6 : 100 % 20 20 99.11 % R.S.D.= 0.097234
S7 : 120 % 24 20 99.21 Mean= 99.46%
S8 : 120 % 24 20 99.54 S.D. = 0.221133
Precision
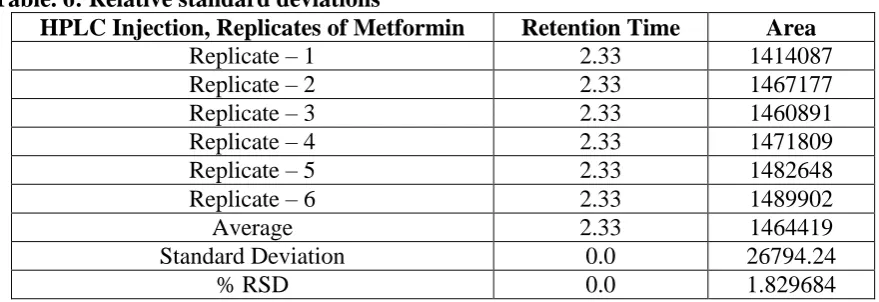
[image:8.595.76.516.197.348.2]Repeatability[9]: The precision of each method was ascertained separately from the peak areas & retention times obtained by actual determination of five replicates of a fixed amount of drug Metformin (API). The percent relative standard deviations were calculated for metformin are presented in the.
Table. 6: Relative standard deviations
HPLC Injection, Replicates of Metformin Retention Time Area
Replicate – 1 2.33 1414087 Replicate – 2 2.33 1467177 Replicate – 3 2.33 1460891 Replicate – 4 2.33 1471809 Replicate – 5 2.33 1482648 Replicate – 6 2.33 1489902 Average 2.33 1464419 Standard Deviation 0.0 26794.24
% RSD 0.0 1.829684
Intra-day & inter-day precision[10]
The intra & inter day variation of the method was carried out & the high values of mean assay & low values of standard deviation & % RSD (% RSD < 2%) within a day & day to day variations for Metformin revealed that the proposed method is precise.
Table.7: Results of intra-day & inter-day precision: Conc. of
Metformin (API) (µg/ml)
Observed Conc. Of Metformin (µg/ml) by the proposed method
Intra-Day Inter-Day
Mean (n=6) % RSD Mean (n=6) % RSD
18 18.03 1.03 18.01 0.46
20 20.09 0.51 19.94 0.28
22 22.14 0.19 22.19 0.15
System Suitability Parameter[11]
System suitability testing is an integral part of many analytical procedures. The tests are based on the concept that the equipment, electronics, analytical operations and samples to be analyzed constitute an integral system that can be evaluated as such. Following system suitability test parameters were established. The data are shown in below table:
Table. 8: Dataof System Suitability Parameter
S.No. Parameter Limit Result
Method Robustness[12]
Influence of small changes in chromatographic conditions such as change in flow rate ( 0.1ml/min), Temperature (20C), Wavelength of detection (2nm) & acetonitrile content in mobile phase (2%) studied to determine the robustness of the method are also in favour of (Table-4, % RSD < 2%) the developed RP-HPLC method for the analysis of Metformin(API).
Table. 9: Result of method robustness test
Change in parameter % RSD
Flow (1.1 ml/min) 0.04 Flow (0.9 ml/min) 0.09 Temperature (270C) 0.01 Temperature (230C) 0.13 Wavelength of Detection (227 nm) 0.07 Wavelength of detection (223 nm) 0.05
Assay of Metformin in Dosage Form
Estimation of Metformin in tablet Dosage Form
Metformin 20 mg
Twenty tablets were taken and the I.P. method was followed to determine the average weight. Above weighed tablets were finely powdered and triturated well. A quantity of powder equivalent to 100 mg of drug was transferred to 100 ml volumetric flask and 70 ml of HPLC grade methanol was added and solution was sonicated for 15 minutes, there after volume was made up to 100 ml with same solvent. Then 10 ml of the above solution was diluted to 100 ml with HPLC grade methanol.[13] The solution was filtered through a membrane filter (0.45
m) and sonicated to degas. From this stock solution (3.5 ml) was transferred to five different 10 ml volumetric flasks and volume was made up to 10 ml with same solvent system. The solution prepared was injected in five replicates into the HPLC system and the observations were recorded. A duplicate injection of the standard solution was also injected into the HPLC system and the peak areas were recorded. The data are shown below,
ASSAY:
Assay % = × × × ×Avg.Wt =
WT = Weight of sample taken in mg DS = Dilution of Standard solution DT = Dilution of sample solution
P = Percentage purity of working standard
Table. 10: Estimation of Metformin in Capsule Dosage Form
Brand name of tablet
Labelled amount of Drug (mg)
Mean (SD) amount
(mg) found by the proposed method (n=6)
Assay + % RSD
Panex (Synapse
(Micro Labs Ltd)) 20 19.91 (0.498) 99.55 (0.494)
CONCLUSION
A sensitive & selective RP-HPLC method has been developed & validated for the analysis of Metformin Active Pharmaceutical Ingredieent. Further the proposed RP-HPLC method has excellent sensitivity, precision and reproducibility. Above results shows the developed RP-HPLC method is yet another suitable method for assay and purity which can help in the analysis of Metformin in different formulations.
REFERENCES
1. Godarzi MO, Brier-Ash M: Metformin revisited: re-evaluation of its properties and role in the pharmacopoeia of modern antidiabetic agents. Diabetes Obes Metab. 2005; 5:
654-665.
2. Jajow Swapna, Chandaka Madhu, Mallepelli Srivani, M. Sumalatha, Y. Nehalatha, Y. Anusha, Analytical Method Development and Method Validation for the Simultaneous Estimation of Metformin hydrochloride and Pioglitazone hydrochloride in Tablet Dosage Form by RP-HPLC. Asian J. Pharm. Ana. 2012; (3): 85-89.
3. Tengli AR, Gurupadayya BM, Soni N, Vishwanathan B Method Development and Validation of Metformine, Pioglitazone and Glibenclamide in Tablet Dosage Form by using RP-HPLC. Biochem Anal Biochem, 2013; (2): 103.
4. Rutvik H Pandya, Rajeshwari Rathod and Dilip G. Maheswari, bioanalytical method development and validation for simultaneous determination of linagliptin and metformin drugs in human plasma by RP-HPLC method, Pharmacophore, 2014; (2): 202-218. 5. Subhashini Edla and B. Syama Sundhar, new analytical method development and
6. R.Pravin Kumar M.Vasudevan and Deecaraman, A Validated Rp–Hplc Method For Simultaneous Estimation Of Metformin And Saxagliptin In Tablets, 2012; 5(2): 137-141. 7. P.D. Sethi, HPLC Quantitative Analysis Pharmaceutical Formulations, CBS Publishers
and distributors, New Delhi, I Edn., 2001.
8. R. Snyder, J. Kirkland, L. Glajch, Practical HPLC Method Development, john Wiley and sons International publication, II Edn., 2011.
9. S.Ashutoshkar, Pharmaceutical Drug Analysis II Edn, New Age International Private Limited Publishers, 2005.
10.H. Beckett and J.B. Stenlake, Practical Pharmaceutical Chemistry, IVEnd., C.B.S. Publishers and Distributors, New Delhi.
11.H.H.Williard, L.L.Merit, F.A.Dean, F.A.Settle, Instrumental Methods Of Analysis, 6th Edn, C.B.S. Publishers and Distributors, New Delhi B.K. Sharma, Instrumental Methods of Chemical Analysis. GOEL Publishing House, Meerut.
12.D.Kealy and P.J.Haines, Instant notes on analytical chemistry by, 30 Jun 2002 Taylor & Taylor & Francis Ltd; publisher, BIOS Scientific Publishers Limited, 2002, UK.