Abstract— In private pension and life insurance systems, companies make investments on their marketing activities to manage customers and determine new prospective customers. Thus, in order to increase the sales and profitability, companies have to use marketing knowledge to support marketing decisions by determining the most-profitable customer profiles. This research proposes a cross selling decision support system which could be used to evaluate the current customers for a possible cross selling opportunity. The proposed framework integrates two methodologies: Design of Experiments (DOE) and Fuzzy Inference method. DOE is used to determine the most profitable customer types. Fuzzy Inference Method is applied in order to establish a rule based system, which could help the decision makers in deciding whether or not the current customer has a cross selling potential. The applicability of the proposed methodology is demonstrated on a Private Pension and Life Insurance company.
Index Terms— Cross selling, Design of experiment, Fuzzy inference, private pension, life insurance
I. INTRODUCTION
Private pension and life insurance systems are two main financial instruments that are founded because of pursuit of security in people lives. Private pension system is a profitable investment system that converts savings into income by planning for your future from today. It functions as a supplementary to the social security system, with government tax advantages, and it allows people to start building savings for a retirement. Life insurance system is based on a contract and when various risks happen during the policy term, such as death and disability, the benefit which is the amount determined in the contract, is given to the beneficiaries. Policyholder is responsible of paying premiums that is calculated based on the coverage amount. Due to possible high profits, private pension and life insurance sector attracts many investors. In this work, we proposed a cross selling strategy to boost the sales by exploring cross selling opportunities. Liu [1] revealed that, the cost of winning a new customer is five times as much as retaining an old customer, and the profit earned by winning over 10 customers can not offset the expense caused by losing a valuable customer, so it is important to grab the potential customers.
Many companies state that to stay profitable, it is essential for them to be able to identify customers where they could optimize profit [2]. This paper introduces cross
Burçin Yakan is a graduate student in Industrial Engineering Program at at Galatasaray University Institute of Science. (e-mail: [email protected]).
S. Emre Alptekin is with the Department of Industrial Engineering, Galatasaray University, İstanbul, TURKEY. (e-mail: [email protected]).
selling decision support system based on design of experiments and fuzzy inference method which aims to identify target customer profiles. The applicability of our approach is demonstrated via a study performed in a private pension and life insurance company. Initially, top performing customers in terms of profitability are identified; among them the most profitable customer profiles have been determined based on factors related to customer and product, for both pension and life insurance system by using design of experiment methodology. After having found most profitable customers; we decided to divide customers into 3 segments in terms of profitability: good customer group, moderate customer group and bad customer group. These three customer segments are used to build a fuzzy rule based system to evaluate customers according to their membership degrees to these three segments. The fuzzy rules are fired according to the calculated membership values of antecedents and the results are obtained as the consequents are combined using Mamdani-style inference methodology. As a result, the profitability of the customer in other product categories is identified by evaluating the customer’s profitability in an existing product category. The fuzzy decision support tool simply revealed scores of the customers in a cross selling environment in terms of profitability.
The remaining part of the paper is organized as follows: in Section 2 we give related literature. Section 3 briefly describes the methodologies that constitute the proposed framework. The steps and details of the proposed decision support are given in Section 4. Finally, Section 5 concludes the study.
II. LITERATURE REVIEW
Cross selling is an important technique in marketing area. Therefore, in the academic literature there are many researches on cross selling techniques. In their study [3] Thuring examined, a credibility method for profitable cross selling of insurance products. Vyas and Math made a comparative study of cross selling in public and private sector banks in India. It is revealed that cross selling practices in public sector and private sector banks are not the same [4]. In their work [5], Malms and Schmitz have investigated the internal preconditions that must be done to realize cross selling potential among existing customers. Kamakura [6] and al. focused on identifying innovators for the cross selling of new products. The wealth of information in databases of companies is useful for identifying customers who are most likely to purchase a new product and in predicting when this adoption happens.
Cross Selling Decision Support System for
Private Pension and Life Insurance Systems
III. THE METHODOLOGY
A. Design of Experiments
Ronald A. Fisher was introduced design of experiments method in 1926, which is about making an factorial experiment in which each of possible combinations of the levels of several factors are located to one or more experiments. [7]
Design of Experiments refers to process of planning, designing and analyzing the experiment by using simple and statistical methods to get outputs effectively and efficiently. [8] A Factorial experiment is an experimental strategy in which factors are varied together, instead of varying each constant in its range. It is a special case of general factorial design with k factors at all two levels. These two levels can be qualitative or quantitative. The simplest factorial designs involves two factors.[9] where all factors have two levels, coded factor levels low for (-) and high for (+).
If the experimenter can decide that that initially some of factors have little or no effect on the response and the high order interactions are negligible, the fewer runs can be applied to get main effects and lower-order interactions. Therefore the fractional factorial design is applied. This is the case when experimenter cannot afford to run all treatment combinations; he can run half of the runs [8].
In this approach, fractional factorial design is used for constructing the experiment.
B. Fuzzy Expert Systems
Polish logician and philosopher Jan Lukasiewicz introduced fuzzy or multi-valued logic in the 1930s. He made a representation of fuzziness based on such terms as tall, old and hot [10]. In 1965 Lotfi Zadeh, Professor and Head of the Electrical Engineering Department at the University of California at Berkeley, published his famous paper ‘Fuzzy sets’. He rediscovered fuzziness, identified and explored it [11].
Crisp set theory consist only two values: true or false. This logic cannot explain uncertain thing because of its form. The basic idea of the fuzzy set theory is that an element belongs to a fuzzy set with a certain degree of membership. Therefore, a case can be both partly true, and partly false with any degree. This degree changes in the interval of [0,1]. Linguistic variables are the base of fuzzy set theory. A linguistic variable is a fuzzy variable as well. In fuzzy expert systems, linguistic variables are used in fuzzy rules.
In 1975, Professor Ebrahim Mamdani applied a set of fuzzy rules that is called The Mamdani-style fuzzy inference. This method has 4 steps: fuzzification of the input variables, rule evaluation, aggregation of the rule outputs, and defuzzification. Fuzzification is the first step is to take the crisp inputs, x1 and y1 (project funding and project staffing), and determine the appropriate fuzzy sets of each input. The second step, rule evaluation is to use membership values and apply them to the antecedents of the fuzzy rules. If a fuzzy rule has more than one part, the fuzzy operators (AND or OR) is used to obtain a single number as a result of evaluation. Aggregation is the part of taking all membership functions of all rule consequents previously and combines them into a single fuzzy set. We get the output which is one fuzzy set for each output variable. The
last step in the fuzzy inference process is defuzzification. The final output of a fuzzy system has to be a crisp number. In fuzzy logic control systems, the defuzzification step involves the selection, from the output fuzzy set, as the best representative element of the fuzzy output set. There are many defuzzification methods. [11]
IV. CASE STUDY
A. Application of Design of Experiments Method
Our aim is the find a best customer in both private pension and life insurance system. After having determined our objective, we identified responses that we want to maximize or minimize. This step was the most crucial one for the design of experiment methodology.
We assumed that the responses of best private pension customer are as follows;
1. The customer who stays in the private pension system as long as possible could be the best customer. The main reason is that the company could charge for a longer period their administration and fund management fees.
2. The customer, who has more pension savings than the others, could be best customer.
After, we have determined the responses; the next part is determining the factors and their corresponding levels.
[image:2.612.316.538.498.703.2]Our query contains, top performing customers who has pension products with highest pension saving and longest duration of stay. In our experiment we needed in total of 192 runs to complete the two responses with customer data. We had 8 factors and we used 28-2-level fractional factorial design with three replications. When we analyzed the initial results, it revealed that the duration of stay response needed a power transformation with lambda value as 1.86. Based on the observations in half-normal probability plot and Pareto chart and initial ANOVA results, the following terms are identified as having an effect on the response: A, C, E, F, G, AC, BG, EF. According to ANOVA results, the model’s F value is 13.85 meaning that model is significant.
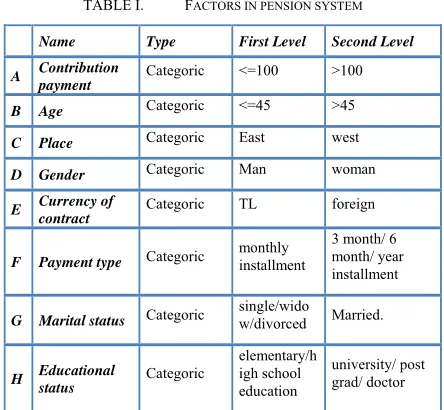
TABLE I. FACTORS IN PENSION SYSTEM
Name Type First Level Second Level
A Contribution payment
Categoric <=100 >100
B Age Categoric <=45 >45
C Place Categoric East west
D Gender Categoric Man woman
E Currency of contract
Categoric TL foreign
F Payment type Categoric
monthly installment
3 month/ 6 month/ year installment
G Marital status Categoric
single/wido
w/divorced Married.
H Educational status
Categoric
elementary/h igh school education
TABLE II. ANOVA DURATION OF STAY IN PENSION SYSTEM
ANOVA and Prediction Equations
Factor
Coefficient
Estimate Factor
Coefficient Estimate
A-Contribution payment
-233471 AC 124572
B-Age 26934.25 AE 63735.38
C-Place 180841.5 AF -5488.3
E-Currency of contract
480305 AG 14581.16
F-Payment type -162554 BE 13489.05
G-Marital status 103606,5 BG 196042.4
EF -95968.5 CE -38721.5
EG 24215.83 CF 3780.131
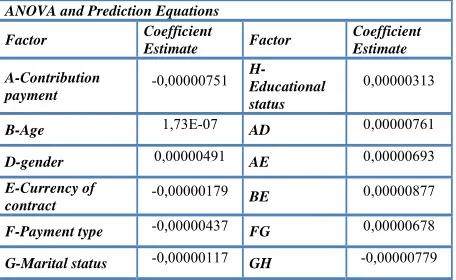
After we determined significant factors for duration of stay response, we followed the same procedures for the other response, pension savings. Similarly, the initial results indicated that, an inverse transformation was needed to be applied to pension savings response. Based on the observations in half-normal probability plot and Pareto chart and initial ANOVA results, the following terms are identified as having an effect on the response: A, AD, AE, BE, FG, GH were the significant model terms.
After we analyzed each response, we wanted simultaneously optimize them. For duration of system response, the goal was maximization, so we choose to maximize it. For pension saving response, the goal was maximization. However the pension saving response was in inverse transformed scale, so we choose to minimize it, to maximize the pension savings. The results are obtained using Design Expert software and the software identified in total 100 customer types in the solution list. The numerical optimization process finds a point that maximizes the desirability function. In our case, desirability obtained was 0.78.
TABLE III. ANOVA PENSION SAVINGS IN PENSION SYSTEM
ANOVA and Prediction Equations
Factor Coefficient
Estimate Factor
Coefficient Estimate
A-Contribution payment
-0,00000751 H-Educational
status
0,00000313
B-Age 1,73E-07 AD 0,00000761
D-gender 0,00000491 AE 0,00000693
E-Currency of contract
-0,00000179 BE 0,00000877
F-Payment type -0,00000437 FG 0,00000678
G-Marital status -0,00000117 GH -0,00000779
In second phase, we examined life insurance system, and carried out the same procedure for life insurance system as well. We assumed the responses of best customer type in life insurance customer are as follows;
1. We assume that company sell renewable life insurance products. That means, the customer who pays the most total premium amount which is calculated by multiplication of premium amount per
year and renewal duration of policy, is the best customer in the life insurance system.
After, we determined the response; the next part was the determination of the factors and their levels.
Our query contained, similarly top performing customers who have highest premium amount in life insurance system. In our experiment we used in total 96 runs to complete the total premium response with customer data. We had 7 factors and used 27-2-level fractional factorial design with three replications. We applied natural log transformation to the total premium amount response, as suggested by Box-Cox Plot. Based on the observations in half-normal probability plot and Pareto chart and initial ANOVA results, the following terms are identified as having an effect on the response: B, E, AG, BE, CG were the significant model terms.
TABLE IV. FACTORS IN LIFE INSURANCE SYSTEM
Name Type First category Second
Category
A Educational
status Categoric
elementary/ high school education
university/ post grad/ doctor
B Age Categoric <=45 >45
C Place Categoric East west
D Gender Categoric Man woman
E Currency of
policy Categoric TL foreign
F Payment
type Categoric
monthly installment
3 month/ 6 month/ year installment
G Marital
status Categoric
single/widow/divor
ced Married.
TABLE V. ANOVA TOTAL PREMIUM IN LIFE INSURANCE SYSTEM
ANOVA and Prediction Equations
Factor Coefficient
Estimate Factor
Coefficient Estimate
A- Educational
status -0,121 AE -0,36897
B- Age 0,670116 AG -0,60815
C- Place -0,08224 BC -0,36253
D- Gender 0,028375 BE 0,530005
E- Currency of
contract 0,846684 CE -0,35251
G- Marital status 0,105229 CG -0,57675
AB -0,33871 DE 0,097384
After we analyzed the response of total premium amount, we continued with optimization step. Our goal was to maximize this value. After numerical optimization was done, the first 100 customer types are examined. Similarly, the numerical optimization found a point that maximizes the desirability function. In our case, desirability obtained was 1.00.
B. Examining Customer Data
[image:3.612.72.300.499.639.2]the scores of different customer types for pension system and life insurance system.
At this phase our initial study involved 100 customers with total scores for private pension product divided into 3 groups in terms of profitability. The first 20 customer profiles are named as good customers, the next 50 customer profiles are named as moderate customer and the last 30 customers are named as bad customers. After we divided customer profiles in 3 parts, we determined threshold values for each group in pension and life insurance systems.
TABLE VI. THRESHOLDS OF GROUPS IN PENSION SYSTEM
good customer threshold score 62,3
moderate customer threshold
score 43,56
bad customer threshold score 10,5
TABLE VII. THRESHOLDS OF GROUPS IN LIFE INSURANCE SYSTEM
good customer threshold
score 55,26
moderate customer threshold
score 16,3
bad customer threshold score 0
C. Application of Fuzzy Expert Systems
The customers belonging to different groups may not respond the cross-selling strategy in the same way. For example, there are many people in good customer group in pension system, and we cannot say, cross selling strategy will be successful for all them. Therefore, we wanted to evaluate cross selling strategies according to the degrees of membership values of the customer groups.
We applied fuzzy logic not only to evaluate customers according to their membership degrees but also to build a fuzzy rule based system that typically includes two distinct parts, evaluation of the rule antecedents and applying the result to the consequent. This model could be used to evaluate the profitability of the customer in the current system, and to reveal the profitability of the customer in other products by means of cross-selling strategy.
In our study, we applied Mamdani-style inference to map from a given input to an output, using the theory of fuzzy sets. Initially, we formed if-then rule model for current pension system customers. Input values are the customer groups in pension system and output values are the customer groups in life insurance system. If a customer is good in pension system, the rules used are:
Rule 1:
If a customer is good in pension system Then he is good in life insurance system Rule 2:
If a customer is good in pension system Then he is moderate in life insurance system Rule 3:
If a customer is good in pension system Then he is bad in life insurance system
For the other customer groups, the rules are formed in the same way.
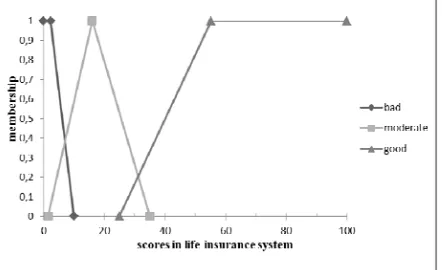
In the fuzzification step, we take crisp inputs, and determine the degree of membership of these inputs to each
of fuzzy set. Hence, we used the scores in private pension system to determine the membership values of crisp values.
Fig. 4.1 Fuzzy Membership of scores in pension system as
input
[image:4.612.314.535.326.461.2]According to Figure 4.1, the membership degrees of crisp values are found. In the second step, rule evaluation, there is no fuzzy operator in fuzzy rules, so we just use the membership degree that we found.
Fig. 4.2 Fuzzy Membership of scores in pension system as
input
The third step, aggregation of the rule outputs is about unification of the all outputs and combining them into a single fuzzy set. In our case, it is the unification of all outputs in life insurance system.
The last step is defuzzification which is about getting a single crisp value of aggregation of all output fuzzy sets. The score of the customer in life insurance system is calculated by center of gravity defuzzification technique.
We follow the same procedure for the customers in life insurance system. This time, the input variables represent the profitability in fuzzy membership function of life insurance system and output variables are similarly indicate the performance in terms of profitability in fuzzy membership function of pension system.
call a selected customer data to offer cross selling. The other strategy is that, call center agent can make a phone call for some reason about customers’ existing product, like taking information about the product and making some changes to the product. At this stage, call center agent, could be able to offer another product to the customer if she/he has enough score in the cross selling system.
At this phase, we decided to develop a cross selling decision support system for call center agents to help them decide when to explore cross selling opportunities.
[image:5.612.317.538.82.234.2]First, we began with pension system as the input to the decision support tool. We draw the fuzzy membership function of pension system, by entering the intersection points of customer groups into the fuzzy tool. Likewise, we draw the fuzzy membership function of life insurance system as an output system. Subsequently, we formed if-then rules as we did in the previous section. We followed the same procedure for life insurance system as well. Input system is fuzzy membership function of life insurance and output system is fuzzy membership function of pension system. Similarly, we formed the rules and fill the weight of each rule. The figure below shows the rules and weight values in private pension system.
Fig. 4.3 If-then rules of pension system in fuzzy tool box
Finally, we developed the cross selling decision support system by fuzzy toolbox of Matlab. That provides call center agent to learn the score of customer in cross selling system, if she/he enters the current score of customer to the decision support system. In Figure 4.4, we entered 50 points to the system as private pension score of customer, and DSS translates this score to the life insurance score in the right hand side of the figure.
V. CONCLUSION
Private pension and life insurance sector in Turkey attributed to its high growth attracts both foreign and Turkish investors. Therefore, there is high rise in the number of domestic and foreign companies which have recently entered the sector and consequently the fierce competition already present in the market heightened its level.
Under competitive conditions, increasing sales and profitability are crucial for companies to survive. Cross selling strategy is a common marketing activity to boost the sales of company with the principle of using different sales opportunities. Since there are many various case features in
real life scenarios, companies have difficulties in adapting their cross selling strategies.
Fig. 4.4 Cross selling DSS using fuzzy toolbox
In order to demonstrate applicability of proposed approach, we have chosen one of the biggest companies in this sector. The customer profiles are examined by design of experiment methodology in order to determine the most profitable customer profiles. In private pension system, duration of stay and saving amount and; in life insurance system, a total premium amount values are selected to be maximized to find target customer profiles. As a result, target customer profiles are determined that optimize these values. Customer profiles are divided into 3 groups in terms of profitability, good customer group, moderate customer group and bad customer group based on scores that are calculated using properties of customer and his/her product. The segmentation into customers groups helps the company to choose a target customer group to apply cross selling.
In this work fuzzy logic is used evaluate customers according to their membership degrees in customer segments. It is applied in order to measure success of sales in cross selling. Thus, if the score of customer is known in the current system, the achievement score in cross-selling system can be calculated.
We utilized Fuzzy toolbox of Matlab, in order to establish cross selling decision support system which calculates the achievement score of customer in cross selling system.
The proposed DSS can be used especially in such circumstances where there is a lack of sales resource, because instead of reaching all current customers, it aims to find target customer profiles. Through this study, by determining target customer profile, company is both increasing its sales and profitability by selling new products to its current customers and profitability is estimated to be long lasting because of selling products to the right customer.
[image:5.612.71.291.312.476.2]various products in each of those systems, so selling right product to right customer can be achieved as well.
ACKNOWLEDGMENT
This research has been financially supported by Galatasaray University Research Fund.
REFERENCES
[1] Liu C., “Customer Segmentation and Evaluation Based on RFM, Cross-selling and Customer Loyalty”, Ph.D. thesis, Jiangsu University, (2011).
[2] Wood A., Leston J., Robertson M., Current practices in the workplace personal pension market: Qualitative research with pension providers and intermediaries, Crown Copyright, (2009).
[3] Thuring F., “A Credibility Method for Profitable Cross-selling of Insurance Products”, Annals of Actuarial Science, 6(1), 65-75, (2011).
[4] Vyas R.S., Math N., “A Comparative Study of Cross- selling Practicies in Public and Private Sector Banks in India”, Journal of Financial Services Marketing, 10(4), 123-134, (2006).
[5] Malms O., Schmitz C., “Cross-Divisional Orientation: Antecedents and Effects on Cross- Selling Success”, Journal of Business-to-Business Marketing, 18(3), 253-175, (2011).
[6] Kamakura W.A., Kossar B., Wedel M., “Identifying Innovators for the Cross-Selling of New Products”, Management Science, 50(8), 1120-1133, (2004).
[7] Adelman S., “Recent Developments in the Design of Factorial Experiments”, Journal of American Statistical Association, 337, 103-111, (1972).
[8] Jiju, A. (ed) (2003). Design of Experiments for Engineers and Scientists: Butterworth Heinamann Press.
[9] Anderson M.J., “Success with DOE”, Quality Software and Analysis, 315, 38-44, (2000).
[10] Black M., “Vagueness: An Exercise in Logical Analysis”, Philosophy of Science, 4(4), 427-455, (1937).