R E S E A R C H
Open Access
OMG U got flu? Analysis of shared health
messages for bio-surveillance
Nigel Collier
1,2*, Nguyen Truong Son
3, Ngoc Mai Nguyen
3From
Fourth International Symposium on Semantic Mining in Biomedicine (SMBM)
Hinxton, UK. 25-26 October 2010
* Correspondence: [email protected] 1
National Institute of Informatics, 2-1-2 Hitotsubashi, Chiyoda-ku,Tokyo, Japan
Abstract
Background:Micro-blogging services such as Twitter offer the potential to crowdsource epidemics in real-time. However, Twitter posts (‘tweets’) are often ambiguous and reactive to media trends. In order to ground user messages in epidemic response we focused on tracking reports of self-protective behaviour such as avoiding public gatherings or increased sanitation as the basis for further risk analysis.
Results:We created guidelines for tagging self protective behaviour based on Jones and Salathé (2009)’s behaviour response survey. Applying the guidelines to a corpus of 5283 Twitter messages related to influenza like illness showed a high level of inter-annotator agreement (kappa 0.86). We employed supervised learning using unigrams, bigrams and regular expressions as features with two supervised classifiers (SVM and Naive Bayes) to classify tweets into 4 self-reported protective behaviour categories plus a self-reported diagnosis. In addition to classification performance we report moderately strong Spearman’s Rho correlation by comparing classifier output against WHO/NREVSS laboratory data for A(H1N1) in the USA during the 2009-2010 influenza season.
Conclusions:The study adds to evidence supporting a high degree of correlation between pre-diagnostic social media signals and diagnostic influenza case data, pointing the way towards low cost sensor networks. We believe that the signals we have modelled may be applicable to a wide range of diseases.
Introduction
Rising awareness of infectious disease outbreaks and the high costs of extending tradi-tional sensor networks means that we have an opportunity to harness new forms of social communication for crisis surveillance. The trend is already underway with auto-matic map generation from Twitter reports for earthquakes and typhoons [1,2], the symptom-based influenza tracking portal Flutracking [3] as well as the humanitarian portal Ushahidi [4]. Despite a risk of high false reporting rates there is nevertheless strong potential in having multiple sensor sources for verification, robustness and redundancy. In the case of earthquake detection, Earle notes that Twitter messages (tweets) can be available up to 20 minutes before the official report from the US Geo-logical Survey. With epidemics too the time period from signal to detection is critical.
Recent studies such as [5] estimate that the average delay in receiving and disseminat-ing data from traditional sentinel physician networks is about two weeks.
A small but growing number of early warning systems have already developed to mine event information from low cost Web sources mainly focusing on edited news-wire reports (see Hartley et al.[6] for a survey). Success in operationalizing such sys-tems has crucially depended on building close collaborations with government and international public health agencies in order to perform detailed verification and risk assessment.
Recent studies on alerting from newswire reports [7] are beginning to make clear the operational boundaries in terms of their selectivity, volume and timeliness. In this ear-lier work the first author (NC) noted the issue of late warnings, i.e. where there is a known outbreak in a country but spikes in true alerts at the province or city level are occluded by low rising aggregated data for the country as a whole. To overcome such problems micro-blogging might have a role to play. Micro-blogs may be able to help also with very early epidemic detection, i.e. at the pre-diagnostic stage where there is maximum scientific uncertainty about symptoms, transmission routes and infectivity rates. Automatic geo-coding and the ability to send messages from many types of mobile device are a key advantage in this respect.
Background
In micro-blogging services such as Twitter, users describe their experiences directly in near-real time in short 140 character tweets. As of April 2010 it was estimated that Twitter had approximately 106 million registered users with 300,000 new users being added each month. Despite their potential coverage, timeliness and low overhead, tweets present their own unique challenges: pre-diagnostic unedited reports mean that there is a large trust issue to resolve within the modeling technique. Social media can also reflect a high degree of reactivity to risk perception as seen during the H1N1 pan-demic in 2009 –redistributing links or requests for information rather than generating user experience. To an extend this reflects newswire coverage and the amount of uncertainty readers feel. Re-tweets in themselves may provide useful signal but their role has yet to be quantified. Despite these obvious challenges we believe there is potential for using very short messages to detect epidemic trends, as hinted at by the success of Google Flu Trends [8] which harness user’s search queries.
[11] showed for the 2009 Influenza A(H1N1) pandemic there was a strong Spearman’s Rho correlation with ILI and acute respiratory infection (ARI) data from sentinel net-works in Europe.
Nevertheless challenges in interpreting query and social networking data remain. Ortizet al.[12] for example discuss the potential for confusion in Google Flu Trends between ILI and non-influenza illnesses. Influenza data was compared from Google Flu, the CDC outpatient surveillance network and the US influenza virological surveil-lance system. Whilst correlation with ILI was found to be high, it was found that cor-relation with actual influenza test positive results was lower. This result highlights the fact that both social media and user queries are secondary indicators that should be correlated with patient reported symptoms. Significant deviation between user’s search-ing behaviour and ILI rates was noted for the 2003-2004 influenza season when influ-enza activity, pediatric deaths and news media coverage of influinflu-enza were particularly high. This highlights another understudied issue: that we need to work hard to remove elements of reporting bias during media storms.
Methods
Annotation
Taking Jones and Salathé’s behaviour responses as a starting point we surveyed poten-tial messages in Twitter in relation to H1N1 influenza topics. Prom an inipoten-tial group of thirteen categories we decided, due to low frequency counts, to conflate several into a final grouping of four. e.g. avoiding people who cough/sneeze, avoiding large gather-ings of people, avoiding school/work and avoiding travel to infected areas were joined into a general ‘avoidance behaviour’ category. To this we added a final category for direct reporting of influenza. The final list of categories is: (A) Avoidance Behavior – behaviours which avoid agents thought to be at risk of infection; (I) Increased sanita-tion –sanitation measures to promote individual health and prevent infection; (P) Seeking pharmaceutical intervention –seeking clinical advice or using medicine or vaccines; (W) Wearing a mask; and (S) Self reported diagnosis –reporting that one has influenza. The first four categories correspond approximately to Bish and Michie’s [13] three broad categories of protective behaviour: preventive (I, W and vaccinations from P), avoidance (A), and management of disease (using medication and seeking clinical advice from P but excluding using the Internet and help lines).
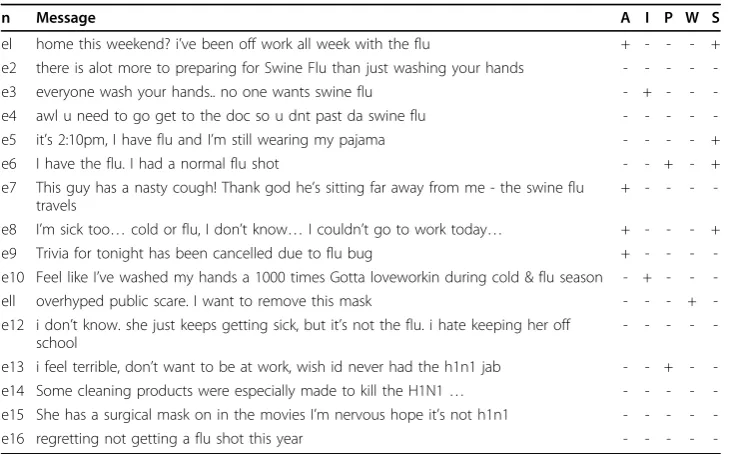
As expected there are a number of caveats to each of these broad classes. We list up only a representative sample here: (1) A message is only tagged positive if the user or a close family member is the subject of the tweet; (2) If the message indicates that the action is hypothetical then the classification is negative; (3) The time of the reported event should be within one week of the current time; (4) Messages can belong to more than one category. Examples of (anonymised) messages are shown in Table 1.
frequently used in tweets to indicate irony, e.g. that’s true –cough cough, and‘fever’ often indicates intense enthusiasm, e.g.Christmas fever,Bieber fever, app fever, etc.
The second stage used hand built patterns to select a total of 14,508 tweets. From these we randomly chose 7,412 tweets spread across the five classes. All duplicates were removed leaving 5,283 messages and the resulting data was then classified by hand using a single annotator as detailed in Table 2. Results for mean character length and standard deviation showed no category-specific trend except to illustrate the wide variety of message lengths.
In order to test the stability of the annotation scheme and our assumptions about its reproducibility we calculated kappa for 2,116 messages balanced across all the classes. For this another annotator was chosen who did not take part in the creation of the guidelines and was not a co-investigator in this study. The simple agreement ratio was 0.88 (the total number of matched class assignments divided by the total number of messages). Kappa was calculated as = (pA –pE)/(1–pE), wherepA was 0.88 andpE was 0.12. was then found to be 0.86. Both results reveal a high level of agreement in the annotation scheme and give us confidence to move ahead with automated classifi-cation. Note that the final annotation scheme guidelines can be obtained on request from the first author.
Table 1 Example messages
n Message A I P W S
el home this weekend? i’ve been off work all week with the flu + - - - +
e2 there is alot more to preparing for Swine Flu than just washing your hands - - - -
-e3 everyone wash your hands.. no one wants swine flu - + - -
-e4 awl u need to go get to the doc so u dnt past da swine flu - - - -
-e5 it’s 2:10pm, I have flu and I’m still wearing my pajama - - - - +
e6 I have the flu. I had a normal flu shot - - + - +
e7 This guy has a nasty cough! Thank god he’s sitting far away from me - the swine flu travels
+ - - -
-e8 I’m sick too…cold or flu, I don’t know…I couldn’t go to work today… + - - - +
e9 Trivia for tonight has been cancelled due to flu bug + - - -
-e10 Feel like I’ve washed my hands a 1000 times Gotta loveworkin during cold & flu season - + - -
-ell overhyped public scare. I want to remove this mask - - - +
-e12 i don’t know. she just keeps getting sick, but it’s not the flu. i hate keeping her off school
- - - -
-e13 i feel terrible, don’t want to be at work, wish id never had the h1n1 jab - - + -
-e14 Some cleaning products were especially made to kill the H1N1… - - - -
-e15 She has a surgical mask on in the movies I’m nervous hope it’s not h1n1 - - - -
-e16 regretting not getting a flu shot this year - - - -
-Positive (+) and negative (-) examples of classified messages.
Table 2 Message frequency by class
A I P W S
Positive 251 37 499 32 741
Negative 632 43 974 230 1873
Total 883 80 1443 262 2614
Mean length 109.2 118.8 107.0 117.3 100.9
Sd. length 28.9 21.9 30.6 27.7 33.4
N/P ratio: 0.40 0.86 0.51 0.14 0.40
Models
We employed two widely used classification models implemented in the Weka Toolkit [14], Naive Bayes (NB) and Support Vector Machines (SVMs) [15] classifying five data sets (total 5283 messages) into positive or negative. SVM used a RBF-kernel and grid search for finding the best parameter settings. Since we hypothesized that custom built regular expressions might have more traction for achieving high precision we decided to use a freely available toolkit called the Simple Rule Language (SRL) [16] for this purpose. SRL comes with an interface for maintaining the rule base which can be run in testing mode to convert surface expressions into structured information.
SRL rules were built from a held out set of tweets not used in training. Rules consist of string literals, skip expressions, word lists, named entity classes and guard expres-sions for limiting the scope of matched entities. Rule building took approximately 10 hours of work. The rule book contains specialised synonym sets to recognize common and slang terms for medicines (e.g.shot, vaccine,drug, tamiflu,jab, medicine, υacc), physicians (e.g.doctor,doc,dr,physician) and other key domain entities. Verb lists are maintained for specialized lexical classes such as prescribe (e.g. prescribe,perscribe*). Lists are also built for pronouns, common temporal adverbs, modal verbs and nega-tions. Special rules were built to recognize past events. The exceptional class was I (increased sanitation) where we were not able to identify enough examples with confi-dence to build meaningful rules by hand. In this case only unigrams and bigrams were used to train the classifiers.
We found that the language used in tweets to express user’s behaviour is very diverse and idiosyncratic so it is challenging to achieve a high degree of coverage in the rules with surety. With this in mind we combined features from the rules with unigrams and bigrams. If a rule matched a tweet its feature value was set to 1, otherwise to 0.
Results 1: classification experiments
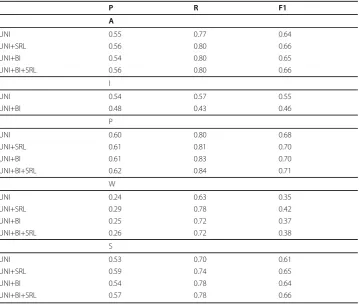
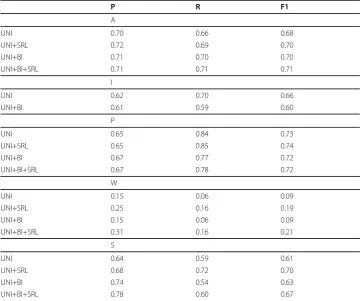
Test runs used 10-fold cross validation on categories A, P and S and 3-fold cross vali-dation on categories I and W due to small number of items. We calculated recall, pre-cision and F-score performance for each category. As we can see by comparing the results in Tables 3 and 4, SVM overall performs better on all categories except for W (wearing a mask). The low F-scores for the W category seem to be a result of the strongly biased negative data in this category, conforming to predictions of earlier stu-dies on imbalanced data sets such as [17]. To confirm this assumption we conducted undersampling on the negative data so that the number of items equaled the number of positive items within each class. We then repeated the experiments and found that overall, performance was uniformly higher and that classes like W which performed poorly did well (data not shown).
Both SVM and NB model’s performance generally follows the amount of training data except for S (Self diagnosis) where the F-score is slightly lower than the trend in other classes despite large numbers of positive examples. The overall trend for NB is to have stronger recall than precision whereas for SVM precision is generally higher than recall.
message length and classification accuracy in NB and SVM. For NB, whilst the length of messages didn’t seem to make much difference to the false negative rate which remained constant at about 0.2 to 0.25 on messages in the length range of 34 to 144 characters, it impacted to a greater degree on false positives (0.23 on shorter messages of length 34 to 56 down to 0.08 for messages of length 122 to 144). For SVM there appeared to be a general reduction in both false positives and false negatives as mes-sage length increased.
As expected, frequent misspellings, abbreviated word forms, slang and lack of punc-tuation complicated the classification task. Missing auxiliary verbs and articles need to be compensated for within the SRL rules in order to ensure successful matching.
Results 2: comparison to CDC data
In order to provide a proof of concept we operationalised the classifiers and ran them on a corpus of Twitter data called the Edinburgh Corpus [18]. The Edinburgh corpus holds 97 million tweets for the period November 11th 2009 to February 1st 2010 from 9 million users. This represents over 2 billion words from a variety of languages. Of these 12.5 million are reported as topic tags, 55 million are @ replies and 20 million are links.
We applied the same keyword filtering method used on the Edinburgh corpus for the first set of experiments and obtained 52,193 tweets for the period of study. Following this we applied the SVM UNI model and then compared the week by week volumes Table 3 Results for Naive Bayes classification
P R F1
A
UNI 0.55 0.77 0.64
UNI+SRL 0.56 0.80 0.66
UNI+BI 0.54 0.80 0.65
UNI+BI+SRL 0.56 0.80 0.66
I
UNI 0.54 0.57 0.55
UNI+BI 0.48 0.43 0.46
P
UNI 0.60 0.80 0.68
UNI+SRL 0.61 0.81 0.70
UNI+BI 0.61 0.83 0.70
UNI+BI+SRL 0.62 0.84 0.71
W
UNI 0.24 0.63 0.35
UNI+SRL 0.29 0.78 0.42
UNI+BI 0.25 0.72 0.37
UNI+BI+SRL 0.26 0.72 0.38
S
UNI 0.53 0.70 0.61
UNI+SRL 0.59 0.74 0.65
UNI+BI 0.54 0.78 0.64
UNI+BI+SRL 0.57 0.78 0.66
against laboratory results for weeks 47 to 5 of the 2009-2010 influenza season in the USA [19]. Counts are shown in Table 5. Several interesting trends can be observed: (a) The total volume of positively identified Tweets was relatively small compared to the volume of Tweets as a whole; (b) Wearing a mask was totally absent from our classi-fied data; (c) The aggregated counts for self protection (A+I+P, data not shown) seem to have a close correlation to CDC results (data not shown). To measure correlation Table 4 Results for SVM classification
P R F1
A
UNI 0.70 0.66 0.68
UNI+SRL 0.72 0.69 0.70
UNI+BI 0.71 0.70 0.70
UNI+BI+SRL 0.71 0.71 0.71
I
UNI 0.62 0.70 0.66
UNI+BI 0.61 0.59 0.60
P
UNI 0.65 0.84 0.73
UNI+SRL 0.65 0.85 0.74
UNI+BI 0.67 0.77 0.72
UNI+BI+SRL 0.67 0.78 0.72
W
UNI 0.15 0.06 0.09
UNI+SRL 0.25 0.16 0.19
UNI+BI 0.15 0.06 0.09
UNI+BI+SRL 0.31 0.16 0.21
S
UNI 0.64 0.59 0.61
UNI+SRL 0.68 0.72 0.70
UNI+BI 0.74 0.54 0.63
UNI+BI+SRL 0.78 0.60 0.67
F1 results for tweet classification using SVM. UNI = unigram, BI = bigram, SRL = Simple Rule Language regular expression
Table 5 Twitter positives versus CDC cases
Wk A S I P CDC
46A 49 48 22 222 2715
47 32 72 30 258 1408
48 24 49 9 181 997
49 35 41 10 199 610
50 35 39 10 154 480
51 21 35 12 150 251
52 19 26 4 37 285
1 25 32 6 63 266
2 25 32 5 81 261
3 29 31 7 73 317
4 29 20 7 62 268
5 29 23 6 46 290
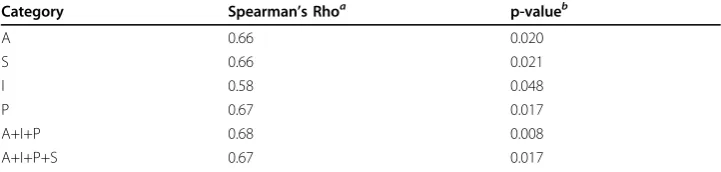
we calculated the Spearman’s Rho (see http://en.wikipedia.org/wiki/Spearman% 27s_rank_correlation_coefficient) between counts of positive messages in each class and the CDC laboratory data for A(H1N1). Table 6 shows moderately strong correla-tions. The strongest correlation appeared when A,I and P were combined. Besides W which failed to provide any data, the weakest evidence came from Increased sanitation (I). Differences could be due to (a) the global geographic coverage of tweets in our col-lection; and (b) the syndromes covered in our self protection behaviour and self report-ing messages are wider than A(H1N1) and could actually be other diseases such as common colds, strep throat, adenovirus infection and so on.
Drill down analysis reveals that we still need to do more to remove false positives by strengthening the linguistic features within the limits of the 140 character length. Examples of false positives include interrogative sentences, hypothetical sentences, reports on events that took place in the distant past, comments on influenza advice from others, etc.
Conclusions
In this paper we have made the first steps towards classifying Twitter messages accord-ing to self reported risk behaviour. The results have shown moderately strong correla-tion with CDC A(H1N1) data but we still need to make further progress in order to achieve the high degrees of correlation reported between Google Flu trends and senti-nel influenza data. The next step will be to extend our training data, automatically compensate for imbalanced classes, strengthen the linguistic features and see if we can use these signals to detect emerging disease outbreaks. It was shown in Jones and Sal-athé that after an initial peak in levels of risk concern, anxiety faded once the immedi-ate threat of the A(H1N1) pandemic had passed. In follow up work with data over longer time periods we intend to look at how closely these signals track epidemic case data.
In terms of the limitations of this study, we found that the volume of positively clas-sified messages was lower than we had expected and we could not yet find evidence that pre-diagnostic self-protective or self-reporting messages were predicting rises in the case data from laboratories. The effects of reporting bias were largely ignored in our study and future work will need to take account of the demographic characteristics of Twitter users in terms of their specific location and average age. For example it has been found by Lau et al.[20] that older people are more likely to report self-protective behaviour in an avian influenza pandemic. We also ignored possible associations between preventive behaviours and the perceived severity of the disease [13].
Table 6 Correlation between Twitter positives and CDC cases
Category Spearman’s Rhoa p-valueb
A 0.66 0.020
S 0.66 0.021
I 0.58 0.048
P 0.67 0.017
A+I+P 0.68 0.008
A+I+P+S 0.67 0.017
We believe that the signals we have modeled may be applicable to a wide range of diseases and we intend to explore how these features can be used to detect diseases other than influenza. Besides disaster alerting, results from analysis of behavioural responses may also help in the future to evaluate the success of official prevention campaigns. For example, it is known that little notice was taken of antiviral therapies, goggle or mask wearing advice in the Netherlands after the Avian Influenza epidemic was introduced to Europe [21]. Conversely, empirical studies of individual risk percep-tion in disease severity and susceptibility may help official agencies to tune risk com-munication strategies more effectively.
List of abbreviations
GP: General Practitioner; ILI: Influenza like illness; NB: Naive Bayes; SVM: Support Vector Machines; SRL: Simple Rule Language; CDC: United States Centers for Disease Control and Prevention
Acknowledgements
We gratefully acknowledge grant support from the National Institute of Informatics for this study. The research work in its first unrevised form was presented at the SMBM 2010, Hinxton, Cambridge, U.K.
This article has been published as part ofJournal of Biomedical SemanticsVolume 2 Supplement 5, 2011: Proceedings of the Fourth International Symposium on Semantic Mining in Biomedicine (SMBM). The full contents of the supplement are available online at http://www.jbiomedsem.com/supplements/2/S5.
Author details
1National Institute of Informatics, 2-1-2 Hitotsubashi, Chiyoda-ku,Tokyo, Japan.2Japan Science and Technology Agency,
2-1-2 Hitotsubashi, Chiyoda-ku,Tokyo, Japan.3Vietnam National University at HCMC, Ho Chi Minh City, Vietnam.
Author contributions
The study was conceived and directed by NC, corpus collection, analysis and guideline development was done by NM and the machine learning experiments were done by NS. All authors contributed and agreed to the final version of this manuscript.
Competing interests
The authors declare that they have no competing interests.
Published: 6 October 2011
References
1. Earle P:Earthquake Twitter.Nature Geoscience2010,3(4):221-222, Doi:10.1038/ngeo832.
2. Sakaki T, Okazaki M, Matsuo Y:Earthquake shakes twitter users: real-time event detection by social sensors.Proc. of the 19th International World Wide Web Conference, Raleigh, NC, USA2010, 851-860.
3. Dalton C, Durrheim D, Fejsa J, Francis L, Carlson S, ursan d’Espaignet Ee:Flutracking: A weekly Australian community online survey of influenza-like illness in 2006, 2007 and 2008.Communicable Disease Intelligence2009,33(3):316-322, Doi:10.1038/ngeo832.
4. Okolloh O:Ushahidi, or‘testimony’: Web 2.0 tools for crowdsourcing crisis information.Participatory Learning and Action2009,59:65-70.
5. Cheng CK, Lau EH, Ip DK, Yeung AS, Ho LM, Cowling BJ:A profile of the online dissemination of national influenza surveillance data.BMC Public Health2009,9:339.
6. Hartley D, Nelson N, Walters R, Arthur R, Yangarber R, Madoff L, Linge J, Mawudeku A, Collier N, Brownstein J, Thinus G, Lightfoot N:The landscape of international biosurveillance.Emerging Health Threats J2010,3(e3), Doi:10.1093/ bioinformatics/btn534.
7. Collier N:What’s unusual in online disease outbreak news?Biomedical Semantics2010,1, Doi:10.1186/2041-1480-1-2.
8. Ginsberg J, Mohebbi M, Patel R, Brammer L, Smolinski M, Brilliant L:Detecting influenza epidemics using search engine query data.Nature2009,457:1012-1014.
9. Jones J, Salathé M:Early assessment of anxiety and behavioral response to novel swine-origin influenza A(H1N1).
PLoS One2009,4(12):e8032.
10. Lampos V, De Bie T, Cristianini N:Flu Detector - Tracking Epidemics on Twitter.Machine Learning and Knowledge Discovery in Databases, Volume 6223/20102010, 599-602, Lecture Notes in Computer Science.
11. Valdivia A, Lopez-Alcalde J, Vicente M, Pichiule M, Ruiz M, Ordobas M:Monitoring influenza activity in Europe with Google Flu Trends: comparison with the findings of sentinel physician networks -results for 2009-10.
Eurosurveillance2010,15(29):2-7.
12. Ortiz JR, Zhou H, Shay DK, Neuzil KM, Goss CH:Does Google Influenza Tracking Correlate With Laboratory Tests Positive For Influenza?Am. J. Respir. Crit. Care Med2010,181:A2626.
13. Bish A, Michie S:Demographic and attitudinal determinants of protective behaviours during a pandemic: A review.
British Journal of Health Psychology2010.
15. Cristianini N, Shawe-Taylor J:An introduction to support vector machines and other kernel-based learning methods.
Cambridge, EnglandCambridge University Press;0521780195 2000.
16. McCrae J, Conway M, Collier N:Simple Rule Language Editor.Google code project2009, Available from: http://code. google.com/p/srl-editor/.
17. Akbani R, Kwek S, Jakowicz N:Applying support vector machines to imbalanced datasets.European Conference on Machine Learning, Pisa, Italy2004, 39-50.
18. Petrovic S, Osborne M, Lavrenko V:The Edinburgh Twitter Corpus.Proc. #SocialMedia Workshop: Computational Linguistics in a World of Social Media, LA, USA2010, 25-26.
19. Division CI:FluView: 2009-2010 Influenza Season Week 20 ending May 22, 2010.Technical reportCenters for Disease Control and Prevention; 2010, Available at http://www.cdc.gov/flu/weekly/.
20. Lau J, Kim J, Tsui H, Griffiths S:Anticipated and current preventive behaviours in response to an anticipated human-to-human H5N1 epidemic in the Hong Kong Chinese general population.BMC Infectious Diseases2007,
7(18):18-29.
21. De Zwart O, Veldhuijzen IK, Elam G, Aro AR, Abraham T, Bishop GD, Richardus JH, Brug J:Avian influenza risk perception, Europe and Asia.Emerging Infectious Diseases2007,13(2):290-293.
doi:10.1186/2041-1480-2-S5-S9
Cite this article as:Collieret al.:OMG U got flu? Analysis of shared health messages for bio-surveillance.Journal
of Biomedical Semantics20112(Suppl 5):S9.
Submit your next manuscript to BioMed Central and take full advantage of:
• Convenient online submission
• Thorough peer review
• No space constraints or color figure charges
• Immediate publication on acceptance
• Inclusion in PubMed, CAS, Scopus and Google Scholar
• Research which is freely available for redistribution