The annual demand for electric energy in rural areas in Poland is about 15 000 GWh. The statutory responsibility for meeting this demand lies within companies dealing with electric energy transmission and distribution. On the electric energy market, the companies contract to buy electric energy. In par-ticular, their contracts concern annual demands. In-adequate contracting of electric energy increases the costs of customers’ service and adversely influences the quality of services rendered by the company. Such contracting may especially concern services rendered to rural consumers as – apart from this problem – the real unit costs of electric energy sup-ply exceed there the prices of electric energy.
To determine the amounts to be ordered, the com-panies develop forecasts of annual sales of electric energy using various methods. Transformations un-dergoing in Poland since nineties have considerably lowered the reliability of the forecasting methods used so far because electric energy forecasting was to be carried out under turbulent conditions. The pursuit of forecast improvement has been expressed in the interest in alternative forecasting methods to which deterministic-chaos-based methods are included.
The goal of the paper was to verify the determin-istic chaos-based models, especially the self-similar fractal models, logistic models according to Pri-gogine, logistic models according to Schuster, and
the heuristic crossing models for one-year-ahead forecasting of the sale of electric energy in the rural areas by a three selected companies from the south of Poland.
MATERIAL AND METHODS Model based on fractal dimension
Fractals are objects whose arbitrary small parts are shaped similarly to the shape of the whole. This property is called similarity. Analogously self-similar time processes can be defined to which the processes of annual consumption of electric energy can be included. A most simple forecast model for self-similar random time function is of the following form (Dobrzańska 2002):
Σ Xi Xi-1
Xt+1 = Xt i=2t (1) Σ Xi-1
where: Xt+1 – forecast of electric energy sale for the year t+1, Xt – electric energy sale in the year t.
The model assumes correlated values of electric energy sales values in years t and t+1 and was em-ployed in the paper to step forecasting of annual sales of electric energy where Xt+1 was treated as the best approximation of Xt+1 in the sense of the minimum of mean square error (Cieślak 1999).
Applicability of models based on deterministic chaos
theory for forecasting of electricity sales in rural areas
M. Trojanowska
Department of Energetics of Agriculture, Agricultural University of Cracow, Cracow, Poland
Abstract: The applicability of models based on deterministic chaos theory, in particular the self-similar fractal mod-els, logistic models according to Prigogine, logistic models according to Schuster, and heuristic crossing models for one-year-ahead forecasting of the sales of electric energy in the rural areas, is verified in the paper. The model quality assessment was carried out based on the errors analysis of the 10-year ex post forecasts of the electric energy sale to rural consumers by three selected distribution companies. As the electric energy consumption were disturbed by eco-nomic crises, the forecasts were developed using not only annual sales value but also using their 2-, 3-, 4- and 5-year totals. The best forecast were obtained when the electric energy sales were predicted using the Schuster and heuristic crossing models, made on the basis of four- and five-year totals of annual sales values.
Keywords:electric energy; forecast; deterministic chaos
ˆ
t
2
i=2
ˆ
Model according to Prigogine
Based on the logistic equation cited by Prigogine (1980), the forecast model for can be written as:
X
t
Xt+1 = Xt + rX (1 – ) (2) K
where: r – coefficient of increase of annual sales rate of electric energy,
K – upper limit of increase, the other symbols as in equation 1.
The behaviour of the process depends on the value of r and the ratio K to X at the initial time instant. In the paper, parameters K and r were determined iteratively based on the annual electric energy sales statistics. The iterations were started inserting K equal to the largest historical annual sales of electric energy and were ended when the difference of the subsequent values of K was less than 1/106.
Model according to Schuster
Forecast model of annual electric energy sales based on the Schuster mapping (Schuster 1984) is:
Xt+1 = (1 + αt+1) X0 (3)
αt+1 = r αt(1 – αt) (4)
X
t – xt–1
αt = (5)
Xt–1
X
t+1 – Xt–1
αt+1 = (6)
Xt–1
where: Xt–1, Xt, Xt+1 – electric energy sales values in years t–1, t, and t+1, respectively,
X0 – annual electric energy sales value taken from the history of the process preceding the fore-cast starting moment,
αt, αt+1 – relative increments of annual electric energy sales,
r – external parameter determined from learn-ing series.
Heuristic crossing model
Heuristic crossing model form is similar to the Schuster mapping (Equation 2) where the relative in-crement αt+1 described by relationship 4 is replaced by the operator:
αt+1 = r (αt – αt–1) + αt 0 ≤ r ≤ 1 (7) In the paper, for r > 1 the value of r = 1 was adopted in the forecast, and for r < 0 the value of r = 0.
Annual electric energy sales in years 1980–2003 were the learning series for forecasting. Because step forecast of annual electric energy sales was the aim of the forecast, one-year-apart pairs of annual electric energy sales values were taken from the learning series.
RESULTS AND DISCUSSION
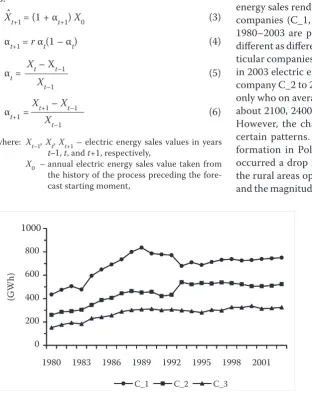
In Figure 1 the time courses of annual electric energy sales rendered by three selected distribution companies (C_1, C_2, C_3) in rural areas in years 1980–2003 are presented. The sales quantities are different as different were the operating areas of par-ticular companies. And thus company C_1 provided in 2003 electric energy to 354 000 rural consumers, company C_2 to 220 000, and C_3 to 140 000 clients only who on average consumed respectively in 2003 about 2100, 2400 and 2200 kWh of electric energy. However, the character of sales changes suggests certain patterns. After the social-economic trans-formation in Poland began, i.e., after 1990, there occurred a drop in electric energy consumption in the rural areas operated by the selected companies, and the magnitude of this drop and its duration were
ˆ
ˆ
0 200 400 600 800 1,0001980 1983 1986 1989 1992 1995 1998 2001
(G
W
h)
[image:2.595.68.381.365.782.2]C_1 C_2 C_3
Figure 1. Time courses of annual electric energy sales rendered to rural customers by selected distribution companies in years 1980–2003
ˆ
ˆ
different. After this consumption drop period, the electric energy demand trend in the considered rural areas is rising.
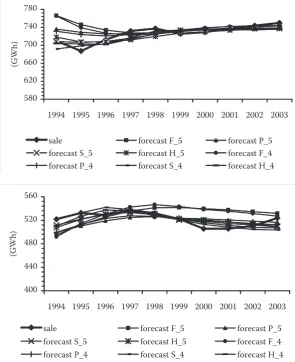
A commonly used technique of forecasting meth-od accuracy assessment is the methmeth-od of ex post forecasts which can be summed up as the analysis of properties of an error set obtained by comparing the results of the implemented forecasting proce-dures with real realizations of the process. Based on relationships 1 through 7 ten-year ex post forecasts of electric energy sales in rural areas under con-sideration were developed. As forecasting models are very sensitive to the dynamics of the process and the electric energy sales time courses were
dis-turbed by economic crises, the forecasts were made not only using annual values of sales but also their two, three, four and five-year totals. The forecast-ing quality assessment was made based on absolute values of ex post forecast errors (Cieślak 1999) as the most commonly used acceptability measures of the electric energy demand forecasts. For each of the companies, the values of these errors turned out to be the smallest for forecasts based on four and five-year totals of annual sales, being in some cases more than two times smaller than the errors of forecasts determined using annual values. The comparison of real values of sales with their ex post forecasts developed with individual models four and five-year 580
620 660 700 740 780
1994 1995 1996 1997 1998 1999 2000 2001 2002 2003
(G
W
h)
sale forecast F_5 forecast P_5
forecast S_5 forecast H_5 forecast F_4 forecast P_4 forecast S_4 forecast H_4
400 440 480 520 560
1994 1995 1996 1997 1998 1999 2000 2001 2002 2003
(G
W
h)
sale forecast F_5 forecast P_5
[image:3.595.65.361.57.420.2]forecast S_5 forecast H_5 forecast F_4 forecast P_4 forecast S_4 forecast H_4
Figure 2. 10-year ex post forecasts of elec-tric energy annual sales to rural custom-ers by a distribution company C_1
[image:3.595.65.532.671.756.2]Figure 3. 10-year ex post forecasts of elec-tric energy annual sales to rural custom-ers by a distribution company C_2
Table 1. Mean absolute percentage errors of 10-year ex post forecasts of electric energy annual sales to rural customers by the selected distribution company
Company
Fractal model Prigogine’s model Schuster’s model Heuristic crossing model 5-year
F_5 4-year F_4 5-year P_5 4-year P_4 5-year S_5 4-year S_4 5-year H_5 4-year H_4
C_1 2.43 2.41 1.78 1.62 1.17 1.38 1.37 1.39
C_2 3.46 3.43 2.33 2.03 1.32 1.10 1.43 1.28
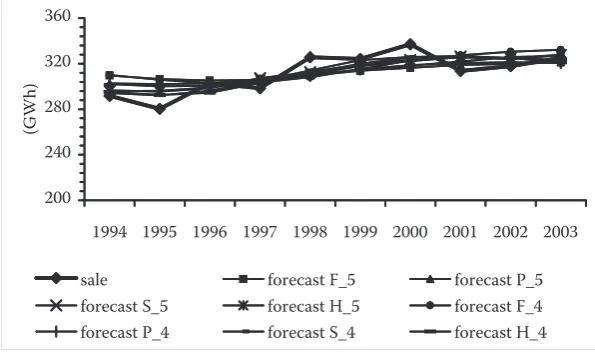
totals are presented in Figures 2–4, and the mean absolute values of the errors of these forecasts are presented in Table 1.
CONCLUSION
1. The calculations made confirmed the suitability of the models of the deterministic chaos origin, and, in particular, the self-similar fractal-dimen-sion based models, logistic models according to Prigogine and according to Schuster, and heuristic crossing models to forecasting the annual sales of electric energy to rural clients, which is supported by a few percent ex post forecast errors of this variable.
2. The best forecast for all the companies were obtained when the electric energy sales were pre-dicted using the Schuster and heuristic crossing models.
3. To improve the forecast accuracy when the time courses of electric energy consumption are
dis-200 240 280 320 360
1994 1995 1996 1997 1998 1999 2000 2001 2002 2003
(G
W
h)
sale forecast F_5 forecast P_5
[image:4.595.63.361.58.234.2]forecast S_5 forecast H_5 forecast F_4 forecast P_4 forecast S_4 forecast H_4
Figure 4. 10-year ex post forecasts of elec-tric energy annual sales to rural custom-ers by a distribution company C_3
turbed by economic crises, the forecasts may be developed using four- and five-year totals of an-nual sales values.
References
Cieślak M. (1999): Prognozowanie gospodarcze. Metody i zastosowania. Wydawnictwo Naukowe PWN, Warszawa, 47–57.
Dobrzańska I. (2002): Prognozowanie w elektroenerge-tyce. Zagadnienia wybrane. Wydawnictwo Politechniki Częstochowskiej, Częstochowa, 157–175.
Prigogine I. (1980): From Being to Becoming. Time and Complexity in the Physical Sciences. W.F. Freeman, New York, 36–40.
Schuster H.G. (1984): Deterministic chaos. An introduction. Physik Verlag, Wenheim, 12–14.
Received for publication November 11, 2005 Accepted after corrections December 15, 2005
Abstrakt
Trojanowska M. (2006): Vhodnost modelů založených na teorii determinovaného chaosu při sestavování prognóz ročního prodeje elektrické energie na venkově. Res. Agr. Eng., 52: 25–29.
narušovány ekonomickými krizemi, byly tyto prognózy vyhotovovány nejen na ročních hodnotách prodeje, ale také na jejich dvou-, tří-, čtyř- a pětiletých souhrnech. Prognózy nejvyšší kvality byly získány sestavením prognóz prodeje elektrické energie odběratelům na venkově na základě modelů podle Schustera a modelů heuristického křížení, zpra-covaných na čtyř- nebo pětiletých souhrnech.
Klíčová slova: elektrická energie; prognóza; teorie determinovaného chaosu
Corresponding author:
Prof. Małgorzata Trojanowska, Agricultural University of Cracow, Department of Energetics of Agriculture, Balicka Street 104, 30-149 Cracow, Poland