pressure. Three-dimensional finite element analysis is employed to estimate the coefficient of friction from the maximum pressing load, a crucial variable in die design. The finite element model consists of a billet, a plunger, a ram, and a die, where the interface between the billet and the die is modeled by the Coulomb friction model with truncated shear stress. The numerical model was validated by comparing the grid deforma-tion patterns in the extrusion symmetry plane, and by comparing the load versus stroke curves for the ram (pressing load) and for the plunger (back pressure). Results indicate that the coefficient of friction can be accurately estimated from the maximum pressing load, but it is necessary to modify the traditional Coulomb friction model. [doi:10.2320/matertrans.MH201513]
(Received March 7, 2016; Accepted June 3, 2016; Published June 24, 2016)
Keywords: equal channel angular extrusion, finite element analysis, friction model
1. Introduction
Equal channel angular extrusion (ECAE), originally pro-posed by Segal et al.1), is a popular forming process for
fabri-cating bulk nanostructured materials (BNM). The extruded material presents enhanced mechanical properties such as high strength and superplasticity, which are caused by the se-vere plastic deformation (SPD) inflicted by the extrusion. In ECAE, a lubricated billet, with either a square or circular cross-section, can be repetitively extruded without changing the billet s geometry, through a die of equal channels that in-tersect each other at a fixed angle. The process is very popular in laboratories, but it does not have the same popularity in the industrial world. The reason is simple: ECAE can be scaled up for soft and easy-to-work materials, as demonstrated by Horita et al.2), but is still far from being applied to a wider
variety of commercial materials and to larger billets. The main impasse to extruding larger billets and difficult-to-work materials is how to properly design the die for industrial use.
As a result, many studies on ECAE have been published since Prangnell3) published the first finite element analysis
(FEA) of ECAE. The focus of the majority of the numerical investigations has been to understand the effect of parameters such as die geometry4–8), billet geometry9,10), ram speed11,12),
processing routes13,14), temperature9,15), and material
proper-ties9,11,15,16) on the strain homogeneity of the extruded
mate-rial. Many of these variables, including the die geometry, bil-let geometry, material properties, and processing route, are important for the die design. As yet, however, little attention has been paid to friction, a physical variable that is known to play a crucial role in extrusion even when the billet is lubri-cated, because it directly affects the deformation behavior, strain distribution, maximum pressing load and, consequent-ly, the die design.
Attempts to characterize the effect of friction in strain ho-mogeneity by employing three-dimensional finite element simulations of ECAE have been made by Suo et al.17), Son et
al.18), Su et al.19), Djavanroodi et al.20), Nagasekhar et al.21)
and Si et al.22) These studies present contradictory findings
regarding how the friction affects the deformation behavior.
For instance, Suo et al.17) provided evidence that the friction
differently affects the strain homogeneity for each direction, and that the strain homogeneity increases with the friction. The fact that strain homogeneity increases with the increase in friction is corroborated by Su et al.19) and Djavanroodi et
al.20) However, Si et al.22) found that better strain
homogene-ity is achieved for low values of friction. Son et al.18) found
that the forming loads are dependent on the friction condi-tion. Nagasekhar et al.21) proved that it is possible to calculate
the maximum peak load in ECAE by adjusting the coefficient of friction.
These studies have produced estimates of frictional effects on the deformation behavior of the billet as a function of a predefined range for the coefficient of friction. However, fric-tion in ECAE is relatively constant; thus, a specific coefficient of friction value, which will be depend on the extruded mate-rial, must be obtained for proper die design. Furthermore, these studies opt for either of two distinct friction models: Coulomb or shear friction, without any justification for the choice of one in detriment of the other.
In this context, this study has two objectives. First, it aims to present an alternative model to numerically approach fric-tion in ECAE while avoiding discrepancies between numeri-cal and experimental data. Second, it aims to implement a method to estimate the coefficient of friction, which is essen-tial for die design, for ECAE with and without back pressure. To accomplish these propositions, a three dimensional FEM model, symmetric in the lateral direction, is employed to esti-mate the coefficient of friction in ECAE with and without back pressure.
2. Finite Element Analysis
2.1 Finite element model and analysis conditions
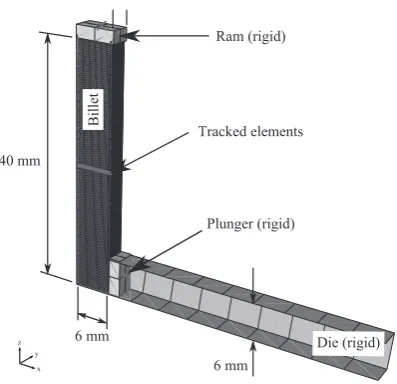
The present study is focused on ECAE through a sharp die of a rectangular cross section with an angle of 90 , under the effect of a hydrostatic back pressure (Fig. 1). All cases in this study employed a three-dimensional finite element model that was simulated using commercial Abaqus/Explicit code. A three-dimensional approach is elected because it provides a realistic approximation, i.e., it enables qualitative analysis of the material flow, deformation behavior, stress-strain
distribu-*
tion, load requirement, and frictional effects. A number of studies were systematically conducted a priori to define some of the simulation parameters, e.g., the number and type of elements, loading rates, and mass scaling, in terms of numer-ical error and computational time.
To decrease the computational cost, only the lateral half of the system (consisting of a billet, a die, a ram, and a plunger) was modeled while considering symmetrical boundary condi-tions (Y-plane). Because only the billet s deformation is con-sidered, the die, the ram, and the plunger were modeled as rigid bodies employing rigid elements. The ram was con-strained to move in the vertical direction (z-axis) with a ve-locity of 1 mm s−1. The back pressure (176.06 MPa, the same
value applied in the validation experiment) was applied uni-formly on the head surface of the billet through the plunger, which was constrained to move in the horizontal direction (x-axis). The die consisted of inlet and outlet channels with an inner corner angle of ϕ = 90 and an outer corner angle of ψ = 0 . This study concentrated on this geometry because it pro-vides the most homogeneous deformation and micro-struc-ture development during ECAE23,24).
The billet, with a square cross sectional area of 6 × 6 mm2
and a length of 40 mm, was modeled using 55664 eight-node linear brick elements, based on a mesh convergence study. The billet was considered as commercially pure copper (E = 130 GPa, ν = 0.36, ρ = 8960 kg m−3) and modeled as an
elas-tic-plastic material with von Mises yield criterion. The mate-rial properties were obtained from an uniaxial tension test (Fig. 2). The tension test was performed at the velocity of 0.5 mm min−1 using a rectangular tensile specimen made of
pure copper (99.9 mass%) with dimensions 6.0 mm × 3.0 mm × 1.0 mm (gauge length, width, thickness), which was annealed for one hour at the temperature of 400 C. The Voce hardening law was employed to fit the experimental data and to extrapolate the strain values over 0.5, because they exceed this range during a single pass ECAE. The strain hardening behavior was assumed to be isotropic and indepen-dent of strain rate and temperature.
Because the billet s material properties are rate indepen-dent, increasing the loading rates (artificially elevating the
punch speed), and the mass scaling (artificially increasing the material density), can be employed to decrease the time re-quired to simulate an explicit case. These two techniques can be employed as long as inertial effects caused by these in-creases are negligible. The significance of the inertial effects was analyzed by systematically comparing kinematic and in-ternal energy, the overall deformation behavior, and the press-ing load (load versus stroke curve) for a wide range of cases. The penalty method and the Coulomb friction model with truncated shear stress18,25) were employed to model the
con-tact and friction on the interface between the billet and the die. In this study, the truncated shear stress is given as τmax =
σyo/√3 which does not depend on plastic hardening to
sim-plify the friction modeling and its dependency on the load-stroke relationship, where σyo is the Mises yield stress (for
copper σyo = 168 MPa obtained experimentally). To
accom-modate the large deformations, and consequently avoid the numerical instabilities generated by the severe mesh distor-tion, the model employed adaptive mesh refinement using the arbitrary Lagrangian-Eulerian (ALE) method. Additionally, heat supposedly generated from the contact (friction) and the deformation were neglected.
2.2 Validation of the FE model
An ECAE experiment was conducted on commercially pure copper to validate the FEM analysis. The samples were prepared with the same cross sectional area as the numerical model and extruded in a steel die with the same geometry as its numerical counterpart, i.e., ϕ = 90 , ψ = 0 . In order to de-crease frictional effects, Teflon based lubricant was applied in both the die and billet before the extrusion, after which the samples were extruded at room temperature by a ram with a constant speed of 1 mm s−1. During the extrusion, with a total
stroke of 30 mm, a hydrostatic force of 6.34 kN (back pres-sure = 176.06 MPa) was applied to the billet s head using an hydraulic actuator. Both the pressing load required to extrude the billet and the hydrostatic back pressure were recorded for verification of the numerical model. Moreover, a grid was en-graved by employing electrolytic marking in the y plane, to evaluate the grid deformation behavior as an extra variable for model verification as suggested by Bowen et al.4) The
val-idation of the numerical model was conducted by comparing two aspects of the experimental and numerical results; these included:
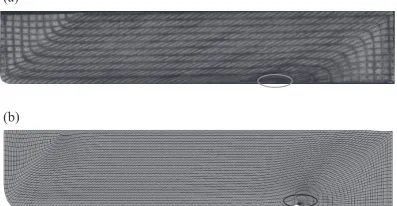
i a comparison of the grid deformation patterns in the sym-metry plane of the extruded sample and the corresponding finite element analysis (Fig. 3), and
ii a comparison of the load versus stroke curves for the ram
Fig. 1 Finite element model of ECAE and mirror symmetry on the xz plane are employed in this study. The elements tracked to acquire the strain distribution for the convergence analysis are highlighted.
[image:2.595.69.268.66.258.2] [image:2.595.329.527.71.180.2](pressing load) and the plunger (back pressure) obtained experimentally and numerically (Fig. 4).
The first aspect was analyzed by simply comparing Figs. 3(a) and 3(b). The finite element results emulated the overall behavior of the extruded sample, presenting a reason-able level of agreement between grid deformation patterns for all three main areas of the sample: the head, the steady state zone, and the tail. Clearly, aside from a small deformation caused by the compression/upsetting, the tail experienced no significant deformation. This is expected because the region does not pass through the plastic deformation zone in the in-tersection of the outer and inner corners. Following the exam-ple of the tail, the head was hardly deformed by shear because it had already effectively passed through the plastic deforma-tion zone, and the small deformadeforma-tion observed in this region was caused entirely by the back pressure. On the other hand, the steady state region presented a very uniform strain distri-bution inflicted by the dominant deformation mode; i.e., the single shear produced in the junction between the outer and
results for the ram (pressing load) and the plunger (back pres-sure). It is possible to observe that they present an excellent level of agreement, with similar trends, as can be seen in Figs. 4(a) and 4(b). The trend shows that the curve has a very steep slope until the yield limit is reached, after which this slope decreases drastically as the material flows through the second channel. Nevertheless, a small discrepancy was ob-served in the ram case results that is not significant enough to introduce a substantial error. This difference is mainly due to the small gap that exists between the sample and the inlet channel, which is caused by the difference between the inlet channel width and the billet s dimensions. This gap is primar-ily filled by the billet s upsetting, and generates the small change in slope in the curve (the region is indicated in Fig. 4(a)).
3. Results and Discussion
The results of the present work are discussed in terms of a method to estimate the coefficient of friction based on the maximum pressing load, which is obtained from the load ver-sus stroke curves for cases with and without back pressure. A precise estimation of the coefficient of friction is important, because the friction plays an important role in the deforma-tion behavior, strain distribudeforma-tion and maximum pressing load that occur during ECAE.
3.1 Determination of the coefficient of friction in ECAE
Prior studies have reported the relationship between the maximum pressing load and the coefficient of friction. Xu et
al.26) found a linear relation for these variables while
Esmail-zadeh et al.27) presented a third degree polynomial to relate
them. However, these two studies do not go further in esti-mating the coefficient of friction for ECAE. A remarkable initiative to calculate the coefficient of friction for this pro-cess was proposed by Nagasekhar et al.21) and Patil et al.28)
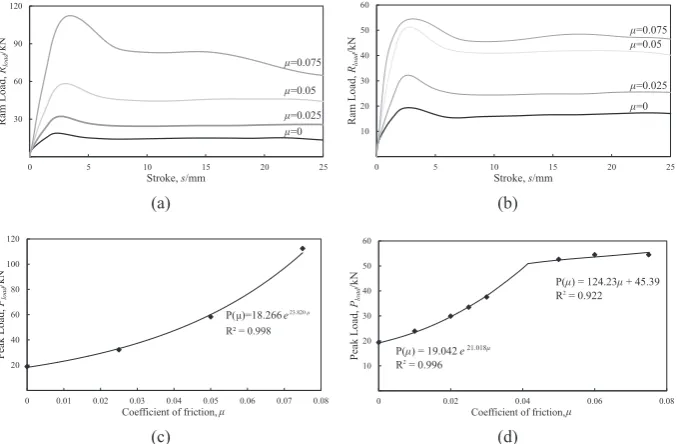
The first step in their approach is to obtain by FEM a series of curves representing the pressing load versus the stroke for a predefined range of the coefficients of friction. All obtained curves are plotted in the same graph, as depicted in Fig. 5(a). In this study, the coefficient of friction ranges from μ = 0 to
μ = 0.075 in increments of 0.025. This initial estimate is based on typical coefficient of friction values for cold metal form-ing, as stressed in the work of Kim29).
The second step is to find the points of local maximum in each of the curves in Fig. 5(a); this is calculated using the condition d
dsRload = 0 and d 2
ds2Rload < 0, where Rload is the ram
pressing load and s is the stroke. From these maxima, a curve representing the maximum pressing load versus the coeffi-cient of friction is obtained, as depicted in Fig. 5(c). This is an excellent idea; however, the numerical pressing load
predict-Fig. 4 Recorded ram and plunger loads and a comparison of load versus stroke curves between experimental and numerical simulation (study case: commercially pure copper billet extruded at 1 mm s−1, ϕ = 90◦ , ψ = 0◦ , μ = 0.021). The circled region is caused by the small difference
be-tween the inlet channel width and the billet s dimensions. (a) Comparison for the ram, (b) Comparison for the plunger.
[image:3.595.70.269.75.178.2]ed in their independent studies presented some discrepancies for the third and fourth stages of ECAE (Fig. 6). For these two stages, the numerical pressing load decreases continu-ously; this is not observed in their ECAE experimental results or in results of similar experiments conducted by Son et al.18),
and Aour et al.30)
The disparities observed can be attributed to the Coulomb friction model employed in their numerical study. This ap-proach assumes that the frictional effects are a specific func-tion of the normal contact stresses, which keep these forces constant for the entire process. In the cases depicted in Fig. 5(a), an increase in the coefficient of friction yields an increase in the pressing load. Considering only the maximum pressing load on these curves, the results indicate that the co-efficient of friction has an exponential dependency on the maximum pressing load, i.e., P(μ) = 18.266e23.820μ, which
seems physically improbable. This is a clear indication that the Coulomb friction model is not appropriate for simulating this process, a fact also stressed by Balasundar and Raghu25).
A better approach to model the friction would be defining a maximum shear stress, as suggested in this work. In this approach, if the friction shear stress exceeds the maximum value defined, the friction stress is always maintained at a lev-el lower than the yilev-eld stress of the material in pure shear.
Although the two friction models predicted similar results for the low friction cases, the results for the cases with relatively high friction (μ > 0.05) are quite different. Comparing Fig. 5(a) to Fig. 5(b), it is clear to notice that the second ap-proach maintains the pressing load within a certain limit, be-cause the relations between the pressing load, the maximum pressing load, and the coefficient of friction present an as-ymptotic behavior (Fig. 5(d)). It is important to mention that the coefficient of friction can still be calculated from the fit-ting obtained from the correlation depicted in Fig. 5(d).
3.2 Determination of the coefficient of friction in ECAE with back pressure
The same method and friction model can also be applied to cases of ECAE with back pressure (Fig. 7). The pressing loads obtained for these cases are different from those in the previous cases, in which four stages can be distinguished. The only similarity between the cases with and without back pres-sure is that they all maintain the curve s original shape (μ = 0), which is amplified according to the frictional effect until the asymptotic limit. In the previous cases, the maximum press-ing load, i.e., the absolute maximum, served to estimate the coefficient of friction; however in the back pressure case this value is not clearly identifiable. In order to choose appropri-ately, it is necessary to define where this point must be select-ed.
An acceptable solution is to use the local maximum that corresponds to the beginning of the steady state for the plastic strain distribution by employing d
dsLsteady state = 0 and
d2
ds2Lsteady state < 0, as in the previous case. The steady state
deformation is achieved numerically around a total stroke of 5 mm, so that the corresponding maximum pressing load can be identified for each case in Fig. 7(a). The next step is to plot a graph of this local maximum pressing load versus the coef-ficient of friction, and fit an appropriate function to the data.
Thus, using the experimental data acquired in this study and the correlation calculated from the FE model (Fig. 7(b)), it is possible to estimate the coefficient of friction during
Fig. 5 A comparison of (a) Coulomb and (b) maximum shear approaches for the load required to extrude the billet through the channels for four friction conditions, and a comparison of the Coulomb (c) and maximum shear (d) approaches for the maximum pressing load versus coefficient of friction, μ.
Fig. 6 Typical pressing load stages on ECAE obtained in numerical simu-lation (study case: commercially pure copper billet extruded at 1 mm s−1,
[image:4.595.130.469.70.292.2] [image:4.595.66.270.336.444.2]ECAE for copper as μ = 0.021. This value has a percentage error of 5% in relation to the experimental value of 0.02 esti-mated by Smolyakov et al.31) The method of this study was
also applied to pure aluminum. Contrary to the case already discussed, the graphics for the pure aluminum case are not presented, to maintain the conciseness of this work. For this case, the estimated coefficient of friction during ECAE is μ = 0.125, with a percentage error of 4.2% in relation to the value
μ = 0.12 suggested by Djavanroodi and Ebrahimi20) and Jung
et al.32)
4. Conclusion
This study has systematically proven that the friction mod-el affects the pressing load (load versus stroke curve), which is an important variable for ECAE system (tool and die) de-sign. Consequently, the friction model must be carefully se-lected in 3D FE simulations. Additionally, this study con-firmed that the pressing load (load versus stroke curve) should be employed to estimate the coefficient of friction during a single pass ECAE of pure copper and pure aluminum. How-ever, it is necessary to modify the traditional Coulomb fric-tion model, which is popularly employed in ECAE simula-tions, to include the material maximum shear stress value. This yields better agreement with the experiments and a more realistic representation of the frictional effects. Additionally, the method is extended to ECAE with a back pressure for which a distinct value, based on steady state zone formation, must be chosen to find the correlation with the coefficient of friction. The accuracy of the improved and extended method is supported by the small margin of error between experimen-tal and numerical results. A limitation of this study is that the the FE model was validated by performing a qualitative anal-ysis of the grid deformation patterns between experimental
(No. 15K18205).
REFERENCES
1) V.M. Segal, V.I. Reznikov, A.E. Drobyshevskii and V.I. Kopylov: Russ. Metall. 1 (1981) 99–105.
2) Z. Horita, T. Fujinami and T.G. Langdon: Mater. Sci. Eng. A 318 (2001) 34–41.
3) P.B. Prangnell, C. Harris and S.M. Roberts: Scr. Mater. 37 (1997) 983– 989.
4) J.R. Bowen, A. Gholinia, S.M. Roberts and P.B. Prangnell: Mater. Sci. Eng. A 287 (2000) 87–99.
5) H.S. Kim, M.H. Seo and S.I. Hong: J. Mater. Process. Technol. 130 (2002) 497–503.
6) A.V. Nagasekhar and Y. Tick-Hon: Comput. Mater. Sci. 30 (2004) 489– 495.
7) J.-H. Lee, I.-H. Son and Y.-T. Im: Mater. Trans. 45 (2004) 2165–2171. 8) W. Wei, A.V. Nagasekhar, G. Chen, Y. Tick-Hon and K.X. Wei: Scr.
Mater. 54 (2006) 1865–1869.
9) H.S. Kim, P. Quang, M.H. Seo, S.I. Hong, K.H. Baik, H.R. Lee and D.M. Nghiep: Mater. Trans. 45 (2004) 2172–2176.
10) S.C. Yoon, M.H. Seo and H.S. Kim: Scr. Mater. 55 (2006) 159–162. 11) H.S. Kim, M.H. Seo and S.I. Hong: Mater. Sci. Eng. A 291 (2000)
86–90.
12) S.W. Chung, W.-J. Kim, M. Kohzu and K. Higashi: Mater. Trans. 44 (2003) 973–980.
13) T. Suo, Y. Li, Q. Deng and Y. Liug: Mater. Sci. Eng. A 466 (2007) 166– 171.
14) C.W. Su, L. Lu and M.O. Lai: Mater. Sci. Technol. 23 (2007) 727–735. 15) D.P. Delo and S.L. Semiatin: Metallurgical and Materials Transactions
A 30 (1999) 1391–1402.
16) S.L. Semiatin, D.P. Delo and E.B. Shell: Acta Mater. 48 (2000) 1841– 1851.
17) T. Suo, Y. Li, Y. Guo and Y. Liu: Mater. Sci. Eng. A 432 (2006) 269– 274.
18) I.H. Son, Y.G. Jin, Y.T. Im, S.H. Chon and J.K. Park: Mater. Sci. Eng. A 445 (2007) 676–685.
19) C.W. Su, L. Lu and M.O. Lai: Mater. Sci. Technol. 23 (2007) 727–735. 20) F. Djavanroodi and M. Ebrahimi: Mater. Sci. Eng. A 527 (2010) 1230–
1235.
21) A.V. Nagasekhar, S.C. Yoon, Y. Tick-Hon and H.S. Kim: Comput. Ma-ter. Sci. 46 (2009) 347–351.
22) J.Y. Si, F. Gao and J. Zhang: Journal of Iron and Steel Research 19 (2012) 54–58.
23) S. Li, M.A.M. Bourke, I.J. Beyerlein, D.J. Alexander and B. Clausen: Mater. Sci. Eng. A 382 (2004) 217–236.
24) S.J. Oh and S.B. Kang: Mater. Sci. Eng. A 343 (2003) 107–115. 25) I. Balasundar and T. Raghu: Mater. Des. 31 (2010) 449–457. 26) S. Xu, G. Zhao, X. Ma and G. Ren: J. Mater. Process. Technol. 184
(2007) 209–216.
27) M. Esmailzadeh and M. Aghaie-Khafri: Comput. Mater. Sci. 63 (2012) 127–133.
28) B.V. Patil, U. Chakkingal and T.S.P. KumarPrasanna: 17th Internation-al Conference on MetInternation-allurgy and MateriInternation-als 2008 (2008) 1–9. 29) H.S. Kim: Mater. Sci. Eng. A 430 (2006) 346–349.
30) B. Aour, F. Zaïri, R. Boulahia, M. Naït-Abdelaziz, J.-M. Gloaguen and J.-M. Lefebvre: Comput. Mater. Sci. 45 (2009) 646–652.
31) A.A. Smolyakov, V.P. Solovyev, A.I. Korshunov and N.A. Enikeev: Mater. Sci. Eng. A 493 (2008) 148–159.
32) K.-H. Jung, D.-K. Kim, Y.-T. Im and Y.-S. Lee: Int. J. Plast. 42 (2012) 120–140.
[image:5.595.68.268.68.328.2]