Phase Separation and Crystallization in Cu-Zr Metallic Glasses
N. Mattern
1;*, U. Ku¨hn
1, A. Concustell
2, A. Scho¨ps
3, M. D. Baro
2and J. Eckert
11Leibniz-Institute for Solid State and Materials Research IFW Dresden, P.O. Box 27 01 16, D-01171 Dresden, Germany 2Department of Physics, University Barcelona, 08193 Bellaterra, Spain
3
HASYLAB at DESY, Notkestr. 85, D-22603 Hamburg, Germany
The structural behavior of rapidly quenched Cu-Zr amorphous alloys was analyzed. High energy X-ray diffraction patterns and atomic pair correlation functions exhibit monotonic changes with composition. The experimental results can be well described by a solid solution-like replacement of Cu and Zr atoms in the whole composition range. No indications are observed that would support the existence of phase separation in the supercooled liquid state of the binary Cu-Zr alloys. For Cu60Zr30Ti10and Cu60Zr20Ti20bulk metallic glasses the formation of ultrafine nanostructures are proven upon heating. The transformation starts below the glass transition temperature. Phase separation in Cu-Zr-Ti bulk metallic glasses is related to primary crystallization. [doi:10.2320/matertrans.MJ200708]
(Received November 29, 2006; Accepted December 28, 2006; Published June 25, 2007)
Keywords: metallic glasses, X-ray diffraction, phase separation, short-range order
1. Introduction
Cu-based bulk metallic glasses (BMG’s) with high strength and about 2% fracture strain were first developed
by Inoueet al.1)in the Cu-Zr-Ti and the Cu-Hf-Ti systems.
Quite recently, high plasticity in compression tests was
reported for binary Cu-Zr2)and ternary Cu-Zr-Al BMG’s.3)
Nano-scale heterogeneities are discussed to be responsible for the improved ductility hindering the shear band prop-agation and creating multiple shear bands. A number of explanations for extraordinary plasticity and work hardening in monolithic BMG’s have been suggested, including high
Poisson’s ratio,4)separation into two amorphous phases in the
supercooled liquid,5)formation of a nano-structured
compo-site during casting,6)and nano-crystallization during
defor-mation produced by the flow within the shear bands.2)
However, the mechanisms of structure formation and the transformation at the microscopic scale are not well
under-stood so far. Earlier publications7,8) reported the occurrence
of phase separation in the undercooled liquid state of binary Cu-Zr alloys.
The aim of this paper is to study the structural behavior of Cu-based metallic glasses in a wide composition range. The analysis of the concentration dependence of structural and thermodynamic properties should give evidence whether or not phase separation in the Cu-Zr glasses exists, which is of importance for understanding the mechanical properties of BMG’s.
2. Experimental
Pre-alloyed ingots were prepared by arc-melting of elemental Cu, Zr and Ti with a purity of 99.9% or better in a Ti-gettered argon atmosphere. For reaching homogeneity, the samples were remelted several times. From the Cu-Zr
pre-alloys, 3 mm wide and 25mmthick amorphous ribbons
were prepared by means of rapid quenching from the melt using a single-roller melt-spinner under argon atmosphere.
Glassy samples of Cu60Zr30Ti10and Cu60Zr20Ti20with 3 mm
diameter and 50 mm length were prepared by copper mold casting of the prealloys. Discs of 1 mm in height were cut from the rods. To analyze the short- and medium-range order, high energy X-ray diffraction experiments were conducted at the synchrotron beam-line BW5 (HASYLAB, Hamburg)
using a wavelength of¼0:01250nm. Differential scanning
calorimetry (DSC) experiments were performed employing a Netzsch DSC 404 calorimeter using a heating rate of 40 K/ min.
3. Results and Discussion
3.1 Short-range order of amorphous Cu-Zr versus composition
Figure 1 shows experimental atomic pair correlation
functionsgðrÞof Cu-Zr glasses calculated from the measured
X-ray structure factorsSðqÞby the Fourier transform:9)
0.3 0.5 0.7 0.9 1.0
0 2 4 6
Cu
50Zr50 meas.
calc.
Cu35Zr65 meas.
calc.
Cu
65Zr35 : ∆g = gmeas.- gcalc.
Cu
65Zr35 meas.
calc.
Atomic Pair Correlation
g
(
r
)
Interatomic distance,
r
/ nm
0.4 0.6 0.8
Fig. 1 Atomic pair correlation functionsgðrÞof amorphous CuxZr100x.
*Corresponding author, E-mail: [email protected]
[image:1.595.315.538.542.766.2]4r0 ðgðrÞ 1Þ
¼ 2
Z
ðSðqÞ 1Þ qsinðqrÞ dq ð1Þ
whereðrÞis the atomic pair density distribution function and
0 is the mean atomic density.
ThegðrÞcurves exhibit systematic changes for the
differ-ent compositions. The total atomic pair correlation function
gðrÞrepresents the weighted sum of the partial atomic pair
correlation functionsgijðrÞ:9)
gðrÞ ¼X
i
X
j
wijgijðrÞ: ð2Þ
The weight factorswij¼cicjfi fj=ð
P
icifiÞ2depend on
the concentrationci, and the atomic form amplitude fi is of
the i-atom. For all gðrÞ curves, two components of the first
maximum are visible altering the heights with composition.
The differences ingðrÞof the alloys are mainly related to the
composition dependence of the weight factors wij. The
interatomic distancer1
Zr-M¼0:275nm corresponds to
zirco-nium-metal distances in Cu-Zr compounds, and r1
Zr-Zr¼
0:312nm to the zirconium-zirconium respectively. The
Cu-Cu contributions are not resolved in the totalgðrÞcurve. It is
not possible to determine the exact partial interatomic
distances rij and coordination number Nij from the total
atomic pair correlation function gðrÞbecause the pair-wise
contributions are superposed. But the 3 partial pair
correla-tiongijðrÞfunctions can be extracted from the 3 experimental
functionsgðrÞby solving the linear equation systemgxðrÞ ¼
P
i
P
jwij;xgijðrÞ. The applied procedure is based on the
assumption that the partial functionsgijðrÞdo not change with
composition, which is similar to an isomorphous substitution. The correctness of that can be proven by the recalculation of the total atomic pair correlation functions from the 3 partial functions. Figure 1 compares the recalculations (lines) with
the experimental curves (points). The difference curveg¼
gmea.gcalc. is also shown for amorphous Cu65Zr35. The
good agreement results in a low mean square root valuesof
0.3% between measured and calculated g(r) curves, and
demonstrates that the partialgijare not or only very weakly
[image:2.595.313.539.73.296.2]dependent on the chemical composition between 35 and 65 at% Cu.
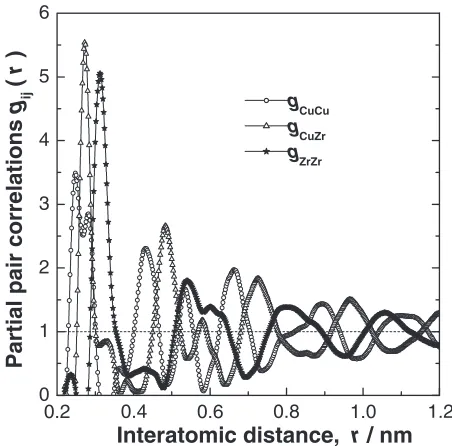
Figure 2 shows the obtained 3 partial atomic pair
corre-lation functionsgCuCu,gCuZr, and gZrZr. The position of the
first maximum or the nearest neighbor distances rCu-Cu¼
0:248nm,rCu-Zr¼0:272nm, andrZr-Zr¼0:312nm are in a
general agreement with the data given in.10,11) The Cu-Cu
distance r¼0:248nm corresponds to the atomic diameter.
The direct Cu-Cu contact present in amorphous Cu-Zr alloys deviates from the Cu environment of some of the crystalline counterparts pointing to differences in short-range order, e.g.
in crystalline CuZr2the Cu atoms are not nearest neighbors at
all, and in the bcc CuZr phase, the smallest Cu-Cu distance
is equal to the Cu-Zr distance.12) From the partial pair
correlation functiongijthe partial nearest neighbor numbers
Nij can be calculated by the integration over of the first
maximum. Figure 3 shows the composition dependence of the partial nearest neighbor numbers. The calculated values are proportional to the corresponding element concentrations. The assumption of unchanged partial pair correlation
functions implies directly a continuous solid solution behav-ior with composition. The experimental results are well described by a solid solution-like replacement of Cu and Zr atoms in the composition range between 30 and 70 at% Cu. Therefore, no indication is observed for the existence of phase separation in the supercooled liquid state of the binary Cu-Zr system.
3.2 Nano-phase formation in Cu60Zr40 xTix bulk me-tallic glass
Figure 4 compares the crystallization behavior of the
amorphous Zr60Zr40xTix alloys by their DSC curves. The
crystallization temperature of amorphous Cu60Zr40decreases
0.2 0.6 1.0
0 1 2 3 4 5 6 g CuCu gCuZr g ZrZr
Partial pair correlations
g
ij(
r
)
Interatomic distance,
r
/ nm
0.4 0.8 1.2
Fig. 2 Partial atomic pair correlation functions gijðrÞ of amorphous CuxZr100x
30 40 50 60 70
2 3 4 5 6 7 8 9 10 B E D
Nearest neighbor numbers
N
1
(
ijr
)
Cu content in Cu
x
Zr
100-x, x / at%
Fig. 3 Partial nearest neigbor numbers N1
ij of amorphous CuxZr100x.
[image:2.595.314.541.351.580.2]with Ti content and changes from a single step crystallization into two or three steps for the Ti containing alloys. The
characteristic values of the glass transition temperatures Tg
and crystallization temperatures Tx are summarized in
Table 1. The values are in a good agreement with data given
in Ref. 1), 13). In the case of Cu60Zr40 the orthorhombic
Cu10Zr7 phase is formed with a size of the crystals of about
100 nm. For Cu-Zr-Ti alloys recent studies reported that these BMGs are composites of nanocrystals dispersed in metallic
glass matrix.13–15)X-ray diffraction was discussed to show no
evidence for the presence of crystalline phase.15)On the other
hand, Nagahama et al.16)recently could convincingly show
that depending on the cooling rate fully amorphous or partly
crystallized Cu60Zr30Ti10are prepared.
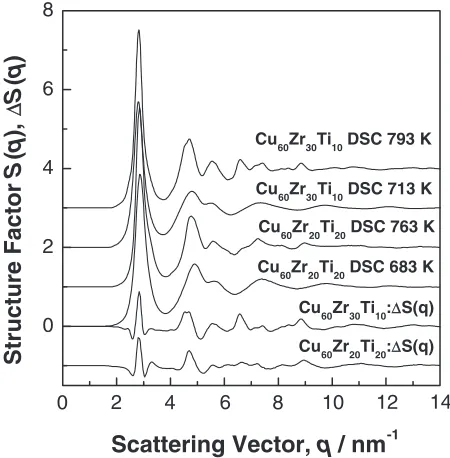
To analyze the structural transition in detail, samples were heated in the DSC to temperatures before and after the first DSC event followed by rapidly cooling down to room temperature (100 K/min). Figure 5 shows the structure factor
SðqÞof annealed amorphous Cu60Zr30Ti10 and Cu60Zr20Ti20
samples. The structure factors of samples annealed up to temperatures before the first DSC event are very similar to those of the as-cast material. After heating up above the first
exothermic peak small differences appear in SðqÞ. The
heights of the first, second and further maxima of the structure factor increase but the diffuse character of the diffraction patterns remains. The difference curves between the structure factors of the samples heated to temperatures
before (T1) and after (T2) of the first DSC event SðqÞ ¼
ST2ðqÞ ST1ðqÞ are also given in Fig. 5. The difference
curves exhibit clearly changes in SðqÞ especially for the
maxima at higher q-values not detectable in standard XRD
measurements.15)
The microstructure of the specimens was analyzed by high-resolution transmission electron microscopy (HREM).
Figure 6 shows TEM image of the Cu60Zr20Ti20 annealed
near Tg at T ¼703K for 25 min. An inhomogeneous
nanostructure is visible indicating the formation of nano-crystals of around 5 nm in size. The image contrast in Fig. 6 indicates that there could be chemical differences between the crystals and the matrix present. X-ray spectroscopy point analysis in scanning transmission operating mode (STEM) with a 1 nm nanobeam gives an increase of the Cu signal, a constant Zr signal and a reduced Ti signal for the nano-crystals in comparison with the surrounding matrix. These findings are in a general agreement with the results of
Nagahamaet al.16)
The atomic pair correlation functionsgðrÞ ¼ðrÞ=0were
calculated to analyse the structural changes in real space.
Figure 7 shows the calculatedgðrÞ curves for Cu60Zr30Ti10
samples annealed at temperatures before and after the first DSC event. Clearly differences in short- and medium-range order are visible. The inter-atomic distances of the first neighborhood are altered in the transformed phase. The correlation length expressed by the extension of the oscil-lation in g(r) becomes larger but does not exceed 3 nm in accordance with the TEM results. The experimental pair correlation functions can be compared with those of known crystalline phases in the Cu-Zr-Ti system. Neither bcc Cu-Zr,
fcc Cu, Cu10Z7nor Cu51Zr14 are able to describe the
short-range order of the experimental curve. A rather good agreement is found with the atomic pair correlation function
of the cubic Laves phase Cu5Zr shown in Fig. 7 which is also
consistent with the results of elemental analysis in the TEM.
Similar agreement is obtained for the Cu60Zr20Ti20 sample
600 650 700 750 800 850
Cu60Zr40 Cu60Zr30Ti10
Normalized Heat Flow (a.u.)
Temperature, T / K
Cu60Zr20Ti20
[image:3.595.58.284.72.294.2]Fig. 4 DSC scan of amorphous Cu60Zr40xTix(40 K/min).
Table 1 Glass transition and crystallization temperatures (onset), mass and atomic density of amorphous Cu60Zr40xTixalloys.
Alloy Tg(K) Tx(K) gcm3 0nm3
Cu60Zr40 719 755 7.53 60.8
Cu60Zr30Ti10 714 750 7.41 61.6 Cu60Zr20Ti20 712 745 7.24 63.5
0 4 8
0 2 4 6 8
Cu60Zr20Ti20:∆S(q) Cu60Zr30Ti10:∆S(q) Cu60Zr30Ti10 DSC 793 K
Cu60Zr20Ti20 DSC 763 K Cu60Zr30Ti10 DSC 713 K
Cu60Zr20Ti20 DSC 683 K
Structure Factor
S
(
q
),
∆
S
(
q
)
Scattering Vector, q / nm
-12 6 10 12 14
Fig. 5 Structure factorSðqÞof amorphous Cu60Zr40xTixannealed before
[image:3.595.314.539.75.304.2] [image:3.595.46.291.369.421.2]annealed above the first DSC peak. The comparison point to the formation of an intermetallic Cu-Zr nanophase as the first step of crystallization.
4. Conclusions
There is no indication of phase separation into two amorphous phases in binary Cu-Zr and ternary Cu-Zr-Ti bulk metallic glasses. Monotonic changes of structural parameters in amorphous Cu-Zr with composition point to a solid solution-like replacement of Cu and Zr atoms. Phase separation in Cu-Zr-Ti bulk metallic glasses is related to the formation of an ultrafine nanostructure by primary crystal-lization.
Acknowledgement
HASYLAB Hamburg is gratefully acknowledged for the support during synchrotron beam time. The authors thank B. Arnold, H. Frey, S. Kuscinsky, D. Lohse, B. Opitz, and A. Oswald for technical assistance.
REFERENCES
1) A. Inoue, W. Zhang, T. Zhang and K. Kurosaka: Acta Mater.49(2001) 2645–2652.
2) M. Chen, A. Inoue, W. Zhang and T. Sakurai: Phys. Rev. Lett.96
(2006) 245502-1–245502-4.
3) J. Das, M. B. Tang, K. B. Kim, R. Theismann, F. Baier, W.H. Wang and J. Eckert: Phys. Rev. Lett.94(2005) 205501–205504.
4) J. Schroers and W. L. Johnson: Phys. Rev. Lett.93(2004) 255506. Fig. 6 TEM image of Zr60Cu20Ti20annealed at 703 K for 25 min.
0.0 0.4 0.8 1.2
-0.2 0.0 0.2 0.4 0.6 0.8
calculated Cu5Zr measured DSC 793 K measured DSC 713 K
Pair Correlation
G
(
r
) = 4
π
r
(
ρ
(
r
)
-ρ 0
)
Interatomic distance,
r
/ nm
0.2 0.6 1.0
[image:4.595.112.485.70.449.2] [image:4.595.56.285.485.716.2]5) K. B. Kim, J. Das, F. Baier, M. B. Tang, W. H. Wang and J. Eckert: Appl. Phys. Lett.88(2006) 051911,1-3.
6) J. Saida, T. Osuna, A. Inoue and M. Onuma: J. Mat. Res.18(2003) 2013–2016.
7) T. W. Barbee, R. G. Walmsley, A. F. Marshall, D. L. Keith and D. A. Stevenson: Appl. Phys. Lett.38(1981) 132–135.
8) R. Bormann: Habilitation Thesis,University Go¨ttingen (1988). 9) C. N. J. Wagner:Liquid Metals, Chemistry and Physics, ed. by S. Z.
Beer (Marcel Dekker Inc., New York, 1972), p. 257. 10) H. S. Chen and Y. Waseda: Phys. Stat. Sol. (a)51(1979) 593. 11) M. Laridjani and J. F. Sadoc: J Non-Cryst. Solids,106(1988) 42.
12) P. Villars and L. D. Calvert:Pearson’s Handbook of Crystallographic Data for Intermetallic Alloys(ASM International, Ohio, 1985). 13) N. Kasai, J. Saida, M. Matsushita, T. Osuna, E. Matsubara and
A. Inoue: J. Phys. Condens Matter14(2002) 13867–13877. 14) Y. Chen, T. Zhang, W. Zhang, D. H. Ping, K. Hono, A. Inoue and
T. Sakurai: Mater. Trans.43(2002) 2647.
15) J. Z. Jiang, J. Saida, H. Kato, T. Ohsuna and A. Inoue: Appl. Phys. Lett.
82(2003) 4041–4043.
16) D. Nagahama, T. Ohkubo, T. Mukai and K. Hono: Mater. Trans.46