http://wrap.warwick.ac.uk/
Original citation:
Bruen, Thomas, Marco, James and Gama, Miguel (2014) Current variation in
parallelized energy storage systems. In: Vehicle Power and Propulsion Conference 2014
(VPPC 2014), Portugal, 27-30 Oct 2014. Published in: Proceedings of the 10th Vehicle
Power and Propulsion Conference 2014 pp. 1-6. (In Press)
Permanent WRAP url:
http://wrap.warwick.ac.uk/64039
Copyright and reuse:
The Warwick Research Archive Portal (WRAP) makes this work of researchers of the
University of Warwick available open access under the following conditions. Copyright ©
and all moral rights to the version of the paper presented here belong to the individual
author(s) and/or other copyright owners. To the extent reasonable and practicable the
material made available in WRAP has been checked for eligibility before being made
available.
Copies of full items can be used for personal research or study, educational, or
not-for-profit purposes without prior permission or charge. Provided that the authors, title and
full bibliographic details are credited, a hyperlink and/or URL is given for the original
metadata page and the content is not changed in any way.
Publisher’s statement:
A note on versions:
The version presented in WRAP is the published version or, version of record, and may
be cited as it appears here.
Current variation in parallelized energy storage
systems
Thomas Bruen, James Marco
International Digital Laboratory WMG, University of Warwick
Coventry, United Kingdom [email protected]
Miguel Gama
Jaguar Land Rover Coventry, United Kingdom [email protected]
Abstract—an electric vehicle battery pack may employ cells connected electrically in parallel to meet energy and power requirements. For the battery management system, cells connected in parallel are often treated as a single larger component. However, research has identified that the state of charge and cell current may not be equal due to differences in capacity, impedance and cell temperature. In this paper, the authors develop a parallel cell model validated against experimental data. The model is used to evaluate cell energy variation and the impact this can have on the design of highly parallelized battery systems.
Keywords—lithium-ion, battery, Battery Management System, BMS, parallel cells, EV, HEV, equivalent circuit model
I. INTRODUCTION
From the perspective of a battery management system (BMS), individual cells connected electrically in parallel are often considered to be one larger capacity cell with a single value of state of charge (SOC) [1], due to the unit operating at one voltage, the individual cell currents not being measured and the tendency for cells in parallel to self-balance over time. However, there will be variations in cell performance caused by two main effects. Differences in cell impedance and energy capacity will cause an unequal current distribution, with different open circuit voltages (OCVs) and impedance values having to resolve current in such a way that the terminal voltage is common for each cell. Secondly, the resistance of the bus bars connecting the cells can create a voltage drop between each parallel loop. Research by [2] showed that cells closest to the current source were prone to higher current flow than those furthest away from the source, resulting in different SOCs over time.
These issues combined present a number of challenges for the BMS. The different capacities and current flows within a parallel unit mean that the SOC of the individual cells may not be equal. A single cell model of the parallel unit will have one SOC, but the relationship of this SOC to the individual cell SOC is not well defined. A single model of parallel cells was developed by [3], but this assumed that the cells were identical which in reality may not be true because of ageing [4] and extrinsic factors such as temperature [5]. Cells may age at different rates specifically because of parallelization, due to the
different current throughput and the resultant temperature gradients. Research by [6] showed that a 20% mismatch of internal resistance in 18650 type lithium ion cells resulted in a 40% reduction in cycle life due to increased capacity fade. Recent work in [7] also suggests that when cells at different levels of ageing are connected in parallel, ageing is accelerated. As cell currents are not monitored, there is a danger of some cells exceeding current limits even though the nominal current (i.e. the applied current divided by the number of cells) is within the manufacturer’s specifications. Similarly, individual cells may go beyond limits on SOC imposed by the BMS to reduce the effects of ageing, leading to the battery pack reaching its end of life prematurely. Finally, due to the passive nature of the electrical interconnection between adjacent cells, there is typically no control over how the applied current is distributed between cells; this may reduce the effectiveness of the balancing system when trying to reduce the voltage or SOC difference between parallel units in series.
In this paper, equivalent circuit models (ECMs) are outlined and a method of combining the ECMs in a parallel configuration is proposed. ECMs are created from experimental data for four cells of the same type but at different states of ageing, allowing for analysis of interaction between cells with different resistance and capacity values, which can occur through factors such as temperature gradients, as well as ageing. Using this model, a dynamic vehicle cycle, and large depth of discharge (DOD) cycle are simulated, and the impact of connection resistance between parallel cells and the case of a cell being disconnected are both evaluated. From this, conclusions can be drawn about the variation in performance that is not seen by a BMS.
II. CELL MODELLING
The ECM for a single cell is presented first, and then extended to a general case of a number of cells in parallel.
A. Single Cell Model
An ECM is commonly used to simulate cells due to their ease of parameterization and real time capability [8]. The model consists of a variable voltage source to represent OCV as a function of SOC, a resistor to capture the DC resistance of the The research presented within this paper is supported by the UK Technology
cell, and a resistor and capacitor connected in parallel (RC pair) to capture dynamics. The number of RC pairs can be increased for improved bandwidth at the expense of increased complexity. The equations that govern the ECM response are given in (1)-(4). Equation (1) governs the response of a single RC pair, and the parameters are a function of SOC. vp is the
polarization voltage over the RC pair, Rp and Cp are the RC
pair resistance and capacitance respectively, RDC is the DC
resistance, vOC is the OCV, icell is the current applied to the
cell, Q is the cell capacity in Ah, nRC is the number of RC
pairs, and vt is the voltage over the cell terminals.
𝑣𝑝̇ = −𝑣𝑝 𝑅𝑝𝐶𝑝
+𝑖𝑐𝑒𝑙𝑙 𝐶𝑝
(1)
𝑆𝑂𝐶̇ = 100 𝑖𝑐𝑒𝑙𝑙 3600𝑄
(2)
𝑣𝑂𝐶= 𝑓(𝑆𝑂𝐶)
(3)
𝑣𝑡= 𝑣𝑂𝐶+ ∑ 𝑣𝑝(𝑛) 𝑛𝑅𝐶
𝑛=1
+ 𝑅𝐷𝐶𝑖𝑐𝑒𝑙𝑙
(4)
B. Parallel Cell Model
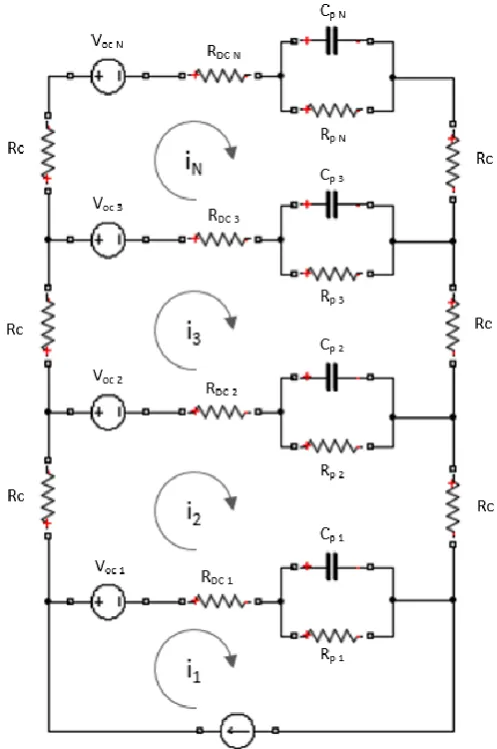
Connecting cells in parallel adds additional constraints to the model: terminal voltage is common to all cells and the cell currents sum up to the source current. This algebraic constraint changes the cell from a system of ODEs to a system of DAEs of index 1. The equations for the system have been derived by using mesh analysis to consider cells connected with (optional) connection resistances, as shown in Figure 1. For brevity the example presented here uses one RC pair, but the solution can be extended to several. This system is now a set of differential-algebraic equations (DAEs).
The equations from section II A still apply, but with the cell current given by (5).
𝑖𝑐𝑒𝑙𝑙 𝑛= 𝑖𝑛− 𝑖𝑛+1; 𝑖𝑐𝑒𝑙𝑙 𝑁= 𝑖𝑁
(5)
The voltages around each loop must sum to zero, as per Kirchoff’s voltage law in (6), where Rc is the inter-cell
connection resistance.
𝑣𝑂𝐶 𝑛− 𝑣𝑂𝐶 𝑛−1+ 𝑣𝑑 𝑛− 𝑣𝑑 𝑛−1+ 𝑅0 𝑛(𝑖𝑛− 𝑖𝑛+1) − 𝑅0 𝑛−1(𝑖𝑛−1− 𝑖𝑛) + 2𝑅𝑐𝑖𝑛= 0
(6)
This can be put into matrix form, as in (7), where A is the system jacobian and B is the input vector. The first loop current i1 is the source current and so is a model input not a state variable.
[ 𝑆𝑂𝐶̇ 1
𝑣𝑝 1̇ 0 𝑆𝑂𝐶̇ 2
⋮ 0 𝑆𝑂𝐶̇ 𝑁
𝑣𝑝 𝑁̇ ] = [𝑨]
[ 𝑆𝑂𝐶1
𝑣𝑝 1 𝑖2 𝑆𝑂𝐶2
⋮ 𝑖𝑁 𝑆𝑂𝐶𝑁
𝑣𝑝 𝑁] + [𝑩]𝑖1
(7)
[image:3.595.307.556.53.428.2]This has been solved using the ode15s variable-step solver in MATLAB.
Figure 1: Schematic of parallel connected cells
III. CELL DATA GENERATION
Experimental data were collected for four 3Ah 18650-type lithium ion cells, and used to parameterize the ECMs.
A. Ageing
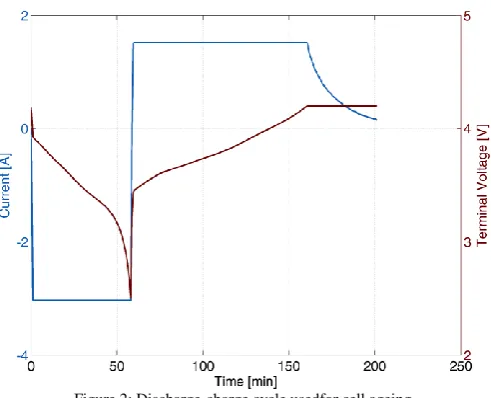
The cells were aged by different amounts in order to better observe interactions between cell impedance and capacity. The ageing profile is shown in Figure 2 and involved repeated cycles of the following: a 1C discharge until the lower voltage limit was reached followed by CC-CV charging at C/2 to the upper cell voltage limit, with a C/20 cut-off current.
[image:3.595.96.220.599.693.2]Figure 2: Discharge-charge cycle usedfor cell ageing
TABLE I. SUMMARY OF EIS RESULTS AT 50% SOC
Cell Crossing
Frequency (Hz)
DC Resistance
(mΩ)
Turning Frequency
(Hz)
Diffusive Resistance
(mΩ)
0 Ageing Cycles
611.6 31.52 0.398 46.32
50 Ageing Cycles
496.4 32.27 0.200 51.17
100 Ageing Cycles
502.0 32.62 0.126 58.20
150 Ageing Cycles
511.3 32.97 0.100 63.13
Four cells in Parallel
353.2 8.33 0.158 13.64
B. Characterization
[image:4.595.329.561.505.700.2]Characterization tests were performed to evaluate their performance and to create an ECM. To simplify the analysis, all tests were performed at 25°C to remove the effect of temperature on ECM parameters.Cell capacity was measured at 1C, and a pseudo OCV-SOC curve obtained by discharging the cell at C/25.
Figure 3: Nyquist plot of impedance for differentially aged cells
Cell dynamics were evaluated using a pulse power profile of 10s current followed by 5 minutes resting, and EIS tests. Figure 4 shows how the diffusive resistance for each cell varies as a function of SOC. For this particular cell, there was little change in DC resistance with SOC.
The cells were characterized in series and parallel. The impedance of the individual cells can be parallelized and compared to the physically connected cell, using (8), where Z is the impedance and N the number of cells in parallel.
𝑍 = 1
∑ 𝑍1 𝑛 𝑁 𝑛=1
(8)
The results show that the physically connected cell has a slightly higher resistance, which may be due to increased connection resistance in the experimental setup. However, there does not appear to be any significant interaction between the cells that cannot be captured using single cell models connected in parallel.
Figure 4: Variation in diffusive resistance with SOC
[image:4.595.42.282.510.699.2]IV. MODEL FITTING
A nonlinear least squares (NLS) optimizationwas used to fit an equivalent circuit model, with the cost function vector to minimize given in (9), where vexp and vECM are the
experimental and simulated voltage respectively. The optimization was constrained to prevent negative parameter values and time constants less than the sampling time of the data (10ms).
min ‖𝑣𝑒𝑥𝑝− 𝑣𝐸𝐶𝑀‖2
2 (9)
Figure 6 shows an example of a fit which had an RMS error of 0.61mV and a peak error of 6.6mV. To capture the wide range of responses that can occur between cells in parallel, three RC pairs were used in the model, with time constants of approximately 0.1s, 5s and 60s respectively.
V. RESULTS
Two drive cycles have been considered for this analysis: a dynamic current profile, typical of a hybrid electric vehicle, and a charge-discharge cycle which is more relevant to a battery electric vehicle. Cell connection resistance is ignored for the drive cycle analysis, and discussed separately.
A. Dynamic Current Profile
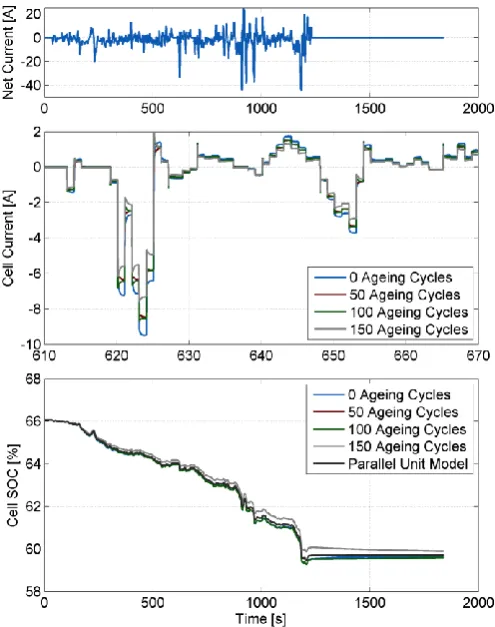
[image:5.595.308.556.54.368.2]A drive cycle, representative of a hybrid electric vehicle (HEV) current was simulated using the parallel cell model and the single ECM of the parallel unit. The applied current, cell current (zoomed into a 60s region for clarity) and SOC are shown in Figure 7. As can be seen there is little variation in SOC- a maximum of 0.6% between the cells. The cell currents converged to a steady state in approximately 0.5s after a step change in applied current, suggesting that only the 0.1s time constant was excited. In this steady condition, the DC resistance is the main factor in determining the current through each cell. As a result, the least and most aged cells had a normalized charge throughput of 28% and 22%respectively.
Figure 6: Experimental and simulated voltage response to pulse current
Figure 7: Dynamic drive cycle simulation results
B. Large Depth of Discharge
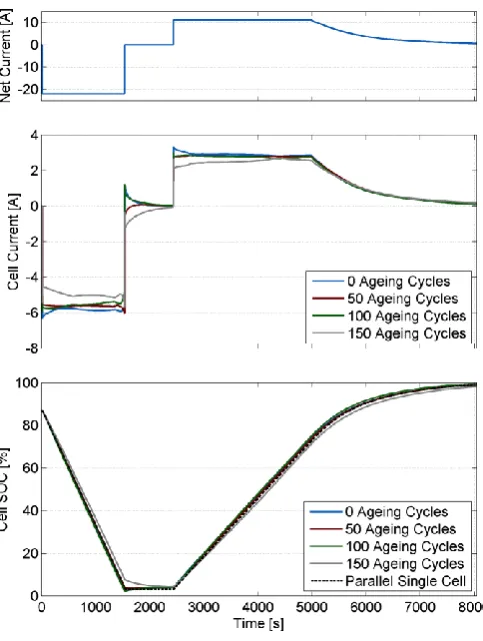
Unlike HEVs, battery electric vehicles (BEVs) are more likely to cover a large DOD. A simulation of a 2C discharge to the lower voltage limit, followed by a 1C CC-CV charge, was run for both the parallel and single ECM models, with the applied current, cell current and SOC shown in Figure 8. The proportion of charge throughput taken by each cell was more equal than for the dynamic drive cycle, with the least and most aged cells taking 26.5% and 23.5% respectively. However, at the end of discharge the most aged cell had a SOC 5.7% higher than the least aged cell, with the self-balancing of the cells reducing this to under 0.3% after a 15 minute rest period. BMSs may impose limits on upper and lower SOC in order to increase the life of the cell. These results show that it is possible for some individual cells to go outside of this range even though the parallel cell model shows that the parallel unit as a whole is within the limits, potentially decreasing the lifespan of the pack.
OCV also has a significant impact on the performance of the cells for high DOD operation. Under steady state conditions the current through a cell is given by (10).
𝑖𝑐𝑒𝑙𝑙 =
𝑉𝑡− 𝑉𝑂𝐶 𝑅𝐷𝐶
[image:5.595.39.294.485.684.2]Figure 8: Large DOD simulation results
The OCV curve for this cell is highly nonlinear below 15% SOC. For the discharging case, the OCVs of the more discharged cells becomes closer to the terminal voltage meaning less current is required through the resistor to ensure a common terminal voltage. Cells with a higher OCV must take more of the current until their OCVs also drop.
C. Connection Resistance
Cells in parallel are typically connected together using a high conductivity material such as aluminium [2]. This will create a small additional resistance to the complete parallel assembly. For many cells connected in a ‘ladder’ formation such as in Figure 1, the effect of these resistances becomes significant. Figure 9 shows a 60 second snapshot of the cell currents from the dynamic drive cycle for a model of 70 cells in parallel with identical ECM parameters, but a connection resistance of 10µΩ between each cell. The cells closest to the current source (the blue lines on Figure 9) undergo consistently higher loading. This is quantified in Figure 10, which shows the total absolute charge throughput for each cell. The cell nearest to the current source had a 140% charge throughput relative to nominal (the case of no connection resistance), whereas the furthest cell had 85% of the nominal charge throughput. Arguably this significantly higher loading near the current source will cause increased ageing of those cells[4], and may increase demand on the thermal management system due to increase ohmic heating.
[image:6.595.41.283.54.375.2]Figure 9: Cell current during drive cycle, with connection resistance
Figure 10: Relative charge throughput of cells in parallel
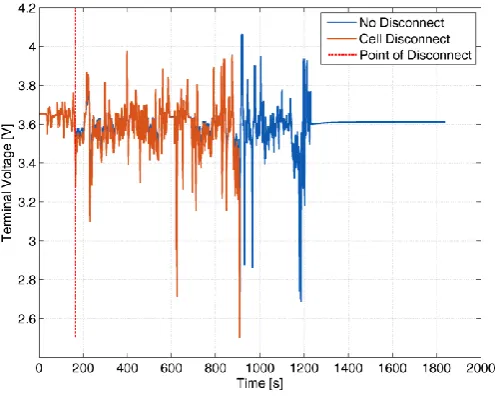
D. Cell Disconnection
[image:6.595.307.559.57.450.2] [image:6.595.308.556.256.450.2]Figure 11: Terminal voltage over a dynamic drive cycle with a disconnected cell
VI. CONCLUSIONS
All of the scenarios assessed in this paper show that cells with different resistances and capacities connected in parallel can undergo significantly different currents. As a BMS does not monitor current within parallel units, some cells may be taken above their intended operating current, or be aged more quickly due to increased charge throughput and ohmic heat generation, shortening the lifespan of the pack. Similarly, a cell losing electrical contact with the battery pack could cause the BMS to overestimate the SOC of the pack, leading to the driver being misled about the available range of the vehicle. A typical HEV drive cycle does not appear to cause a significant amount of SOC variation between cells in parallel due to its dynamic nature. However, steady currents and drive cycles which cover a large DOD, where cells can enter the nonlinear region of the OCV-SOC curve, can cause significant variation and give rise to cases where higher resistance cells can take larger currents. These effects, combined with the cumulative impact of cell connection resistance, can lead to premature ageing of some cells, weakening the pack as a whole. Variation in current can also cause uneven heat generation within a pack which may require a more advanced thermal management system.
ACKNOWLEDGMENTS
The authors would like to thank Neelu Kumari, Dhammika Widanalage and Gael Chouchelamane for their assistance with cell characterization.
REFERENCES
[1] L. Lu, X. Han, J. Li, J. Hua, and M. Ouyang, “A review on the key issues for lithium-ion battery management in electric vehicles,” J. Power Sources, vol. 226, no. 0, pp. 272–288, 2013.
[2] G. J. Offer, V. Yufit, D. A. Howey, B. Wu, and N. P. Brandon, “Module design and fault diagnosis in electric vehicle batteries,” J. Power Sources, vol. 206, no. 0, pp. 383–392, May 2012.
[3] J. Kim and B. H. Cho, “Screening process-based modeling of the multi-cell battery string in series and parallel connections for high accuracy state-of-charge estimation,” Energy, vol. 57, no. 0, pp. 581–599, Aug. 2013.
[4] A. Barré, B. Deguilhem, S. Grolleau, M. Gérard, F. Suard, and D. Riu, “A review on lithium-ion battery ageing mechanisms and estimations for automotive applications,” J. Power Sources, vol. 241, no. 0, pp. 680–689, 2013.
[5] J. Gomez, R. Nelson, E. E. Kalu, M. H.
Weatherspoon, and J. P. Zheng, “Equivalent circuit model parameters of a high-power Li-ion battery: Thermal and state of charge effects,” J. Power Sources, vol. 196, no. 10, pp. 4826–4831, 2011.
[6] R. Gogoana, M. B. Pinson, M. Z. Bazant, and S. E. Sarma, “Internal Resistance Matching for Parallel-Connected Lithium-Ion Cells and Impacts on Battery Pack Cycle Life,” J. Power Sources, vol. 252, no. 0.
[7] X. Gong, R. Xiong, and C. C. Mi, “Study of the characteristics of battery packs in electric vehicles with parallel-connected lithium-ion battery cells,”
Applied Power Electronics Conference and Exposition (APEC), 2014 Twenty-Ninth Annual IEEE. pp. 3218– 3224, 2014.
[8] X. Hu, S. Li, and H. Peng, “A comparative study of equivalent circuit models for Li-ion batteries,” J. Power Sources, vol. 198, pp. 359–367, Jan. 2012.
[9] A. Jossen, “Fundamentals of battery dynamics,” J. Power Sources, vol. 154, no. 2, pp. 530–538, Mar. 2006.
[10] M. a. Roscher, R. M. Kuhn, and H. Döring, “Error detection for PHEV, BEV and stationary battery systems,” Control Eng. Pract., vol. 21, no. 11, pp. 1481–1487, Nov. 2013.