warwick.ac.uk/lib-publications
Original citation:
Andersson, Robert, Jirstrand, Mats, Peletier, Lambertus, Chappell, M. J. (Michael J.), Evans,
Neil D. and Gabrielsson, Johan. (2016) Dose–response-time modelling : second-generation
turnover model with integral feedback control. European Journal of Pharmaceutical
Sciences, 81 . pp. 189-200.
Permanent WRAP URL:
http://wrap.warwick.ac.uk/97880
Copyright and reuse:
The Warwick Research Archive Portal (WRAP) makes this work by researchers of the
University of Warwick available open access under the following conditions. Copyright ©
and all moral rights to the version of the paper presented here belong to the individual
author(s) and/or other copyright owners. To the extent reasonable and practicable the
material made available in WRAP has been checked for eligibility before being made
available.
Copies of full items can be used for personal research or study, educational, or not-for-profit
purposes without prior permission or charge. Provided that the authors, title and full
bibliographic details are credited, a hyperlink and/or URL is given for the original metadata
page and the content is not changed in any way.
Publisher’s statement:
© 2015. This manuscript version is made available under the CC-BY-NC-ND 4.0 license
http://creativecommons.org/licenses/by-nc-nd/4.0/
A note on versions:
The version presented here may differ from the published version or, version of record, if
you wish to cite this item you are advised to consult the publisher’s version. Please see the
‘permanent WRAP URL’ above for details on accessing the published version and note that
access may require a subscription.
Dose-response-time modelling: Second-generation
turnover model with integral feedback control
Robert Anderssona,∗, Mats Jirstrandb, Lambertus Peletierc, Michael J.
Chappella, Neil D. Evansa, Johan Gabrielssond
aSchool of Engineering, University of Warwick, Coventry, United Kingdom bFraunhofer-Chalmers Centre, Chalmers Science Park, Göteborg, Sweden
cMathematical Institute, Leiden University, Leiden, The Netherlands dDivision of Pharmacology and Toxicology, Department of Biomedical Sciences and
Veterinary Public Health, Swedish University of Agriculture Sciences, Uppsala, Sweden
Abstract
This study presents a dose-response-time (DRT) analysis based on a large pre-clinical biomarker dataset on the interaction between nicotinic acid (NiAc) and free fatty acids (FFA). Data were collected from studies that examined dierent rates, routes, and modes of NiAc provocations on the FFA time course. All in-formation regarding the exposure to NiAc was excluded in order to demonstrate the utility of a DRT model. Special emphasis was placed on the selection
pro-cess of the biophase model. An inhibitoryImax-model, driven by the biophase
amount, acted on the turnover rate of FFA. A second generation NiAc/FFA model, which encompasses integral (slow buildup of tolerance - an extension of the previously used NiAc/FFA turnover models) and moderator (rapid and oscillatory) feedback control, was simultaneously tted to all time courses in normal rats. The integral feedback control managed to capture an observed
90% adaptation (i.e., almost a full return to baseline) when 10 days
constant-rate infusion protocols of NiAc were used. The half-life of the adaptation process
had a90%prediction interval between3.5-12 hin the present population. The
pharmacodynamic parameter estimates were highly consistent when compared to an exposure-driven analysis, partly validating the DRT modelling approach and suggesting the potential of DRT analysis in areas where exposure data are not attainable. Finally, new numerical algorithms, which rely on sensitivity equations to robustly and eciently compute the gradients in the parameter optimization, were successfully used for the mixed-eects approach in the pa-rameter estimation.
Keywords: Biophase models, Turnover, Tolerance, Feedback control, Nicotinic acid (NiAc), Free fatty acids (FFA)
∗Corresponding author
1. Introduction
The traditional pharmacokinetic-pharmacodynamic (PK-PD) modelling ap-proach is generally based on known plasma kinetics when the PD properties are assessed. Dose-response-time (DRT) data analysis is an alternative to exposure-driven kinetic - dynamic modelling when exposure data are sparse or lacking. 5
This involves studies where the pharmacological response precedes the systemic exposure (e.g. pulmonary drug administration) or when the drug is locally ad-ministered (e.g. in ophthalmics). In DRT analyses the pharmacological eect is assumed to contain some kinetic properties whereby a biophase function can be developed and in turn acts as a `driving' function of the pharmacological ef-10
fect. The biophase function is assessed using various structures from a biophase model library when the DRT model is tted to data. This biophase library consists of feasible models derived from the kinetic information in the response-time course in combination with knowledge of the physiology.
DRT data analysis dates back to the 1960's and 1970's when Smolen [53, 15
54, 55] and Levy [39] introduced the concept. Smolen used response data to quantify the bioavailability and biokinetic behaviour of a mydriatic drug after oral and ophthalmic administration whilst Levy derived a relation between the pharmacological eect and elimination rate of a mydriatic drug. Since the work of Smolen, DRT data analysis has been proven to be applicable to novel sys-20
tems where the kinetics and/or dynamics behave non-linearly, when there are time-delays in the response data, and when the system contains feedback mech-anisms [24]. The technique has successfully been applied in models of the muscle relaxant drug vecuronium [14, 22, 21, 64], antinociceptive drugs [1, 26, 24], oph-thalmic drugs [24, 41], antidepressants [28], psycho-motor stimulants [26], drugs 25
to treat chronic obstructive pulmonary disease (COPD) [65], and osteoporosis [46]. For a review and theoretical guide to DRT analysis see Gabrielsson et al. [24, 26]. DRT models go under the name of K-PD (K for kinetic) models in some analyses [28, 29, 35, 46, 65]. However, in the latter case the biophase turnover rate, rather than the biophase amount, is driving the response. 30
NiAc has long been used as a therapeutic agent to treat dyslipidemia. The drug eectively suppresses the level of triglycerides and low-density lipopro-tein cholesterols in plasma whilst elevating the level of high-density lipoprolipopro-tein cholesterol [16]. NiAc inhibits hydrolysis in adipose tissue by activating the G-coupled receptor GPR109A, which in turn inhibits the adenylyl cyclase, leading 35
to reduced levels of cyclic adenosine monophosphate (cAMP). The cAMP ac-tivates the enzyme protein kinase A which phosphorylates hormone-sensitive lipase that in turn hydrolyses triglycerides into FFA (Fig. 1) [44].
We sought to further demonstrate the utility of DRT data analysis. To do so, we analysed a rich preclinical data set containing several individuals (a total 40
Gi
cAMP
PKA
HSL ATP
AC
TG
FFA
Adipocyte
GPR109A (HM74A/PUMA-G)
[image:4.612.177.399.160.388.2]
-FFA Nicotinic acid
Figure 1: Mechanism of NiAc-induced inhibition of lipolysis. NiAc activates the G-coupled receptor GPR109A, which in turn inhibits the adenylyl cyclase, reducing the production of cyclic adenosine monophosphate (cAMP) from adenosine triphosphate. cAMP activates pro-tein kinase A, which phosphorylates hormone-sensitive lipase, thereby regulating the hydroly-sis of triglycerides into FFA. Thus, NiAc binding will inhibit lipolyhydroly-sis leading to reduced levels of FFA. Adapted from Oermanns 2006 [44].
exposure-driven kinetic/dynamic results, where the pharmacokinetic properties of NiAc had been thoroughly characterized [3].
The applied pharmacodynamic model is an extended and signicantly im-proved version of a previously utilised feedback model [2, 4, 6, 25, 59]. This second-generation feedback model uses an integral feedback control mechanism 50
to capture the slowly developing tolerance. This model is aected by a biophase model that drives the inhibitory drug-mechanism function. The biophase model was selected using an iterative modelling approach where the biophase model was systemically rened in order to better capture the dynamic behaviour seen in the data. This study presents an approach to the development of the bio-55
2. Materials and methods 2.1. Background and data sources 60
The pre-clinical data set consisted of FFA response-time series of 95 male Sprague-Dawley rats under NiAc provocation. These data have previously been described by Ahlström et al. [3, 5, 7, 4, 6, 33] and Tapani et al. [59]. A thor-ough description of the animals and surgical procedure, experimental design, and analytical assay can be found in Ahlström et al. [4].
65
All experiments were designed and conducted at AstraZeneca, Mölndal Swe-den, and approved by the Ethics Committee for Animal Experiments, Gothen-burg, Sweden (EA 100868).
2.2. Selection process of biophase models
The DRT data analysis is based on the assumption that the pharmacological 70
response contains some kind of kinetic information and is driven by NiAc in a hypothetical biophase compartment. The t of the pharmacodynamic model (given in Sec. 2.4) to the data informs about the soundness of choice of the driving biophase function. Depending on the route of administration, the input is either approximated to be directly into the biophase (intravenous dosing) 75
or absorbed into the biophase (oral dosing). The biophase model structures were modied through a series of steps where data from dierent routes and rates of administration were sequentially assessed (see Table 1). In a pair-wise accept-reject procedure, two models were qualitatively and quantitatively compared and the one considered to be the better model, in terms of goodness-80
of-t, was selected and further challenged by more complex data (see Table 1). The goodness-of-t was based on the likelihood function value and by graphical inspection of the function plots.
Step I. The rst biophase model that was evaluated consisted of a zero-order input into and rst-order elimination from the biophase (Fig. 2b). To capture 85
the disposition characteristics, the model was evaluated using response-time data derived from dierent constant-rate intravenous infusion experiments.
Step II. The next biophase model to be evaluated consisted of zero-order input and Michaelis-Menten elimination from the biophase (Fig 2c). This model was evaluated using the same data as in step I.
90
The model that best described (in terms of goodness-of-t) the dynamics, using the response-time data derived from dierent constant-rate intravenous infusion experiments, was kept for the later stages of the biophase evolution. In this case, the models used in step I and II had close to similar objective func-tion values and were indistinguishable by graphical inspecfunc-tion of the funcfunc-tion 95
Step III. When a model for the biophase elimination model was set, response-time data derived from experiments for dierent oral dosages were included 100
in order to address the biophase absorption. The rst biophase absorption model that was evaluated consisted of rst-order input and elimination from the biophase (Fig. 2d).
Step IV. The nal absorption model that was evaluated consisted of Michaelis-Menten input and rst-order elimination (Fig 2e). This model was evaluated 105
using the same data as in step III.
The model in step IV had a higher likelihood function value and a substan-tially better t when inspecting the function plots than the model in step III, and was therefore selected.
2.3. The nal biophase model 110
The biophase was modelled as
dAb
dt =Inf−k·Ab, (1)
for intravenous administration of NiAc, with initial condition
Ab(0) = 0 (2)
where Ab denotes the biophase drug amount, k the biophase elimination rate
constant, and Inf the infusion rate to the biophase. The infusion rate was mod-elled as a step function with either constant rate during the infusion period, or 115
stepwise decreasing infusion rates, to mimic the infusion regimens used in the experiments.
Orally administered NiAc was assumed to be eliminated from the gut ac-cording to a Michaelis-Menten type of saturable process
dAg
dt =−
Vmax,g·Ag
Km,g+Ag
(3)
with initial condition 120
Ag(0) =D (4)
whereAgdenotes the amount of drug in the gut,Vmax,gthe maximal elimination
rate from the gut,Km,gthe Michaelis-Menten constant (representing the amount
in the gut at half maximal rate), andD the oral drug dose. The drug amount
that is eliminated from the gastro-intestinal tract is absorbed into the biophase, giving the biophase equation
125
dAb
dt =
Vmax,g·Ag
Km,g+Ag
−k·Ab (5)
with initial condition
whereAbdenotes the biohase drug amount andkthe biophase elimination rate
constant.
2.4. Structure of the FFA feedback model
The fundamental dynamics of FFA are described in terms of a turnover 130
equation
dR
dt =ekin−ekout·R (7)
where R denotes the FFA level, andekin andekout are functions describing the
lumped eects of NiAc, and insulin and other hormones, on the turnover and fractional turnover of FFA, respectively. The NiAc-induced action on FFA is described by means of an inhibitory drug mechanism function given by
135
I(Ab) = 1−
Imax·Aγb
IDγ
50+A
γ
b
(8)
where Ab denotes the biophase drug amount, Imax the ecacy, ID50 the
po-tency, andγthe Hill exponent.
The FFA level in the model is aected by a chain of moderator
compart-mentsM1, . . . , M8. These moderator compartments represent a conglomerate
of insulin, and other hormonal, regulators of the FFA disposition. Insulin, for 140
example, acts as a dual regulator on the FFA level via rapid inhibition of the lipolysis and slow re-esterication of FFA to triglycerides [23, 50, 58]. This
is captured by the dynamics of the rstM1 and the last M8 moderator
com-partment, respectively. The moderators are described by the following set of equations
145
dM1
dt =ktol·(R−M1) dM2
dt =ktol·(M1−M2) (9)
...
dM8
dt =ktol·(M7−M8)
where R denotes the FFA level and ktol the fractional turnover rate of the
moderators. Consequently, all moderator compartments have the same transit
time of1/ktol. The moderators are initially assumed to be in equilibrium with
the response, thus
M1(0) =. . .=M8(0) =R0 (10)
where R0 is the FFA baseline level. The number of moderator compartments
150
selected was previously discussed by Ahlström et al. [7].
of the insulin and β-adrenergic pathways in adipose tissue [32]. Insulin
resis-tance ultimately leads to full systemic adaptation with a FFA level that returns 155
to its baseline within a few days [37, 45]. This slow and complete adaptation is
captured by an integral feedback controller, with outputu(t), that slowly forces
deviating FFA levels back towards their baselineR0 despite persistent
pertur-bations such as constant rate infusion of NiAc. The integral controller is given by
160
u(t) =Ki
t Z
0
1−R(τ)
R0
dτ (11)
whereKidenotes the integral gain parameter (here-after referred to as the
adap-tation rate). The integral controller may also be expressed as a rate equation
du dt =Ki·
1−R(t)
R0
(12)
with initial condition
u(0) = 0. (13)
The expanded turnover equation of FFA under NiAc provocation is given by 165
dR
dt =kin·(1 +u(t))· 1
M1 R0
p ·I(Ab)
−kout·
M8
R0
·R (14)
with initial condition
R(0) =R0 (15)
whereRdenotes the FFA level,kinthe basal turnover rate,kout the basal
frac-tional turnover rate, R0 the baseline of response, u(t) the integral controller,
p the amplication factor, and M1 and M8 the rst and last moderator,
re-spectively. The moderators are normalized in the turnover Eq. 14 with the 170
baseline FFA value R0. The levels of the moderators follow the level of the
FFA according to Eq. 9. In turn, the rst moderatorM1modies the turnover
ratekin, amplied with the exponentp, whilst the last moderatorM8 modies
the fractional turnover ratekout. These feedback mechanisms represent the fast
inhibition of lipolysis and the slower re-esterication of FFA to triglycerides, 175
triggered by insulin and other hormones, that strive to dampen uctuations in the FFA level. Furthermore, when the FFA level drops below the baseline level, the integral controller, given by Eq. 11, will accumulate and provide a
positive contribution to the turnover ratekin of FFA. Similarly, when the FFA
level increases and rises above the baseline level, the integral controller will ac-180
2.5. Initial parameter estimates
At time zero, before administration of NiAc, the system is in steady-state,
with the moderators set atR0. Consequently, the turnover equation (Eq. 14)
185
pre-NiAc administration is given by
dR
dt =kin−kout·R0= 0. (16)
A simple rearrangement gives the relation
R0=
kin
kout (17)
and hence the system may be simplied with one of the parametersR0,kin, or
kout removed in the parameter estimation. In this study,kinwas estimated as a
secondary parameter from the product ofR0 andkout. The initial estimate of
190
the FFA baseline levelR0 was taken as the mean response at time zero.
Since the minimum FFA level is close to zero, initially for high NiAc dosages,
we conclude that NiAc has a high ecacy and thatImax is close to 1.
Further-more, for high NiAc infusion rates, the inhibitory drug-mechanism function becomes saturated whilst the moderators are initially in steady-state with the 195
response. Using this, and the initiate estimate ofImax Eq. 14 can be
approxi-mated as
dR
dt ≈ −kout·R (18)
or
R(t)∼=R0e−koutt. (19)
By means of this relation,kout can be estimated from the initial down-swing of
the response on a semi-logarithmic scale. 200
The Hill exponent γ and the amplication factor p were initially set to 1
since little was known about the respective parameter values. The remaining parameters were estimated from simulations of the system.
2.6. Modelling random eects and residual variability
The extent of the data set allowed for mixed-eects to be included in the 205
model, i.e., specic parameter values were allowed to vary within the population. To identify which parameters had a signicant spread in the population, individ-ual parameter tting was applied. The ve parameters with highest variability, in terms of coecient of variation, were then selected as individual parameters; the rest were considered as population parameters. The parameters chosen to 210
vary in the population werek,Ki,R0,kout, andktol. These parameters were
as-sumed to be uncorrelated (to simplify the model) and log-normally distributed (to keep the parameters positive).
The individual parameter estimates are referred to as Empirical Bayes Estimates (EBE's) and their individual ts and the model assumptions were quantied by 215
2.7. Parameter estimation
The parameter estimation of the DRT model in this study was performed using a mixed-eects modelling framework implemented in Mathematica, devel-oped at the Fraunhofer-Chalmers Research Centre for Industrial Mathematics 220
(Gothenburg, Sweden) [9]. This framework is designed to estimate parameters in non-linear mixed eects models where the underlying dynamical system is either described by a set of ordinary or stochastic dierential equations. The framework relies on the rst-order conditional estimation (FOCE) [38], with or without interactions, to estimate the individual likelihoods of the population 225
likelihood function. The argument that maximises the population likelihood function is found using the BroydenFletcherGoldfarbShanno algorithm [43] where the gradient of the objective function is calculated using the so-called sensitivity equations.
3. Results 230
Observed response-time series with corresponding population model ts and
90% Monte Carlo prediction intervals [49] are illustrated in Fig. 4. The FFA
concentrations were suppressed in all animals receiving NiAc. A clear adapta-tion towards the FFA baseline was only seen for the individuals that received a
300 minconstant rate infusion of NiAc (Fig. 4d-4f). This functional adaptation 235
was more pronounced the higher the infusion rate. All infusion regimens gave rise to a rebound eect, i.e., the FFA level overshoots the initial baseline, after the infusions were stopped. The rebound eect was more pronounced the higher the infusion rate. This eect was followed by apparent oscillations in the FFA level around the baseline, which were more pronounced with the extended NiAc 240
infusion regimens (longer duration of the infusions and higher NiAc doses). The rats that received an oral dose of NiAc experienced an FFA drop followed by an approximately constant FFA level (Fig. 4i-4k). The higher the dose, the longer the rats stayed at a suppressed and approximately constant FFA level. This was followed by rebound and oscillations. The suppression of FFA, the occurrence 245
of rebound, and the extent of the oscillations were more pronounced the higher the oral dose.
The estimated population biophase amount-time courses are illustrated in Fig. 5. For the constant rate NiAc infusions, the biophase amount quickly reached steady-state (Fig. 5a-5f). The wash-out kinetics were rapid with a half-250
life of around2 min. For the highest oral doses, the biophase amount declined
in a non-linear fashion post-peak due to absorption-rate limited elimination of NiAc (Fig. 5k).
Observed individual FFA response-time series with individually tted FFA response levels are illustrated in Fig. 6 for one individual per administration 255
route and rate. The model captured the individual behaviour for all
individu-als. Specically, the slow adaptation, in the individuals that received a300-min
The tted population parameters and inter-individual variations with cor-260
responding relative standard errors for the full system are illustrated in Table
2. The biophase elimination rate constantkand the fractional turnover rate of
FFAkout are of the same order of magnitude, indicating little to no time-delay
between biophase kinetics and FFA dynamics. Since the absorption into the biophase is non-linear, we observed typical absorption-rate limited elimination 265
at higher oral doses of NiAc. The estimatedKm,gof about40µmol kg−1implies
that the two higher oral doses (81.2 and812µmol kg−1) approach and exceed
saturation.
The ecacy parameter Imax was estimated as 0.893 < 1; therefore, NiAc
cannot completely suppress FFA levels. The estimated biophase potency ID50
270
shows that the drug-mechanism function (Eq. 8) will be saturated at the highest
infusions and for all the oral doses (Fig. 5). The estimated Hill exponentγ
indi-cates a steep NiAc biophase amount - FFA response relationship at equilibrium.
The rate constantskout,ktol, andKi all have dierent orders of magnitude, and
thus act over dierent time-scales. Half-lives for the three rate constants with 275
90%non-parametric bootstrap prediction intervals [18] are given in Table 3.
The pivotal systems (kout, ktol, Ki, p) and drug parameters (Imax, γ) were
compared to estimates from an exposure-driven analysis, using the same dy-namic model. The estimates are given in Table 4.
3.1. Model predictions 280
By using the predicted population parameters, we explored the long-term
ef-fects of NiAc provocation on FFA level for the infusion rate of0.17µmol kg−1min−1
(Fig. 7), aiming at a therapeutic plasma concentration of NiAc of1µmol [4].
The model predicted90%adaptation within approximately 10 days of constant
NiAc exposure. The eect of the fast moderator (M1) feedback can be seen
im-285
mediately after the initial drop, where the system rapidly returns towards the
baseline. The eect of the slower moderator feedback (M8) is seen as a slower
terminal return with oscillations in the FFA level. The eect of the integral feedback controller is seen as the slow return to baseline over time.
3.2. Structural identiability 290
The model structure was proven to be structurally locally identiable. Iden-tiability was tested using the Exact Arithmetic Rank (EAR) approach [11, 36, 48]. This approach requires that the functions in the system of dierential equations are rational polynomial expressions in the variables and parameters. In this study, the inhibitory drug-mechanism function and the feedback func-295
tion of the rst moderator compartment did not full this requirement since
the state variables were raised to the powers of γ and p, respectively (which
are real-valued). However, this problem is solved by re-writing the system in rational form by the introduction of auxiliary variables [40]. For example, let
B(t) =Aγb(t) (20)
B(0) =B0(=A
γ
Then we have that 300
dB dt =γ
B(t) Ab(t)
·dAb
dt , (22)
and by introducing the parameter IDf50(=IDγ50) the non-rational functions in
the inhibitory drug-mechanism function can be written as
1− Imax·B(t)
f
ID50+B(t)
(23)
which is a rational expression of the parameters and the variables.
3.3. Shrinkage analysis
Shrinkage analysis was used in order to quantify the individual parameter 305
assumptions (log-normality) and to quantify the model ts [51]. Theη-shrinkage
of the EBE's are given in Table 2. The standard deviation of the residual
additive error and the ε-shrinkage for the infusion and oral data are given in
Table 5.
4. Discussion 310
DRT data analysis has previously proved to be an alternative approach to exposure-driven modelling when exposure data are sparse or absent [14, 22, 21, 24, 26, 35, 41, 64, 65]. The technique has been applied in studies of novel systems where the pharmacodynamic response behaves non-linearly, where time-lags are present, and when functional adaptation is manifested [24]. These examples 315
demonstrate the potential of DRT modelling in characterizing mechanisms of action of complex pharmacological systems. The present study extends the util-ity of a non-linear biophase model, permitting the description of more complex absorption kinetics. The non-invasiveness of DRT analysis promotes its use when excessive sampling is prohibited (small animals, paedriatic populations) 320
[60].
4.1. DRT modelling
DRT data analysis typically requires response-time series with higher resolu-tion than tradiresolu-tional tradiresolu-tional exposure-driven studies. This is because kinetic information in response-time data are sought for the biophase turnover. 325
In contrast to exposure-driven pharmacodynamic modelling, the biophase kinetics and the pharmacodynamic properties of a DRT model must be esti-mated simultaneously. This may in some instances lead to diculties in sepa-rating confounding factors originating from either the concentration-time or the response-time course or both. If, for example, drug absorption and disposition 330
4.2. Strategy when selecting the biophase model
The structure of the biophase model is preferably derived through a series 335
of steps where data from dierent administration routes are sequentially imple-mented and the biophase is structure rened if necessary. In this way, dierent properties, for example elimination rate and absorption rate, can be addressed separately.
In this study, the intravenous data were initially analysed in order to ad-340
dress the biophase disposition. Both a linear rst-order and a Michaelis-Menten elimination model were successfully tted to the data. The two models had ap-proximately the same objective function values and tted the data equally well when the function plots were inspected graphically. However, when the AIC was applied, the simpler model was preferred, and therefore selected. The sim-345
ilarity between the linear rst-order and Michaelis-Menten elimination models was due to the high estimate of the Michaelis-Menten constant, in comparison to the biophase amounts, rendering an approximately linear elimination rate at all dose levels.
When the disposition model was set, oral data were included and the absorp-350
tion process into the biophase was assessed. Both a rst-order and nonlinear Michaelis-Menten absorption model were tted to the data. The rst-order absorption model failed to capture the full dynamic behaviour of the data in that it systematically over-predicted the response-time course for the highest
oral dose (812µmol kg−1). This problem was resolved by the Michaelis-Menten
355
absorption model that also captured the absorption-rate limited elimination.
4.3. The NiAc/FFA DRT model
The model captures the general trends of the populations and the Monte Carlo prediction intervals span most of the individuals.
The population ts in Fig. 4 indicate that the population medians dier 360
slightly from the individual behaviours for the infusion of0.033µmol kg−1min−1
(Fig. 4a), which is predicted to be higher than the individual outcomes, and
the oral dose of81.2µmol kg−1 (Fig. 4i), which is predicted to be lower than
the individual outcomes. This dierence is believed to be an artefact of inter-occasional variability since these populations have lower (for the infusion of 365
0.033µmol kg−1min−1), respectively higher (for the oral dose of81.2µmol kg−1),
baseline values than the estimated population baseline. A potential way to avoid this issue is to model the inter-occasional variations.
The eight moderator compartments were chosen to model the slow and fast action of insulin and other hormones. A more eloquent way would be to optimize 370
the number of compartments as a system parameter or use another time-delay relation, such as the actual insulin concentration-time course. This is a matter for future model renement.
The integral feedback control, moderator feedback, and the turnover of FFA are shown to act over dierent time-scales (Table 3). Turnover of FFA occurs 375
within minutes, the feedback triggered by insulin and other hormones operates
couple of hours.
The model predicts full system adaptation for long-term constant rate
infu-sions with the therapeutic infusion rate of0.17µmol kg−1min−1 (Fig. 7). This
380
illustrates the eect of the integral feedback control, which forces the response back to baseline over time. Homeostatic behaviour has been proven
experimen-tally in studies of long-term NiAc provocation [45]. However,90%of adaptation
typically occurs within24 hat therapeutic concentrations of NiAc. A better
es-timate for the adaptationKi is expected when longitudinal data are generated
385
and added to the analysis.
In general, there is high consistency between our derived system parameter estimates and the ones from exposure-driven analysis. The slight deviations are still within reasonable biological limits given the parameter uncertainty (Table 4). This comparison strengthens the use of DRT analysis as a complementary 390
technique in studies where limited exposure data are available.
The proposed biophase model is per se a substantial simplication in com-parison to the original multi-compartment plasma kinetics (exposure) model that has been applied by others (Iwaki et al. [34], Ahlström et al. [7] and Tapani et al. [59]). Therefore, dose predictions, impact of dierent dosing regi-395
mens, or assessment of safety margins will probably require an exposure-driven approach.
This study has demonstrated the utility of DRT modelling by developing biophase-driven pharmacodynamic models. The biophase structure was chal-lenged by means of dierent rates, routes, and modes of administration, on top 400
of the pharamcodynamic complexities.
We envision that DRT data analysis will have great signicance on phar-macological responses (biomarkers) used in the future assessment of dynamics. DRT analysis has proven to be an acceptable alternative to exposure-driven PD modelling in situations where plasma concentrations are sparse or missing, or 405
if extreme dierences are seen for the initial and terminal disposition phases in plasma (such as with oligonucleotides, where rate and extent of exposure vary signicantly between tissues [15, 31]).
4.4. Control theory
In this study, techniques from systems and control theory were utilized to 410
describe feedback mechanisms and systemic adaptation. By applying integral feedback control the system demonstrated full adaptation under constant long-term NiAc pressure (see Fig. 7). In fact, integral feedback control is a prereq-uisite for perfect adaptation in systems that experience constant disturbance [10, 56].
415
The control theory feature of the pharmacodynamic model provides a sig-nicant improvement in comparison to previously published NiAc/FFA models [7, 59], and will make the model better suited for chronic regimens.
Many biological systems, experiencing adaptation when put under external disturbance, have been successfully modelled by means of control theory tech-420
showed how integral feedback control could, for example, be derived from enzy-matic relations when the goal is to address the control of plasma calcium levels [19]. Control theory techniques have been used sparsely within PK-PD mod-425
elling and mostly in dose control [52, 57, 61, 63, 62]. Control theory techniques have a clear potential in modelling intrinsic control and feedback systems.
4.5. Inter-individual and intra-individual variability
When the model was tted for each individual separately (i.e., without a
mixed-eects approach) the parameter estimates of R0, k, kout, ktol, and Ki
430
had large coecients of variation, indicating that the data contained enough
information to estimate the corresponding η's of these parameters (i.e. the
individual parameters) in a mixed-eects approach. However, no parametric model (e.g., normal or log-normal) was successfully matched to the distributions of the EBE's. Regardless, a log-normal distribution was chosen to model the 435
EBE's spread due the positive range of the log-normal distribution, a generic feature expected in the parameters. Use of a log-normal model led to high
levels of shrinkage in some of the EBE's. WhilstR0andkhad lowη-shrinkages,
indicating that the log-normal assumption on the parameter distributions was
reasonable, the remaining three parameters (kout, ktol, and Ki) had high η
-440
shrinkages of 40−60%, indicating that the log-normal distribution does not
describe these parameters in a satisfactory way. Thus, one should be careful not to over-interpret the values of the EBE's. This includes EBE vs EBE plots or EBE vs covariate plots, which are not reliable under high levels of shrinkage. For that reason, analyses of these kinds are omitted in this study. However, 445
the estimated random eects are still useful when describing the data and when extrapolating to, for example, other dosing regimens.
Both of the models used for the infusion and oral data gave reasonably low
ε-shrinkages of less than10%indicating that the models describe the data in a
satisfactory manner without being over-tted. 450
4.6. New numerical algorithms
The new numerical algorithms used rely on sensitivity equations to calculate the gradients in the optimization routine. This improves precision and accu-racy extensively in comparison to nite dierence approximations, increasing the chance of convergence in the parameter estimation for computer-intensive 455
models [9].
5. Conclusions
A DRT model was successfully tted to all time courses available of the NiAc-induced changes in FFA in normal rats, showing the versatility of this approach. A nonlinear biophase model was used to describe saturable absorption. Using 460
exposure to NiAc. This provides a signicant improvement of the previously used NiAc/FFA models and will be suited in chronic regimens. Consistency in 465
pharmacodynamic parameters between biophase- and kinetic-driven studies in-dicates potentially wider use of DRT data analysis. New numerical approaches were successfully applied to robustly and eciently compute the gradients in the nonlinear mixed-eects framework.
DRT analysis is generally a poorly explored area that has great potential 470
and could be considered more frequently in future pharmacological studies when drug exposure data are scarce or even lacking.
Acknowledgements
This work was funded through the Marie Curie FP7 People ITN European Industrial Doctorate (EID) project, IMPACT (Innovative Modelling for Phar-475
macological Advances through Collaborative Training) (No. 316736)
Joachim Almquist at Fraunhofer-Chalmers Centre is greatly acknowledged for valuable scientic discussions and technical assistance.
Appendix A
The following is an excerpt from the modelling code used, implemented in 480
Mathematica. An executable version of this code, with corresponding data sets used for this study, is available from the authors upon request.
References
[1] Abou Hammoud, H., Simon, N., Urien, S., Riou, B., Lechat, P., Aubrun, F., Jul. 2009. Intravenous morphine titration in immediate postoperative pain 485
management: population kinetic-pharmacodynamic and logistic regression analysis. Pain 144 (1-2), 13946.
URL http://www.ncbi.nlm.nih.gov/pubmed/19435651
[2] Ackerman, E., Rosevear, J. W., McGuckin, W. F., 1964. A Mathematical Model of the Glucose-tolerance test. Phys. Med. Biol. 9, 203213.
490
[3] Ahlström, C., 2011. Modelling of tolerance and rebound in normal and diseased rats. Disseratation, University of Gothenburg.
[4] Ahlström, C., Kroon, T., Peletier, L. A., Gabrielsson, J., Dec. 2013. Feed-back modeling of non-esteried fatty acids in obese Zucker rats after nico-tinic acid infusions. J. Pharmacokinet. Phar. 40 (6), 62338.
495
URL http://www.ncbi.nlm.nih.gov/pubmed/24114415
[5] Ahlström, C., Peletier, L. A., Gabrielsson, J., Oct. 2011. Quantitative anal-ysis of rate and extent of tolerance of biomarkers: application to nicotinic acid-induced changes in non-esteried fatty acids in rats. Eur. J. Pharm. Sci. 44 (3), 25064.
500
[6] Ahlström, C., Peletier, L. A., Gabrielsson, J., Aug. 2013. Challenges of a mechanistic feedback model describing nicotinic acid-induced changes in non-esteried fatty acids in rats. J. Pharmacokinet. Phar. 40 (4), 497512. [7] Ahlström, C., Peletier, L. A., Jansson-Löfmark, R., Gabrielsson, J., Feb. 505
2011. Feedback modeling of non-esteried fatty acids in rats after nicotinic acid infusions. J. Pharmacokinet. Phar. 38 (1), 124.
URL http://www.pubmedcentral.nih.gov/articlerender.fcgi?
artid=3020290&tool=pmcentrez&rendertype=abstract
[8] Akaike, H., 1974. A New Look at the Statistical Model Identication. IEEE 510
T. Automat. Contr. 19 (6), 716723.
[9] Almquist, J., Leander, J., Jirstrand, M., Mar. 2015. Using sensitivity equa-tions for computing gradients of the FOCE and FOCEI approximaequa-tions to the population likelihood. J. Pharmacokinet. Phar. 42 (3), 191209. URL http://link.springer.com/10.1007/s10928-015-9409-1 515
[10] Ang, J., Bagh, S., Ingalls, B. P., Mcmillen, D. R., 2010. Considerations for using integral feedback control to construct a perfectly adapting synthetic gene network. J Theor Biol 266 (4), 723738.
URL http://dx.doi.org/10.1016/j.jtbi.2010.07.034
[11] Anguelova, M., Karlsson, J., Jirstrand, M., Sep. 2012. Minimal output sets 520
for identiability. Math. Biosci. 239 (1), 13953.
URL http://www.ncbi.nlm.nih.gov/pubmed/22609467
[12] Barkai, N., Leibler, S., 1997. Robustness in simple biochemical networks. Nature 387, 913917.
URL http://www.nature.com/nature/journal/v387/n6636/box/
525
387913a0_BOX1.html
[13] Bonate, P. L., 2011. Pharmacokinetic-Pharmacodynamic Modeling and Simulation. Springer, New York.
[14] Bragg, P., Fisher, D. M., Shi, J., Donati, F., Meistelman, C., Lau, M., Sheiner, L. B., 1994. Comparison of twitch depression of the adductor 530
pollicis and the respiratory muscles. Pharmacodynamic modeling without plasma concentrations. Anesthesiology 80 (2), 310319.
[15] Callies, S., André, V., Patel, B., Waters, D., Francis, P., Burgess, M., Lahn, M., Mar. 2011. Integrated analysis of preclinical data to support the design of the rst in man study of LY2181308, a second generation 535
antisense oligonucleotide. Brit. J. Clin. Pharmaco. 71 (3), 41628.
URL http://www.pubmedcentral.nih.gov/articlerender.fcgi?
artid=3045551&tool=pmcentrez&rendertype=abstract
[16] Carlson, L. A., Aug. 2005. Nicotinic acid: the broad-spectrum lipid drug. A 50th anniversary review. J. Intern. Med. 258 (2), 94114.
540
[17] Cosentino, C., Bates, D., 2011. Feedback Control in Systems Biology. Tay-lor & Francis Group, Boca Raton.
[18] Davison, A., Hinkley, D., 1997. Bootstrap Methods and their Application. Cambridge University Press, New York.
545
[19] El-Samad, H., Go, J. P., Khammash, M., Jan. 2002. Calcium homeostasis and parturient hypocalcemia: an integral feedback perspective. J .Theor. Biol. 214 (1), 1729.
URL http://www.ncbi.nlm.nih.gov/pubmed/11786029
[20] Fabbrini, E., Mohammed, B. S., Korenblat, K. M., Magkos, F., McCrea, 550
J., Patterson, B. W., Klein, S., Jun. 2010. Eect of fenobrate and niacin on intrahepatic triglyceride content, very low-density lipoprotein kinetics, and insulin action in obese subjects with nonalcoholic fatty liver disease. J. Clin. Endocr. Metab. 95 (6), 272735.
URL http://www.pubmedcentral.nih.gov/articlerender.fcgi?
555
artid=2902076&tool=pmcentrez&rendertype=abstract
[21] Fisher, D. M., Szenohradszky, J., Wright, P. M. C., 1997. Pharma-codynamic modeling of vecuronium-induced twitch depression. Rapid plasma-eect site equilibration explains faster onset at resistant laryngeal muscles than at the adductor pollicis. Anesthesiology 86 (3), 558566. 560
URL http://journals.lww.com/anesthesiology/Abstract/1997/
03000/Pharmacodynamic_Modeling_of_Vecuronium_induced.7.aspx [22] Fisher, D. M., Wright, P. M. C., 1997. Are plasma concentration values
nec-essary for pharmacodynamic modeling of muscle relaxants? Anesthesiology 86 (3), 567575.
565
[23] Frayn, K., Shadid, S., Hamlani, R., Humphreys, S., Clark, M., Fielding, B., Boland, O., Coppsack, S., 1994. Regulation of fatty acid movement in human adipose tissue in the postabsorptive-to-postprandial transition. Am. J. Physiol. Endocrinol. Metab. 266, 308317.
URL http://ajpendo.physiology.org/content/ajpendo/266/3/E308. 570
full.pdf
[24] Gabrielsson, J., Jusko, W., Alari, L., 2000. Modeling of doseresponsetime data: four examples of estimating the turnover parameters and generating kinetic functions from response proles. Biopharm. Drug Dispos. 21 (2), 4152.
575
URL http://onlinelibrary.wiley.com/doi/10.1002/
1099-081X(200003)21:2%3C41::AID-BDD217%3E3.0.CO;2-D/abstract [25] Gabrielsson, J., Peletier, L. A., Oct. 2007. A nonlinear feedback model
capturing dierent patterns of tolerance and rebound. Eur. J. Pharm. Sci. 32 (2), 85104.
580
[26] Gabrielsson, J., Peletier, L. A., Aug. 2014. Dose-response-time data anal-ysis involving nonlinear dynamics, feedback and delay. Eur. J .Pharm. Sci. 59, 3648.
URL http://www.ncbi.nlm.nih.gov/pubmed/24751673 585
[27] Gennemark, P., Nordlander, B., Hohmann, S., Wedelin, D., Jan. 2006. A simple mathematical model of adaptation to high osmolarity in yeast. In Silico Biol 6 (3), 193214.
URL http://www.ncbi.nlm.nih.gov/pubmed/16922683
[28] Gruwez, B., Poirier, M.-F., Dauphin, A., Olié, J.-P., Tod, M., May 2007. 590
A kinetic-pharmacodynamic model for clinical trial simulation of antide-pressant action: application to clomipramine-lithium interaction. Contemp. Clin. Trials. 28 (3), 27687.
URL http://www.ncbi.nlm.nih.gov/pubmed/17059901
[29] Hamberg, A.-K., Wadelius, M., Lindh, J. D., Dahl, M. L., Padrini, R., 595
Deloukas, P., Rane, A., Jonsson, E. N., Jun. 2010. A pharmacometric model describing the relationship between warfarin dose and INR response with respect to variations in CYP2C9, VKORC1, and age. Clin. Pharmacol. Ther. 87 (6), 72734.
URL http://www.ncbi.nlm.nih.gov/pubmed/20410877 600
[30] He, F., Fromion, V., Westerho, H. V., 2013. (Im) Perfect robustness and adaptation of metabolic networks subject to metabolic and gene-expression regulation: marrying control engineering with metabolic control. BMC Syst. Biol. 7 (131).
URL http://www.biomedcentral.com/1752-0509/7/131/ 605
[31] Heemskerk, H., de Winter, C., van Kuik, P., Heuvelmans, N., Sabatelli, P., Rimessi, P., Braghetta, P., van Ommen, G.-J. B., de Kimpe, S., Ferlini, A., Aartsma-Rus, A., van Deutekom, J. C. T., Jun. 2010. Preclinical PK and PD studies on 2'-O-methyl-phosphorothioate RNA antisense oligonucleotides in the mdx mouse model. Mol. Ther. 18 (6), 12107. 610
URL http://www.pubmedcentral.nih.gov/articlerender.fcgi?
artid=2889733&tool=pmcentrez&rendertype=abstract
[32] Heemskerk, M. M., van den Berg, S. A. A., Pronk, A. C. M., van Klinken, J.-B., Boon, M. R., Havekes, L. M., Rensen, P. C. N., van Dijk, K. W., van Harmelen, V., Apr. 2014. Long-term niacin treatment induces insulin 615
resistance and adrenergic responsiveness in adipocytes by adaptive down-regulation of phosphodiesterase 3B. Am. J. Physiol. Endocrinol. Metab. 306 (7), E80813.
URL http://www.ncbi.nlm.nih.gov/pubmed/24473440
[33] Isaksson, C., Gabrielsson, J., Wallenius, K., Peletier, L. A., Toreson, H., 620
24769.
URL http://www.pubmedcentral.nih.gov/articlerender.fcgi?
artid=2754538&tool=pmcentrez&rendertype=abstract 625
[34] Iwaki, M., Ogiso, T., Hayashi, H., Tanino, T., Benet, L. Z., 1996. Acute Dose-Dependent Disposition Studies of Nicotinic Acid in Rats. Drug Metab. Dispos. 24 (7), 773779.
[35] Jacqmin, P., Snoeck, E., van Schaick, E. A., Gieschke, R., Pillai, P., Steimer, J.-L., Girard, P., Feb. 2007. Modelling response time proles in 630
the absence of drug concentrations: denition and performance evaluation of the K-PD model. J. Pharmacokinet. Phar. 34 (1), 5785.
URL http://www.ncbi.nlm.nih.gov/pubmed/17051439
[36] Karlsson, J., Anguelova, M., Jirstrand, M., 2012. An Ecient Method for Structural Identiability Analysis of Large Dynamic Systems. 16th IFAC 635
Symposium on System Identication (SYSID 2012) 16 (1), 941946. [37] Kroon, T., Kjellstedt, A., Thalén, P., Gabrielsson, J., Oakes, N. D., Sep.
2015. Dosing prole profoundly inuences nicotinic acid's ability to improve metabolic control in rats. J. Lipid Res. 56 (9), 16791690.
[38] Leander, J., Lundh, T., Jirstrand, M., 2014. Mathematical Biosciences 640
Stochastic dierential equations as a tool to regularize the parameter esti-mation problem for continuous time dynamical systems given discrete time measurements. Math Biosci 251, 5462.
[39] Levy, G., 1964. Relationship Between Elimination Rate of Drugs and Rate of Decline of Their Pharmacologic Eects. J .Pharm. Sci. 53 (3), 342343. 645
[40] Lindskog, P., 1996. Methods, Algorithms and Tools for System Identica-tion Based on Prior Knowledge. DissertaIdentica-tion, Linköping University.
[41] Luu, K., Zhang, E., Prasanna, G., 2009.
Pharmacokinetic-pharmacodynamic and response sensitization modeling of the intraocular pressure-lowering eect of the EP4 Agonist 5-{3-[(2S)-2-{(3R)-3-hydroxy-650
4-[3-(triuoromethyl)phenyl]butyl}-5-oxopyrrolidin-1-yl]propyl}thiophene-2-carboxylate. J. Pharmacol. Exp. Ther. 331 (2), 627635.
URL http://jpet.aspetjournals.org/content/331/2/627.short [42] Muzzey, D., Gómez-Uribe, C., Mettetal, J. T., van Oudenaarden, A., 2009.
A systems-level analysis of perfect adaptation in yeast osmoregulation. 655
Cell 138 (1), 160171.
URL http://www.sciencedirect.com/science/article/pii/
S009286740900508X
[44] Oermanns, S., Jul. 2006. The nicotinic acid receptor GPR109A (HM74A 660
or PUMA-G) as a new therapeutic target. Trends Pharmacol. Sci. 27 (7), 38490.
URL http://www.ncbi.nlm.nih.gov/pubmed/16766048
[45] Oh, Y., Oh, K., Choi, Y., 2011. Continuous 24-h nicotinic acid infusion in rats causes FFA rebound and insulin resistance by altering gene expres-665
sion and basal lipolysis in adipose tissue. Am J Physiol Endocrinol Metab 300 (2), 10121021.
URL http://ajpendo.physiology.org/content/300/6/E1012.short [46] Pillai, G., Gieschke, R., Goggin, T., Jacqmin, P., Schimmer, R. C., Steimer,
J.-L., Dec. 2004. A semimechanistic and mechanistic population PK-PD 670
model for biomarker response to ibandronate, a new bisphosphonate for the treatment of osteoporosis. Brit. J. Clin. Pharmaco. 58 (6), 61831.
URL http://www.pubmedcentral.nih.gov/articlerender.fcgi?
artid=1884644&tool=pmcentrez&rendertype=abstract
[47] Poynten, A. M., Gan, S. K., Kriketos, A. D., O'Sullivan, A., Kelly, J. J., 675
Ellis, B. A., Crisholm, D. J., Campbell, L. V., 2003. Nicotinic acid-induced insulin resistance is related to increased circulating fatty acids and fat oxi-dation but not muscle lipid content. Metabolism 52 (6), 699704.
[48] Raue, A., Karlsson, J., Saccomani, M. P., Jirstrand, M., Timmer, J., May 2014. Comparison of approaches for parameter identiability analysis of 680
biological systems. Bioinformatics 30 (10), 14408. URL http://www.ncbi.nlm.nih.gov/pubmed/24463185
[49] Robert, C., Casella, G., 2004. Monte Carlo Statistical Methods. Springer, New York.
[50] Sadur, C., Eckel, R., 1982. Insulin stimulation of adipose tissue lipoprotein 685
lipase. Use of the euglycemic clamp technique. J. Clin. Invest. 69 (May), 11191125.
URL http://www.ncbi.nlm.nih.gov/pmc/articles/PMC370176/ [51] Savic, R. M., Karlsson, M. O., Sep. 2009. Importance of shrinkage in
empirical bayes estimates for diagnostics: problems and solutions. AAPS 690
J. 11 (3), 55869.
URL http://www.pubmedcentral.nih.gov/articlerender.fcgi?
artid=2758126&tool=pmcentrez&rendertype=abstract
[52] Schwildren, H., Schüttler, J., Stoeckel, H., 1987. Closed-loop Feedback Con-trol of Methohexital Anesthesia by Quantitative EEF Analysis in Humans. 695
Anesthesiology 67, 341347.
[53] Smolen, V., Weigand, W., 1973. Drug bioavailability and pharmacokinetic analysis from pharmacological data. J. Pharmacokinet. Biop. 1 (4), 329 336.
[54] Smolen, V. F., Mar. 1971. Quantitative determination of drug bioavailabil-ity and biokinetic behavior from pharmacological data for ophthalmic and oral administrations of a mydriatic drug. J. Pharm. Sci. 60 (3), 35465. URL http://www.ncbi.nlm.nih.gov/pubmed/5572111
[55] Smolen, V. F., Aug. 1976. Theoretical and computational basis for drug 705
bioavailability determinations using pharmacological data. II. Drug input in equilibrium to response relationships. J. Pharmacokinet. Biop. 4 (4), 35575.
URL http://www.ncbi.nlm.nih.gov/pubmed/978397
[56] Sontag, E. D., Oct. 2003. Adaptation and regulation with signal detection 710
implies internal model. Syst Control Lett 50 (2), 119126.
URL http://linkinghub.elsevier.com/retrieve/pii/
S0167691103001361
[57] Stone, A. G. H., Howell, P. R., 2002. Use of the common gas outlet for the administration of supplemental oxygen during Caesarean section under 715
regional anaesthesia. Anaesthesia 57, 690709.
[58] Strålfors, P., Björgell, P., Belfrage, P., 1984. Hormonal regulation of hormone-sensitive lipase in intact adipocytes: identication of phospho-rylated sites and eects on the phosphorylation by lipolytic hormones. P. Natl. Acad. Sci. USA 81 (June), 33173321.
720
URL http://www.pnas.org/content/81/11/3317.short
[59] Tapani, S., Almquist, J., Leander, J., Ahlström, C., Peletier, L. A., Jirstrand, M., Gabrielsson, J., Aug. 2014. Joint feedback analysis modeling of nonesteried fatty acids in obese Zucker rats and normal Sprague-Dawley rats after dierent routes of administration of nicotinic acid. J. Pharm. Sci. 725
103 (8), 257184.
URL http://www.ncbi.nlm.nih.gov/pubmed/24986056
[60] Tod, M., Dec. 2008. Evaluation of drugs in pediatrics using K-PD models: perspectives. Fundam. Clin. Pharm. 22 (6), 58994.
URL http://www.ncbi.nlm.nih.gov/pubmed/19049659 730
[61] Urquhart, J., Li, C., 1969. Dynamic testing and modeling of adrenocortical secretory function. Ann. N Y Acad. Sci.
URL http://onlinelibrary.wiley.com/doi/10.1111/j.1749-6632.
1969.tb14012.x/full
[62] Veng-Pedersen, P., Modi, N. B., 1993. A system approach to pharmaco-735
dynamics. Input-eect control system analysis of central nervous system eect of alfentanil. J Pharm Sci 82 (3), 26672.
[64] Warwick, N., Graham, G., Torda, T., 1998. Pharmacokinetic analysis of 740
the eect of vecuronium in surgical patients: pharmacokinetic and phar-macodynamic modeling without plasma concentrations. Anesthesiology 88 (4), 874884.
URL http://journals.lww.com/anesthesiology/Abstract/1998/
04000/Pharmacokinetic_Analysis_of_the_Effect_of.5.aspx 745
[65] Wu, K., Looby, M., Pillai, G., Pinault, G., Drollman, A. F., Pascoe, S., Feb. 2011. Population pharmacodynamic model of the longitudinal FEV1 response to an inhaled long-acting anti-muscarinic in COPD patients. J. Pharmacokinet. Phar. 38 (1), 10519.
URL http://www.ncbi.nlm.nih.gov/pubmed/21104005 750
[66] Yi, T. M., Huang, Y., Simon, M. I., Doyle, J., Apr. 2000. Robust perfect adaptation in bacterial chemotaxis through integral feedback control. P. Natl. Acad. Sci. USA 97 (9), 464953.
URL http://www.pubmedcentral.nih.gov/articlerender.fcgi?
(a)
Bolus
input
/
First-order
elimination
A
bk
(b)
Zero-order
input
/
First-order
elimination
(c)
Zero-order
input
/
Mic
haelis-M
en
ten
elimination
(d)
Multi-compartmen
t
(e)
Zero-order
and
rst-orde
r
inp
ut
/
First-order
elimination
(f
)
Zero-order
and
Mic
haelis-Men
ten
input/
First-order
elimination
A
bM
M
M
M
Figure
2:
Examples
dra
wn
from
a
library
biophase
functions
used
here
and
in
literature
[21,
26,
64].
(a)
bolus
input
and
rst-order
elimination.
(b)
zero-order
input
and
rst-order
el
imina
ti
on.
(c)
zero-ord
er
input
and
Mic
haelis-Men
ten
elimination.
(d)
m
ulti-compartmen
t
mo
del.
(e)
zero-order
and
rst-order
input,
and
rst-order
elimination.
(f
)
zero-order
and
Mic
haelis-Men
ten
input,
and
rst-order
elimination.
Ab
,
Inf
,
k
,
ka
,
and
MM
represen
t,
resp
ectiv
ely
,
the
biophase
amoun
t,
the
constan
t
rate
infusion
input,
the
rst-order
elimination
rate
constan
t,
the
rst-ord
er
absorption
rate
constan
t,
and
the
Mic
haelis-Men
ten
absorption/elimination
pro
M
1
M
8
FFA
k
tolk
tolk
tolk
in·
I(A
b)
k
out+
+
+
-
p
Integral
Controller
u(t)
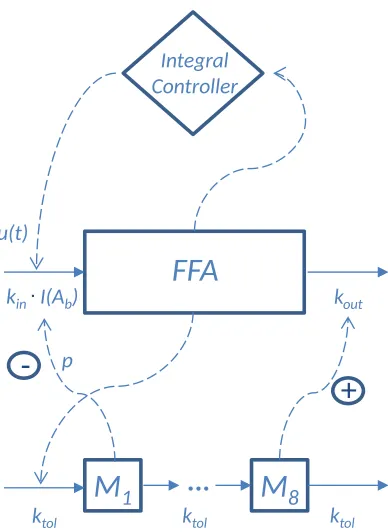
[image:26.612.213.407.223.489.2]...
Figure 3: Schematic structure of the pharmacodynamics of the DRT feedback model. The pharmacodynamic model structure consists of a turnover equation coupled with a chain of moderator compartments, with slow and rapid feedback, as well as a slow integral control feedback. Herekin denotes the turnover rate of FFA, kout the fractional turnover rate of
FFA,ktol the turnover rate of the moderators,p the amplication factor, I(Ab) the
drug-mechanism function, andM1 and M8 the rst and last moderator, respectively. Solid lines
-Table 3: Estimated system rate constants and their corresponding half-lives (in minutes) with 90% non-parametric bootstrap prediction intervals
Parameter Estimate Half-life 90% PIa
kout (min−1) 0.31 2.3 [1.3,4.0]
ktol(min−1) 0.024 29 [15,51]
Ki (min−1) 0.0017 400 [210,710]
[image:31.612.191.415.159.214.2]a90%non-parametric bootstrap prediction interval
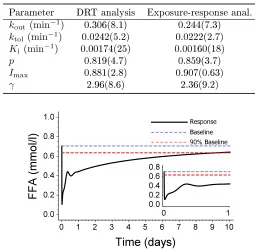
Table 4: Comparison between the dynamic parameter estimates from the DRT study and an exposure-driven study. The parameter estimates are given with corresponding relative standard errors (RSE%)
Parameter DRT analysis Exposure-response anal.
kout (min−1) 0.306(8.1) 0.244(7.3)
ktol(min−1) 0.0242(5.2) 0.0222(2.7)
Ki (min−1) 0.00174(25) 0.00160(18)
p 0.819(4.7) 0.859(3.7)
Imax 0.881(2.8) 0.907(0.63)
γ 2.96(8.6) 2.36(9.2)
Figure 7: The long-term model-predicted eect of NiAc provocation on FFA level in normal rats with an infusion rate of0.17µmol kg−1min−1(aiming at a therapeutic NiAc concentration
of1µmol[4]) during 10 days. The inserted gure shows in more detail the dynamics during
[image:31.612.175.430.283.533.2]the rst day of NiAc infusion
Table 5: Model residual additive errors with corresponding relative standard errors (RSE%)
andε-shrinkage for infusion and oral data, respectively
Data Residual add. error σ ε-shrinkage
Infusion 0.0982(14) 9.5%
[image:31.612.198.412.627.669.2]Specify fixed parameter rules and random effects (transform Imax to keep it bounded) fixedParamRules = kin → R0 * kout, Imax → 1 1 + Exp [-θ 1 ] ; randomEffects = kb → kb * Exp [ η 1 ] , Ki → Ki * Exp [ η 2 ] , R0 → R0 * Exp [ η 3 ] , kout → ( kout * Exp [ η 4 ]) , ktol → ( ktol * Exp [ η 5 ]) ;
Define system, initial conditions and measured variables sys
= { Ab ' [ t ] , R ' [ t ] , M1 ' [ t ] , M2 ' [ t ] , M3 ' [ t ] , M4 ' [ t ] , M5 ' [ t ] , M6 ' [ t ] , M7 ' [ t ] , M8 ' [ t ] , y ' [ t ]} ⩵ bioInput -kb * Ab [ t ] , 1 + Ki * y [ t ] * kin * 1 -Imax * Ab [ t ] ^ γ ID50 ^ γ + Ab [ t ] ^ γ * R0 M1 [ t ] ^ p -kout * R [ t ] * M8 [ t ] R0 , ktol R [ t ] -M1 [ t ] , ktol M1 [ t ] -M2 [ t ] , ktol M2 [ t ] -M3 [ t ] , ktol M3 [ t ] -M4 [ t ] , ktol ( M4 [ t ] -M5 [ t ]) , ktol M5 [ t ] -M6 [ t ] , ktol M6 [ t ] -M7 [ t ] , ktol M7 [ t ] -M8 [ t ] , 1 -R [ t ] R0 ; ic = { Ab [ 0 ] , R [ 0 ] , M1 [ 0 ] , M2 [ 0 ] , M3 [ 0 ] , M4 [ 0 ] , M5 [ 0 ] , M6 [ 0 ] , M7 [ 0 ] , M8 [ 0 ] , y [ 0 ]} ⩵ { 0, R0, R0, R0, R0, R0, R0, R0, R0, R0, 0 } ; out = { R
[ t]}
; oralSys = { Aa ' [ t ] , Ab ' [ t ] , R ' [ t ] , M1 ' [ t ] , M2 ' [ t ] , M3 ' [ t ] , M4 ' [ t ] , M5 ' [ t ] , M6 ' [ t ] , M7 ' [ t ] , M8 ' [ t ] , y ' [ t ]} ⩵ -aVmax * Aa [ t ] / ( aKm + Aa [ t ]) , bioInput -kb * Ab [ t ] , 1 + Ki * y [ t ] * kin * 1 -Imax * Ab [ t ] ^ γ ID50 ^ γ + Ab [ t ] ^ γ * R0 M1 [ t ] ^ p -kout * R [ t ] * M8 [ t ] R0 , ktol R [ t ] -M1 [ t ] , ktol M1 [ t ] -M2 [ t ] , ktol M2 [ t ] -M3 [ t ] , ktol M3 [ t ] -M4 [ t ] , ktol ( M4 [ t ] -M5 [ t ]) , ktol M5 [ t ] -M6 [ t ] , ktol M6 [ t ] -M7 [ t ] , ktol M7 [ t ] -M8 [ t ] , 1 -R [ t ] R0 ; oralIc = { Aa [ 0 ] , Ab [ 0 ] , R [ 0 ] , M1 [ 0 ] , M2 [ 0 ] , M3 [ 0 ] , M4 [ 0 ] , M5 [ 0 ] , M6 [ 0 ] , M7 [ 0 ] , M8 [ 0 ] , y [ 0 ]} ⩵ { absInput, 0, R0, R0, R0, R0, R0, R0, R0, R0, R0, 0 } ;
Specify input bioInputFunctions
= RATE * UnitStep [ DOSE / RATE -t ] , RATE * UnitStep [ 30 -t ] + Piecewise RATE -Ceiling t -30 10 * RATE 19, t > 30 && t < 210 + Piecewise RATE * UnitStep 210 + DOSE -20 RATE -t , t > 210 , Aa [ t ] * aVmax / ( aKm + Aa [ t ]) ; absInputFunctions = { RATE * DOSE } ;
Specify systems infSys
= sys / . Thread [ bioInput → bioInputFunctions [[ 1 ]]] / . fixedParamRules; stepSys = sys / . Thread [ bioInput → bioInputFunctions [[ 2 ]]] / . fixedParamRules; oralSys = oralSys / . Thread [ bioInput → bioInputFunctions [[ 3 ]]] / . fixedParamRules;
Define random variables (i.e. multiplicative random noises to certain parameters, here ID50, kout, R0 and Ki)
randomParams = { η 1, η 2, η 3, η 4, η 5 } ;
Setting up models consisting of {sys}, {ic}, out model1
= {{ infSys } , { ic } , out } / . randomEffects; model2 = {{ stepSys } , { ic } , out } / . randomEffects; model3 = {{ oralSys } , { oralIc } / . Thread [ absInput → absInputFunctions ] , out } / . randomEffects; models = { model1, model2, model3 } ;
Define Omega (interindividual variation) L=
{{ ω 11, 0, 0, 0, 0 } , { 0, ω 22, 0, 0, 0 } , { 0, 0, ω 33, 0, 0 } , { 0, 0, 0, ω 44, 0 } , { 0, 0, 0, 0, ω 55 }} ; Ω = L.Transpose [ L ] ;
Define the S matrix for all models (measurment noise) S1
= {{ s1 }} ; S2 = {{ s2 }} ; S3 = {{ s3 }} ; SList = { S1, S2, S3 } ;
Construct a data list of data from all models. In this case, with only one administration route, the list only consains a single model. infData
= { Join [ prepDataDose0Time0, prepDataDose1Time30, prepDataDose5Time30, prepDataDose20Time30, prepDataDose5Time300, prepDataDose10Time300, prepDataDose51Time300 ]} ; stepData = { Join [ prepDataDose20, prepDataDose25 ]} ; oralData = { Join [ prepDataOralDose24, prepDataOralDose81, prepDataOralDose812 ]} ; data = Join [ infData, stepData, oralData ] ;
Define all non yet defined constants of the system listOfInputs
= { DOSE, RATE } ;
Construct a parameter list with all the parameters parameterStartValue
= {{ aVmax, 5 } , { aKm, 30 } , { θ 1, 2 } , { kb, 0.3 } , { Ki, 0.001 } , { ID50, 0.05 } , { kout, 0.30 } , { R0, 0.70 } , { γ , 1 } , { ktol, 0.03 } , { p, 1 }} ; ω StartValue = {{ ω 11, 0.1 } , { ω 22, 0.1 } , { ω 33, 0.1 } , { ω 44, 0.1 } , { ω 55, 0.1 }} ; sStartValue = {{ s1, 0.1 } , { s2, 0.1 } , { s3, 0.1 }} ; fullParameterList = Join [ params, { s1, s2, s3 }] ;
Estimation of parameters {pExpValues,