Master Thesis
CO-DESIGN APPROACH:
A COLLECTIVE DESIGN METHOD FOR IMPROVING WORKING EFFICIENCY AND SATISFACTION IN USER SUPPORT DESIGN PROCESSES
An empirical study based on three comparison groups simulating a real-world quick start guide design process
Leiying PU
Co-Design Approach: A Collective Design Method for
Improving Working Efficiency and Satisfaction in User
Support Design Processes
An empirical study based on three comparison groups simulating a real-world quick
start guide design process
August 2019
Master graduation thesis of: Leiying PU
Specialisation Technology and Communication, Communication Studies Faculty of Behavioral, Management and Social Sciences, University of Twente
ABSTRACT
Purpose: To analyse the effect of the co-design approach on working efficiency and satisfaction;
from empirical studies; in the context of user support design processes; from the views of design teams and individuals.
Method: A qualitative study based on empirical experiments was conducted. Under a simulated design environment, three comparison groups were set up for cross-comparison. Twenty-one university students were arranged in nine groups with assigned roles completing a real design task. The qualitative data from observation and interviews were analysed.
Results: The differences in time completing tasks and team satisfaction remained significantly different between general groups and co-design groups. Co-design groups designed products more efficiently with closer user involvement and more integrated intra-team cooperation; those groups perceived higher satisfaction with the design process, teamwork and team structure. On the individual level, participants from co-design groups were more satisfied with their product than general groups. The results for personal working efficiency and satisfaction vary for each role. The ‘users’ and ‘experts’ perceived higher individual working efficiency and satisfaction than ‘technical writers’ during the process.
Conclusion: Co-design improves the working efficiency of design teams. It provides a more
pleasing and satisfying design process in the context of user support design. New insights from the study add to the benefits and risks of adopting the co-design approach in practice. As an exploratory starting point, this study provides new empirical support for co-design research. Needs for
generalising the effects in other contexts of designing user support is suggested for future studies.
ACKNOWLEDGEMENTS
I would like to pay special thankfulness and appreciation to the persons below who made my study successful and assisted me at every point to cherish my goal:
My supervisor, dr. Karreman for her vital support and guidance. Her encouragement made it possible for me to transform the original ideas into a completed study.
My supervisor, prof. dr. De Jong, whose help and insights at every point during my research, helped me to work in the right direction.
TABLE OF CONTENTS
ABSTRACT ...2
1. INTRODUCTION ...6
2. THEORETICAL FRAMEWORK ...8
2.1 Co-design ...8
2.1.1 Evolution of co-design ...8
2.1.2 Benefits and risks of co-design ...10
2.2 User support ...11
2.2.1 User support and design process ...11
2.2.2 User support design process and co-design ...12
3. METHOD ...13
3.1 Design of study ...13
3.2 Participants ...14
3.3 Procedure ...15
3.4 Measures ...16
3.5 Data analysis ...17
4. RESULTS ...17
4.1 Observation results ...17
4.1.1 Time-to-complete ...18
4.1.2 Conceptual interaction diagrams ...18
4.2 Interview results ...21
4.2.1 Team working efficiency ...21
4.2.2 Individual working efficiency ...23
4.2.3 Satisfaction ...25
4.2.5 Critical reflections ...28
5. DISCUSSIONS...31
5.1 Main findings ...31
5.2 Theoretical implications ...32
5.4 Limitations ...34
5.5 Suggestions ...34
REFERENCES ...36
APPENDICES ...40
APPENDIX A. Detailed Participants Geographic Info ...41
APPENDIX B. Instructions ...42
APPENDIX C. Materials for QSG ...48
APPENDIX D. Sample observation Sheet ...52
APPENDIX E. Interview Questions ...53
APPENDIX F. Codebook ...55
APPENDIX G. Comparison Table of S1, S3 Interaction in Phase 1, 2 & 3 ...60
1. INTRODUCTION
Over the years, uncountable user manuals, documentation, quick reference guides, instructional videos and embedded user assistance have been created. Generally, these are materials and means serve as safe backup support to ensure that everyone who uses products or services is using them efficiently. Thus, in the domain of technology and communication, sometimes they are grouped with a ‘family name’: user support.
User support not only benefits people who use it but also rewards all stakeholders. In the product training, a useful guide is a huge part of cultivating self-learnability and product accessibility (Scott Cooley, 2017). Beneficial to not only users but more stakeholders. For example, a writer may refine her thoughts in the process of explaining things to others (Selic, 2009), a software developer could follow system consistency and improve quality from design documentation (Prechelt et al., 2002), and a company can impress consumers by providing user-friendly support (De Jong, Yang, & Karreman, 2017). Regarding those advantages, technical communication professionals have been working on optimising written user instructions (Van der Meij, Karreman, & Steehouder, 2009). Scholars have built solid a foundation with the topics of structure (Farkas, 1999), content (Carroll, 1997), style (Kohl, 2008), and design (Selic, 2009).
In user support practice, however, challenges have been distracting people away from those good omens. On the one hand, users keep complaining about their experience with documentation that is regarded as less useful than ‘just Google it’. It is because their relation with user support has been changed in the new era, from passive readers who are referring user support to active information producer. Large amounts of end-users have acquired an essential taste of design and technology with increased knowledge and skills. The greater focus on users is not a new idea, but the concept of encouraging users as a ‘co-producer' is a step forward. On another hand, creators of those manuals have labelled the writing process as an unpleasant but necessary task (Selic, 2009).
Researchers have acknowledged the challenges. Human-centred design serves as a popular approach that involves users from an early stage (Gould & Lewis, 1985). Recent years, literature on co-design and co-creation methods has emerged (e.g., Ardito, Buono, Costabile, Lanzilotti, & Piccinno, 2012; Trischler, Pervan, Kelly, & Scott, 2018), and it is slowly nudging designers of products and services to focus again on user involvement and creativity (Kristensson, Magnusson, & Matthing, 2002). Moreover, the focus on user experience (e.g., Battarbee & Koskinen, 2005) calls for filling a missing perspective: collective experiences, which are created together with others.
Product and service providers have noticed the risks as well. Development teams try to solve the problem in a ‘fast’ way: agile documentation development. To align with the fast system development pace, companies that provide technical documentation and related user support services adopt agile development for shortening the delivery time (Selic, 2009). At the same time, collective design approaches like participatory design, co-design and co-creation have been adopted, especially in a context of marketing and branding to attract customers. Those collective approaches benefit
technology users with higher satisfaction and a better fit in needs (Steen, Manschot, & Koning, 2011).
indicate a clear need for more empirical and experimental studies (Silva da Silva, Martin, Maurer, & Silveira, 2011). The existing research on co-design is hard to be found in the context of user support design. Furthermore, there emerges a need for research of some curious questions, e.g., what potential effects of co-design on working efficiency could be? Will the approach improve the satisfaction of other stakeholders besides the user group? Will different stakeholders perceive a process as satisfied differently by adopting this approach?
Therefore, in order to investigate those questions, the study conducted comparison experiments on three comparison groups simulating a real-world in the context of user support design. The study aims to explore the potential impact of the co-design approach on working efficiency and satisfaction, from individual and team perspectives in the design process.
2. THEORETICAL FRAMEWORK
The research questions focus on the potential effect of the co-design approach on working efficiency and satisfaction in a context of user support development process. A literature overview in this chapter outlines three critical terms of the questions, namely, co-design approach, user support, and design process.
2.1 Co-design
Within the substantial research on co-design, scholars have defined ‘co-design’ as a team-based process in which stakeholders from different disciplines contribute to the design process and content with shared knowledge’ (Kleinsmann, 2006; Penuel, Roschelle, & Shechtman, 2007). Co-design creates a shared language between users and designers to enhance understanding of the new product from all participants (Ardito, Buono, Costabile, Lanzilotti, & Piccinno, 2012). It stresses on a
‘collective creativity’ in the design process by participants not explicitly trained in design (Sanders & Stappers, 2008). In this view, co-design attempts to actively involve all stakeholders in any design process activity (Dodero, Gennari, Melonio, & Torello, 2014).
2.1.1 Evolution of co-design
This innovative design approach is not emerged from nowhere. Early studies relevant to the concept of co-design can be traced in several design approaches human-centred design, participatory design, and co-creation. The following outlines definitions, essences, strengths and weaknesses of those design approaches in order to set a common ground for highlighting the unique features of the co-design approach.
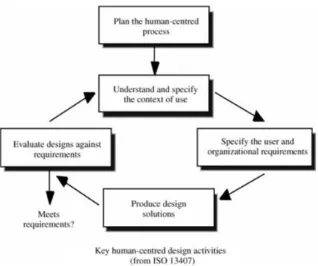
[image:11.595.214.373.586.719.2]First, co-design has a root in human-centred design (HCD). HCD emerged from the 1980s; it features in three fundamental principles, i.e., ‘early and continual focus on users’, ‘empirical measurement of usage’, and ‘iterative design’ (Gould & Lewis, 1985). User involvement is the core value of human-centred design. It has been reviewed systematically since the 1990s (e.g., Allen et al., 1993; Driessen & Hillebrand, 2013; Kaulio, 1998; Wind & Mahajan, 1997), underlining the importance of integrating multiple stakeholders to extend the range of collective creation opportunities (Gummesson and Mele, 2010). Kaulio (1998) presents an analytical framework and an interdisciplinary review of seven selected approaches dealing with customer, consumer and user involvement in product development. The principal activities in the HCD process are arranged with iterative loops (Figure 1).
As one of the most popular design approaches that enthusiastically endorsed by practitioners, HCD appears to be making an impact across the industry (Mao, Vredenburg, Smith, & Carey, 2005), in a broad fields like health, technology, education and service (Farinango, Benavides, Cerón, López, & Álvarez, 2018; Galer, Harker, Ziegler, & Galer, 1992; Ructtinger, 2015). However, it can be time-consuming for design teams to specify user requirements, conduct testing and collecting feedbacks in every round (Norman, 2005). It has been criticized since the 2000s primarily for three reasons: 1) adding complexity and cost to a design process; 2) focusing only on specific end-users; and 3) leading to improvement, not innovation (Norman, 2005). Facing those challenges, the scope of the HCD research keeps growing and evolving in response to the needs of the market (Sanders & Stappers, 2008). Scholars have called for extending the focus of HCD to include a broader range of
stakeholders from ‘user involvement’ to ‘human focus’ in the design process (e.g., Gasson, 2003). Moreover, recent research indicates involving users directly in the design process that make users become part of the design team as ‘expert of their experiences’ (Visser, Stappers, Van der Lugt, & Sanders, 2005) contributes to innovation value of the product (Frow, Nenonen, Payne, & Storbacka, 2015). Scholars further illustrate ‘which participants should be involved’ and ‘how’ (Vink, Imada, & Zink, 2008). However, the question about the effect of the co-design approach on participants who experienced the design process is still not apparent.
Second, as the definition stated, co-design highlights ‘multidisciplinary contribution', the derivation of similar concepts, i.e., ‘participation’ and ‘joint decision-making’, is from the 1970s. Since then, those two concepts became essential factors concerning workplaces and the introduction of new technology (Kaulio, 1998). Started in Scandinavia through a partnership between academics and trade unions (Robertson, Simonsen, & Simonsen, 2012; Spinuzzi, 2005), participatory design can be defined as “a process of investigating, understanding, reflecting upon, establishing, developing, and supporting mutual learning between multiple participants in collective ‘reflection-inaction’” (Robertson, Simonsen, & Simonsen, 2012). In human-computer interaction and related fields, it explores conditions for extensive user participation (both users and designers) in the design and the
introduction of ICT systems at work (Bødker & Iversen, 2002). PD influences writing studies, mainly from technical communication as well as computer and composition (Johnson, 1998; Spinuzzi, 2005). Still, the application of co-design is merely seen in the context of technical communication.
Third, dating back to the 1990s, the core value of ‘user creativity’ co-design can be found in another similar design approach, namely customer idealized design. As a primogenitor, it is defined as ‘a process for involving consumers in the actual design of new manufactured goods or services’ (Cincianntelli & Magdison, 1993). The idea has been further adopted in value co-creation research, especially in the marketing domain (Nambisan & Baron, 2009; Payne, Storbacka & Frow, 2008; Sanders & Stappers, 2008). For example, it is being endorsed as a powerful new tool for product naming, packaging, promoting and advertising (Sanders & Stappers, 2008). Co-creation emphases a change from traditional customer-supplier relation to the new opportunity: customers can engage in phases of product design and delivery with suppliers, creating value through customized, co-produced offerings (Payne, Storbacka, & Frow, 2008). This form of engagement should be seen as an
interactive process of learning together (Ballantyne, 2004). The role of customer highlights the value of co-creation. Therefore, the goal of co-creation is to improve or innovate the front-end process of identifying customers’ needs and wants from the consumer's point of view (Lusch & Vargo, 2014).
design (PD) and co-creation, sometimes blurs the boundaries. Although all of these approaches characterized by user involvement (Johnson, 1998) in a service and product design context (Bødker & Iversen, 2002; Kristensson, Magnusson, & Matthing, 2002; Nambisan and Baron, 2009), they have different focuses and design processes.
The dissimilarity between co-design and PD is also in the purpose of applying the design approaches. PD is often used for improvement in the workplace (Kaulio, 1998), which means it is more suitable for controlled changes. First, the types of participants involved in the process differ from co-design, participatory design and co-creation. Typically, PD undertakes the two significant roles of users and designers (Robertson, Simonsen, & Simonsen, 2012); co-creation values customers and suppliers (Payne, Storbacka, & Frow, 2008); co-design focusing on design something that involves users and other specialized stakeholders. Second, PD assumes that some participants (mostly designers) are more critical than others. Designers play a role of guiding participants towards their ideal and away from what they perceive as obstacles (Kaulio, 1998); co-design and co-creation trust all participants for the quality, and thrives original ideas and innovation (Kristensson, Magnusson, & Matthing, 2002). Besides the comparison between collective design approaches and co-design, the human-centred design is also dissimilar with co-design. Fundamentally, UCD does not directly involve stakeholders in the design process. Moreover, UCD firmly steers designers to develop suitable design solutions for end-users, while co-design is more like a set of creative techniques to inspire the design process.
2.1.2 Benefits and risks of co-design
Co-design has been appreciated for empowering a design team with a combination of two sets of knowledge. It brings customer insights into latent user needs, and in-house professionals’ conversion of promising new ideas into viable concepts (Trischler, Pervan, Kelly, & Scott, 2018). Trischler and colleagues made a real-world comparison of design concepts generated by co-design teams with those generated by an in-house professional team and a team solely made up of users in the course of a library service ideation contest. The empirical results indicate that co-collective teams generate concepts that score significantly higher in user benefit and novelty. In the field of corporate product manufacturing, the positive results highlight co-design as an “overlapping approach” in “the earlier delivery of a higher quality product to the consumer than the serial approach” (Bruce & Bessant, 2002, p119). Second, by being engaged in the process of change, people can actively contribute to the solution of their problems (Kaulio, 1998). This feature benefits two sides. On the one hand, it allows design teams early resolve disputes before the development process has gone too far (Bruce & Bessant, 2002). On the other hand, technology or designs can be made more suitable for users (DiSalvo, Lodato, Fries, Schechter, & Barnwell, 2011). Third, the benefits of adopting a collective design method, for the technology users, include higher satisfaction and a better fit between the technology and the users’ needs (Steen, Manschot, & Koning, 2011).
(Dong, 2005). Earlier studies have investigated the reasons why creating ‘shared understanding’ between stakeholders who are from different disciplines and have different backgrounds, interests and perspectives on the new design can be challenging (Bond & Ricci, 1992; Dougherty, 1992). To investigate into the reasons, the study of Kleinsmann and Valkenburg (2008) provides insight into how ‘actors', a.k.a. participants, in a multidisciplinary design team, dealt with their mutual
differences.
Second, design teams need to select stakeholders involved in the design process carefully. Recent research focuses on ‘lead users’ in co-creative activities. Those users are consumers who are into initiate things and sharing their approaches to others (Sanders & Stappers, 2008) so that they can provide "new product concept and design data" (Von Hippel, 1986, p791). Lead users are an essential source of innovative, contributing to profitable new product and service opportunities (Carbonell, Rodriguez‐Escudero, & Pujari, 2012). Von Hippel (2005) and Seybold (2006), however, questioned the representativeness of an elite group of the majority, and its effect on the design process. The function and impact of the ‘lead role’ inside co-design teams are still unclear.
Last, co-design may “lengthen the product development and planning stages” (Bruce & Bessant, 2002, p119). Besides lower in feasibility, the challenges indicate a need for constructing an active design working pattern that can shorten planning time with some universal-shared disciplines.
2.2 User support
User support as a kind of user services plays a vital role in product design. Users’ evaluations of user support can affect their evaluations of that product and even of the company behind it (De Jong, Yang, & Karreman, 2017). In this study, the definition of ‘user support’ is more close to technical communication domain, referring to user documentation, instructional materials, system support.
For decades, technical communication professionals have been working on optimizing user
instructions (Van der Meij, Karreman, & Steehouder, 2009). Scholars highlighted research topics of documentation structure (e.g., streamlined procedure; Farkas, 1999), content (e.g., minimalism reconstructing; Carroll, 1997), style (e.g., the English style guide for translatable documentation; Kohl, 2008), and design (e.g. agile design documentation; Selic, 2009).
With flourishing innovative IT products in the new era, the focus of product design recently has shifted from usability research (e.g., Guillemette, 1989) to user experience research (e.g., Caddick & Cable, 2011), aiming for minimizing user’s cognitive overload and enhancing the experience. Battarbee and Koskinen (2005) reviewed three approaches to user experience that focus on
individuals having the experience, and noted a missing perspective of ‘experiences that are created together with others’. Few existing research explores designers experience in the process.
The trend inspires some scholars in user support domain to focus on practical evaluation of different types of user supports, e.g., using instructional video to deliver information of software tasks (Van der Meij & Van der Meij, 2013). However, research on the influence of different design processes in developing user support is not sufficient.
2.2.1 User support and design process
situations; other unfruitful attempts were made to observe designers at work by analyzing sketches but not a “knowledge of mental process the designer goes through” (p.37). Thus, asking designers to recall their processes may get closer to what happened. However, this method bears the risks of some ‘over-simplified’ descriptions and missing non-verbal process. Scholars rarely conduct studies focusing on real-time interaction in design processes.
Previous researchers in software design have examined the usefulness of design pattern
documentation in program maintenance through controlled experiments (Prechelt, Unger-Lamprecht, Philippsen, & Tichy, 2002, p595). Using design patterns ("a proven solution to a software design problem to make the solution reusable”) is claimed to improve programmer productivity and software quality. However, questions related to how a design process influence working efficiency, and how the design team perceive satisfaction internally, are still unknown.
In technical communication domain, the design process of developing user support has been rarely researched as a topic, except some unsystematic web posts and blogs. In practice, producing documentation is considered necessary but sometimes unpleasant chore (Selic, 2009), especially in software and other engineering disciplines. In order to fit in with the fast development pace, companies that provide technical documentation and related user support services nowadays adopt agile development for shortening the delivery time (Selic, 2009). Technical writers construct manual information mainly by themselves with original technical contents provided by technicians or experts. This task is difficult even when experts are available to guide and instruct the novice. Considering pressures and constrains, staffs from the marketing department, sometimes play a role of target users for technical writers to profiling user personas and testing usability.
2.2.2 User support design process and co-design
In today's information and communication society, the role of users is becoming more active. They do not only use software but also get involved in creating or modifying it (Ardito, Buono, Costabile, Lanzilotti, & Piccinno, 2012). They are no longer passive readers who are referring user support but are a more active role of producing information. Thus, while producing documentation comes at a cost, a proper investment may pay off substantially in the future. The collective approach of co-design seems feasible in the context of user support. With this approach, it is a curious topic to involve multiple stakeholders in a design process and investigate its impact on design teams and individual participant.
Therefore, a study has been carried out to explore the potential effect of the co-design approach on working efficiency and satisfaction, in the domain of user support development process. In the research, a quick start guide has been chosen as the type of user support, and co-designstakeholders
refer to the cooperation among users, technical writers, and field experts. The research questions are addressed as follows: In the design process of creating a quick start guide:
Research Question 1: Will the co-design approach improve working efficiency?
RQ 1.1: Will the co-design approach improve team working efficiency?
RQ 1.2: Will co-design approach improve individual contribution?
RQ 2.1: Will the co-design approach improve overall team satisfaction?
RQ 2.2: Will the co-design approach improve individual satisfaction?
RQ 2.3: Will the co-design approach improve designers satisfaction with the product?
3. METHOD
This chapter describes the methodology. A qualitative research method has been applied with direct observations and interviews in three comparison groups.
3.1 Design of study
A comparison study was designed for simulating design processes in real-world user support development. Three sets of comparison groups, regarding the general approach and co-design approach, were arranged in a university laboratory for creating a quick start guide.
With three design teams in each type of group, one design team consisted three participants: a user, a writer, and an expert, who were arranged carefully with a balance of gender, major, technical
experience and education background.
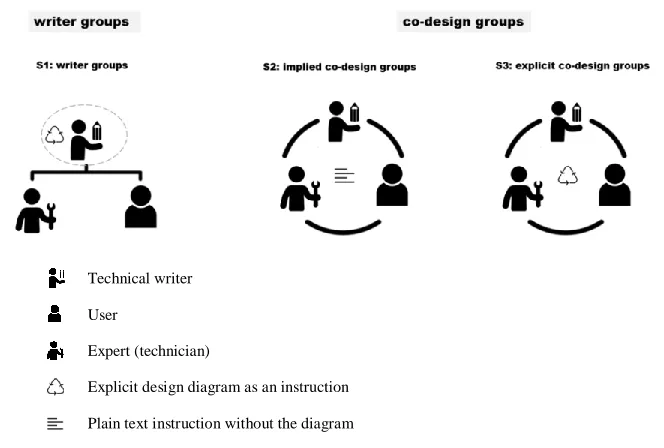
Three groups were requested to use two different design approach. The study named one group with a general design approach as S1 writer group and named two groups using co-design approach as co-design groups. Inside co-design groups, two comparison groups were called S2 implied co-design group and S3 explicit co-design group. The comparison variables are demonstrated in Figure 2.
Technical writer
User
Expert (technician)
Explicit design diagram as an instruction
[image:16.595.121.453.443.667.2]Plain text instruction without the diagram
Figure 2. Comparison groups and working method
Secondly, in order to explore the impact of different design sequences of co-design approach on the results, within co-design groups, two types of co-design groups were given different instructions: an explicit design diagram for one group, and a plain text describing tasks of each role for the other group. Teams in the former group were called S3explicit co-design teams, and in the latter one were called S2 implied co-design teams.
The purpose of showing the diagram was to inspire the group to work in their unique ways with a more relaxed start. The design cycle in the diagram indicated three working phases, which was adopted by the researcher based on HCD and co-design approaches (see Appendix B instructions for the design cycle). As for the S2 implied co-design group, they were informed with the same amount of information of the design approach, but without visualized design phases as the other one did. All groups were asked to describe their design methods in the post interviews.
Besides, to avoid potential misleading of the name ‘technical writer’, the name of the writer role was changed in S1 writer group and S2, S3 co-design groups. In the S1 groups, the name of the writer was called “technical writer”. In co-design groups, the role was called technical communicators.
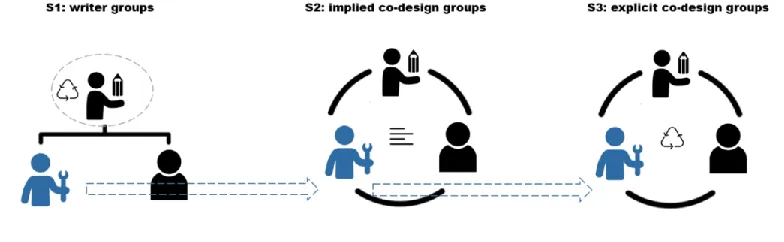
[image:17.595.102.494.428.549.2]‘Communicator’ was a role that was expected to be more cooperative, breaking a hidden stereotype of the writers who should take in charge with the writing part in the design process. Each expert was trained by staff from the BMS LAB (a laboratory focus on bringing technology into social science research) in the university before the study carried out. They were arranged to join three teams of each comparison group with a fixed sequence: from S1 writer group to S2 implied group, and finally to S3 explicit co-design group (see Figure 3). The interval days in participating in a different study was relatively the same.
Figure 3. Experts experienced a fixed sequence of comparison groups
In the study, design processes were recorded and observed by the researcher without interrupting the participants. A semi-structured interview was constructed by themes and sub-questions and was conducted to each participant after the design process finished. Data collected from observations and interviews were analysed from the team and individual views on working efficiency and satisfaction.
3.2 Participants
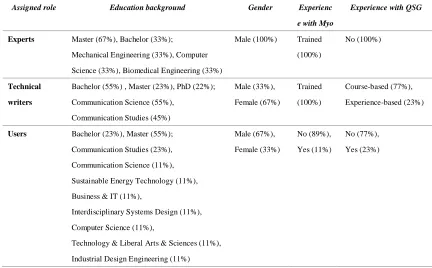
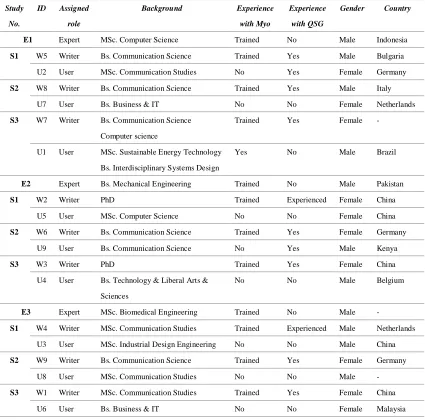
Twenty-one participants were recruited voluntarily from the University of Twente. Table 1 provides general geographic information of the participants, see Appendix A for detailed geographic
Table 1
General Participants Geographic Information
Assigned role Education background Gender Experienc
e with Myo
Experience with QSG
Experts Master (67%), Bachelor (33%);
Mechanical Engineering (33%), Computer Science (33%), Biomedical Engineering (33%)
Male (100%) Trained (100%)
No (100%)
Technical writers
Bachelor (55%) , Master (23%), PhD (22%); Communication Science (55%),
Communication Studies (45%)
Male (33%), Female (67%) Trained (100%) Course-based (77%), Experience-based (23%)
Users Bachelor (23%), Master (55%); Communication Studies (23%), Communication Science (11%), Sustainable Energy Technology (11%), Business & IT (11%),
Interdisciplinary Systems Design (11%), Computer Science (11%),
Technology & Liberal Arts & Sciences (11%), Industrial Design Engineering (11%)
Male (67%), Female (33%) No (89%), Yes (11%) No (77%), Yes (23%)
In order to build a team based on the co-design approach, the participants were recruited in three roles: users, experts, and technical writers. Nine users had a different demographic and educational background. For them, experience with the device or design approaches were not required. Nine participants as technical writers were recruited from the Communication Studies programs of the Behavioural, Management and Social Science faculty. They understood the human-centred design method and had particular experience in creating user support. They received official technical documentation of the device and got familiar with the armband Myo one week before the experiment. Considering difficulties (e.g., the device and training constraints) to find each design team a different expert, who has possessed enough knowledge and skills to guide a team from technician’s
perspective, the number of experts were compromised from nine to three. Three experts were recruited from the technical faculties. They acquired sufficient knowledge and skills about gesture control and the device after three-hour training one week before the study started.
3.3 Procedure
The comparison study was conducted in individual sessions in separate, quiet rooms at the university campus. Each study lasts for around two hours, including briefings, designing task, followed-up individual interviewing and debriefing.
participants. All participants completed the informed consent procedure for permission of recording during design processes and interview sections before started.
Each group was required to design a Quick Start Guide (digital version) for Myo. Myo is an innovative gadget that let users control technology with hand gestures wirelessly by reading the electrical activity of their muscles and the motion of the arms. It is an excellent sensor for presentations by controlling the presentation software with gestures and motion.
The design task was using this gesture control armband to control presentation slides in university settings. The design process of the Quick Start Guide was set as 80 minutes in total. Each team handed in their products for further evaluation. During their design process, the Go-Pro camera recorded their performance, and observation sheets were made simultaneously by the researcher. Semi-structured individual interviews took approximately 10 minutes each, counting to 30 minutes for a team. Finally, a short de-briefing was held for teams needed.
3.4 Measures
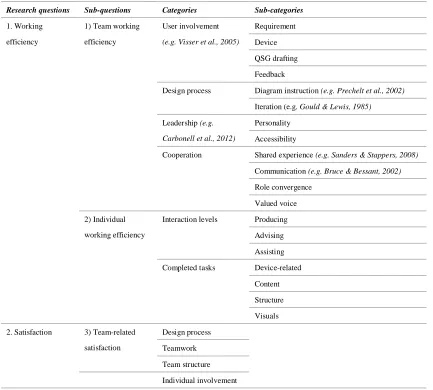
[image:19.595.84.517.375.765.2]Table 2 outlines the main relevant factors used for comparing efficiency and satisfaction.
Table 2
Factors Related to Working Efficiency and Satisfaction
Research questions Sub-questions Categories Sub-categories
1. Working efficiency
1) Team working efficiency
User involvement (e.g. Visser et al., 2005)
Requirement
Device QSG drafting Feedback
Design process Diagram instruction (e.g. Prechelt et al., 2002) Iteration (e.g. Gould & Lewis, 1985) Leadership (e.g.
Carbonell et al., 2012)
Personality Accessibility
Cooperation Shared experience (e.g. Sanders & Stappers, 2008)
Communication (e.g. Bruce & Bessant, 2002) Role convergence
Valued voice 2) Individual
working efficiency
Interaction levels Producing Advising
Assisting Completed tasks Device-related
Content Structure Visuals 2. Satisfaction 3) Team-related
satisfaction
Design process Teamwork
4) Individual-related satisfaction
Individual contribution
5) Product-related satisfaction (e.g. Bruce &
Bessant, 2002)
User-friendliness Content
Structure Visuals
For team efficiency, time of completing each phase and the final design was counted in the observation. Furthermore, the factors in four categories, i.e., user involvement, design process,
leadership and cooperation, were compared among the three comparison groups. For individuals, their working efficiency was noted by interaction levels and tasks, according to observations and their recalls in interviews. Some of the categories and sub-categories referred to relevant literature.
For satisfaction, it was compared from perspectives of team, individual and product with
sub-categories. For example, team-related satisfaction was compared from the design process, teamwork, and team structure.
Besides those comparable factors related to research questions, the design pattern for the comparison groups, S1 writer group and S3 explicit co-design group, were sketched based on observations and recalled of the video records of the design process
3.5 Data analysis
The study applied a qualitative method for analysing data collected from interviews. The recorded audios were transcribed first. After a check of the transcripts, the coding process started in the software ATLAS.ti. Codes were developed from theory and emerged from raw-data. The draft of structural codes was generated from the first-round coding of five transcripts chosen randomly. With necessitate repeated examinations in the iterative process, finally, 94 codes developed and constructed the codebook (see Appendix F). A second coder was invited to code three transcripts (accounting for 11 per cent of the total number) chosen randomly from the transcripts. The codebook was assessed by Cohen's kappa which resulted in a substantial agreement between the two coders' judgements, κ = .76.
4. RESULTS
This chapter presents the results collected from observation and interviews in the empirical studies. Analysis was made regarding team working efficiency, team satisfaction, personal efficiency, personal satisfaction.
4.1 Observation results
4.1.1 Time-to-complete
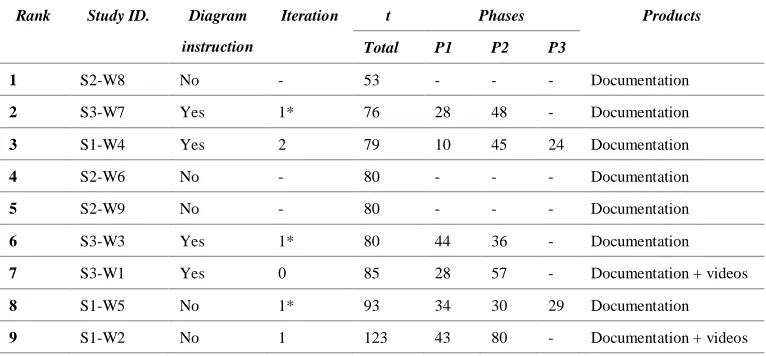
In Table 3, the rank of nine design teams based on an overall time they spent before submitting products. The time of completing each phase is also tracked, which does not apply to S2 implied co-design group. Besides, information about iteration and types of product is noted.
[image:21.595.107.490.346.524.2]Timewise, generally, the co-design groups completed the quick start guide faster than the writer groups. Moreover, S2 implied co-design teams, which did not receive the instruction of the design diagram, finished their design quicker than S3 explicit groups did. Two S1 writer teams requested for extra time because the writers failed to finish a draft within 80 minutes; one S1 writer group finished design processes within the time range without involving the expert in the group at all. All of S2 implied co-design teams completed the guide in time. The fastest group, S2-W8, completed the design in 53 minutes with three feedback sessions. All S3 explicit co-design teams submitted the guides nearly in time but none of them “completed” the third phase: feedback and testing. This session had been integrated with the second phase by the participants according to observation.
Table 3
Time-to-complete of Nine Design Teams
Rank Study ID. Diagram
instruction
Iteration t Phases Products
Total P1 P2 P3
1 S2-W8 No - 53 - - - Documentation
2 S3-W7 Yes 1* 76 28 48 - Documentation
3 S1-W4 Yes 2 79 10 45 24 Documentation
4 S2-W6 No - 80 - - - Documentation
5 S2-W9 No - 80 - - - Documentation
6 S3-W3 Yes 1* 80 44 36 - Documentation
7 S3-W1 Yes 0 85 28 57 - Documentation + videos
8 S1-W5 No 1* 93 34 30 29 Documentation
9 S1-W2 No 1 123 43 80 - Documentation + videos
Note. S1=writer’s group, S2=implied co-design group, S3=explicit co-design group; W1=technical writer ID W1; Design cycle refers to either a group receive the design cycle diagram in the instruction; t=time-to-complete the design (minutes); iteration=a group completed three phases based on the design cycle in the instruction, not applicable for S2, 0=not completed, 1=completed one iteration, 1*=completed one iteration but with Phase 2 and Phase 3 merged together.
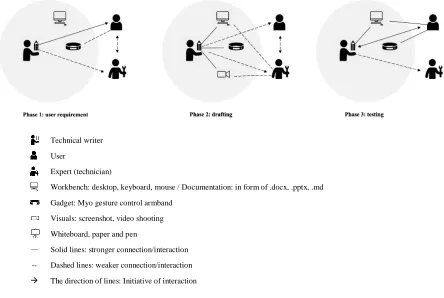
4.1.2 Conceptual interaction diagrams
Figure 4 and Figure 5 demonstrate the working mode of S1 writer group and S3 co-design group,
respectively. The conceptual diagrams present two categories of interactions: intra-team interaction among three roles; human interaction with the devices such as with the gesture control armband Myo. It is hard to generalise interaction pattern for S2 implied co-design teams because their design
processes are substantially dissimilar. For a detailed comparison between each S1 and three S3 groups, see Appendix G for participants interaction in each phase.
Technical writer User
Expert (technician)
Workbench: desktop, keyboard, mouse / Documentation: in form of .docx, .pptx, .md Gadget: Myo gesture control armband
Visuals: screenshot, video shooting Whiteboard, paper and pen
— Solid lines: stronger connection/interaction -- Dashed lines: weaker connection/interaction
[image:22.595.72.516.190.488.2]→ The direction of lines: Initiative of interaction
Figure 4. Conceptual interaction diagram of S1 writer group
In the S1 writers’ group (Figure 4), the interaction lines feature in a one-way direction, which testifies the writers were more active and dominating than others in design processes. The interactions
initiated by the writers to the other two roles. Started from Phase 1, the writers initiated requirement analysis by interviewing users. A solid arrow demonstrates a closer interaction between writers and users. Only with the requests from the writers, the experts explained the use of the Myo device to users so that a dashed line connects users and experts. The users sometimes were requested to try the Myo on. In Phase 2, the drafting phase, the writers took the entire design tasks and worked
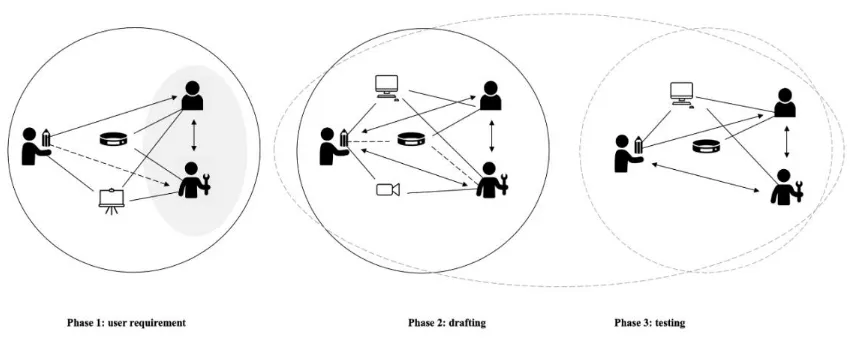
Figure 5. Conceptual interaction diagram of S3 explicit co-design group
S3 explicit co-design teams worked differently with intensive interactions in Figure 5. Three roles contributed equally to the quick start guides with their expertise. In general, the writers and experts were relatively more active and collaborated more intense than with the users. Unlike the S1 groups, these co-design groups preferred to use the whiteboard for brainstorming than to use the computer, especially in the first phase. In Phase 1, the experts focused on Myo demonstrations while the writers collected user requirements; the users responded to them and actively tried on the Myo. More
specifically, the experts and users were more out-spoken because the writers frequently observed their interactions with the device, and noted down primary concerns on the whiteboard quietly. In Phase 2 and Phase 3, the co-design groups mixed the tasks of drafting and testing the guide. Therefore, the drafting session naturally consisted of the user testing part: the writers and experts performed as different levels of users. At the same time, everyone was performed as a writer, different but a better version of the writer. The users and experts continuously added detailed changes to the guide from their distinctive perspectives, which covering content, language, wording, structure and visuals. When disagreement happened, the writers balanced the needs of both roles.
Teams in S2 implied group cooperated more flexibly because their instructions did not frame them with fixed design phases. They started in their particular ways from the beginning: some teams started with a brainstorming session, drawing structures on the whiteboard, other teams started directly with an expert demonstration and then listed their structure in Google docs. The team members separated their tasks based on their assigned roles as well as personalities. In those groups, the interactions were intense that messages always transmitted to the right person at the right time directly. There were disputes, but they were solved quickly by seamless communication.
4.2 Interview results
The interview results include quotations analysed from those transcripts of 27 interview transcripts. The results are in the following discussed in four main categories: 1) team working efficiency, 2) individual working efficiency, 3) satisfaction with the team-related, individual-related, and product-related factors and 4) critical reflection.
The first two categories focus on Research Question 1 (working efficiency), and the third category responds to Research Question 2 (satisfaction), both from the team and individual levels. Within team working efficiency, user involvement (see 4.2.5 for comparing user involvement), leadership,
cooperation, and design mode are the four elements that associate with team efficiency. As for individual working efficiency, the codes reflect the contribution tasks and levels of each role in a team. In the satisfaction category, team-wise, individual-wise, and product-wise evaluations from participants are summarized. The last category reviews some valuable reflections from participants, including the future improvements of the design and constrains factors of the study.
4.2.1 Team working efficiency
In this study, ‘working efficiency’ is defined as productivity in the design process. For S1 writer group, it means how efficient the writers worked during the process; for S2 and S3 co-design groups, it means how efficient the team worked. Criteria of leadership, cooperation and designmode are contributing to the overall working efficiency of the design.
In general, the working efficiency decreased from S2 implied co-design group to S3 explicit co-design group, to S1 writer group. Although co-design groups were critical when it came to their efficiency, overall, they were pretty pleased with productivity. Basically, “the writer and also the expert can directly get necessary input from the user to make a guide (S2-W8-E1)” Especially S2 teams, i.e., co-design teams without an explicit co-design diagram rated their effectiveness with high scores. S3 explicit co-design teams stressed that their efficiency was not maximum because the strict and parallel task-division cut them from a natural working way. As for the S1 writer teams, the comments were neutral and negative. Even they received the same design diagram instructions as the explicit co-design group
did, the distance between the writers and the user, the expert, decrease the efficiency.
Leadership
If the instruction assigns a participant with a dominant role, how will this role change in the process? Among nine teams, there were two unusual cases: one S1 writer team which the writer shared her role to the expert and the user; one S3 co-design team which the user and expert took charge of the whole process, the technical communicator was not well performed.
Participants reasoned this strange role-changing phenomenon with two factors: personality and knowhow. The latter factor is mainly related to the expert, especially in the last stage of study: S3. Due to the accumulated experience, the experts tend to point fingers, and even natural took control of the drafting process in his third study (explicit co-design). At the same time, if the technical writer in this team is a “person if someone took in charge then maybe I would just wait and see (S3-W3)”, the crown of the technical communicator would be easily handed over to others.
drafting process. This decision caused a severe consequence: failed to finish at the end even with extended time.
Apart from the above two extreme cases, generally writers took the lead in S1 writer group; three roles converged into one with increasingly equal contribution to the guides, or the leader’s role shifted in different phases in S2 and S3 co-design groups.
Cooperation
Cooperation is closely associated with the working efficiency during the process of creating a quick start guide. Once voices were valued (valued voice), the satisfaction of the speaker increased. Excellent communication directly contributed to high efficiency. Shared responsibility, expertise sharing and communication elements could influence the team efficiency positively or negatively.
Again in the unusual case S1-W2, when the writer realised only a few minutes before making the instruction video, the writer handed over these tasks entirely to the expert and user. The general writer team strangely became a co-design design team. In the interview, the writer admitted that she felt the working efficiency had boosted in the video shooting session with help from the other two.
In the co-design group, cooperation could be a double-edged sword. The pros are easy to be identified from the quotations: collective intelligence and circumvent weaknesses. On the one hand, the teams benefited from this collective working method. One user stated as follows:
“Different perspective, different knowledge. So you can compare one to the other. I mean, for example, if the writer had to have the same knowledge as the expert, it would have taken her more hours to study all this stuff and how it works. But, yeah, here we only saw that the expert said a few things, but it takes a lot of time that you don't see.” (S2-U9)
In co-design groups, roles shifted in different phases, especially in S2 implied co-design groups. One technical communicator gave an accurate summary of this trend as follows:
“I think it was turn-wise. Like at the beginning, the expert, he took more of control because it was for the user to understand the device. So I didn't have anything to talk about. And then when the process was finished, everyone on the same page about the product. I think I took a bit over about my views and my ideas for the user guide. So I think it was a ping pong kind of... you know, everyone had to have the space to talk, and we did that. No one was holding back.” (S2-W)
While three roles were sharing expertise in their field, the function of a technical communicator was extra special. This role functioned as a middle ground for the ideas between the experts and the users. Such a right balance increase the working efficiency, which has been illustrated in details in the discussion section.
On the other hand, the cons are evident as well. Without excellent communication, the converged role
Design mode
For S1 and S3 comparison groups, the design diagram provided a good starting point for participants to carry out the design. While being questioned about “Without a starting point, will that be more effective if let you guys figure out by yourself?” All participants believed it would have taken more time. For example, the following quotation stressed their ideas about this: “I think it would have just taken more time and some of the stuff on that wouldn't be on that.” (S3-E)
The design diagram in instructions also made the design process more goal-oriented as well as
connected every participant in the team on the same page. Participants in S3 co-design group said “the diagrams definitely helped” because they knew what the goal was and where to started. “And the roles were divided into steps and sub-steps, and every one had its role during each step, which told us when to say things or when not to say things,” said by one expert in an S3 team. Once they “followed all the steps and nobody talked too much, or no didn't have less input. Everybody was on the same page, and everybody followed the same cruise of action. So we were really focused,” added by writers.
However, participants held different views to the diagram instruction: whether a diagram should be configured in rigid and restricted phases. Some participants complained that their natural process had been interrupted by following every task of the instructions. For example, experts in S3 group critically reflected on the design cycle they received: “However, on the other hand, I feel like when we are forced to follow some strict phases, we are too rigid on the execution. It's not really natural.” However, technical writers were looking for even more detailed task divisions in each phase. It has been further explained in 4.2.5 Critical reflection section.
4.2.2 Individual working efficiency
‘Individual working efficiency’ was decided by the level and tasks a person contributed during the same period. It was challenging to identify who worked efficiently by observation, especially in a team of three. Low efficiency of one participant could probably be the maximum efficiency of others. First, it is associated with the team efficiency. An overall high individual working efficiency in the team leads to relatively higher team efficiency. Second, it contributed to personal satisfaction (see 4.2.3 Satisfaction).
In order to recur the personal contribution, two sub-categories were used in the coding process:
contribution levels; contribution tasks. Due to the time constraints of the interviews, the personal performance was not covered completely. Therefore, the results of personal efficiency also came from the observation sheets.
Contribution levels
Producing, advising and assisting represent three degrees of contribution levels.
together to generate the content and structure than with users. In particular cases, however, users dominated the design process as a team leader and contributed the most to the product.
Advising is the most active level among those three levels. It refers to oral advice from whom did not directly ‘touch’ the facilities. In S1 writer group, the users and experts responded to their writers immediately. However, they did not contribute actively in most cases because they hardly answered something exceeding the question from the writers. In S2 and S3 co-design group, once the experts and users actively participated in the process, they continuously advise on the product, which was grouped as a “producing” with the same effect. That also explained why the S3 co-design group that had close cooperation but a relatively low advising level: most of them input orally to the guides.
Assisting refers to assistance on devices. In most cases, it was an effective way of contribution. However, the motivation of assistances was different in the S1 writer group and S2 and S3 co-design group. In S1 group, users or experts were inert until the writer asked them to ‘put on the armband and try' or to ‘give instruction in instruction videos'. The S2 and S3 participants were actively offered help when they noticed the team met difficulties.
Contribution tasks
The tasks measuring individual contribution are related to the device and product. Specifically, they are from perspectives of the device (Myo armband, cameras, whiteboards), content (language,
wording, technical details), structure, and visuals (picture, video, layout editing). In co-design groups, the whiteboard belongs to devise class, which for brainstorming among team members.
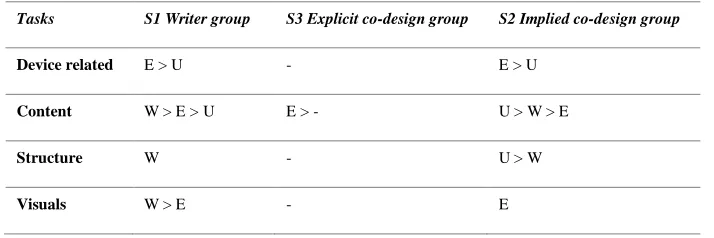
[image:27.595.121.478.524.643.2]Overall, the technical writers achieved higher contribution in S1 writer group and performed their expertise in S2 and S3 co-design groups. The experts and users contributed more to co-design groups. In extreme cases, they even dominated the process. One S3 writer complained, “I think the one who is dominant is the user, and then is the technical and technical guy.”
Table 4.
Roles Contribution Tasks in S1, S2, & S3 groups
Tasks S1 Writer group S3 Explicit co-design group S2 Implied co-design group
Device related E > U - E > U
Content W > E > U E > - U > W > E
Structure W - U > W
Visuals W > E - E
Note. W=writer/technical communicator, U=user, E=expert; - = a relatively equal contribution, > = A contributed more than B.
4.2.3 Satisfaction
In order to define the abstract satisfaction, the study measures satisfaction from those aspects: satisfaction to the process,teamwork, team structure for the team level (from S2 and S3 co-design groups); satisfaction to process, personal, and product for personal satisfaction were collected from all groups (S1, S2 and S3).
Satisfaction with the design process
Overall, S2 implied co-design group had the highest satisfaction to the process, and the attitudes from
S1 writer group became moderate and negative.
In S1 writer group, the users and experts expected a higher involvement before they realised their actual participation was quite limited in the processes, which decreased their satisfaction. One expert from S1 group said: “Next time, I really want to be involved. That’s bothered me a little bit.” In S2 and S3 co-design groups, most participants rated the process ‘fun’, ‘nice’, and ‘smooth’. According to
two-third of the experts thought they enjoyed the co-design groups more than the writer groups.
However, high involvement of every stakeholder sometimes was troublesome. One S3 expert complained about “the user made the unnecessary movements (of the Myo) in some processes”, which interrupted the writing tasks he and the writer were focusing upon.
Satisfaction with teamwork
Satisfaction with teamwork highlights participants’ feeling of intra-team cooperation. It did not apply to the S1 writer group because those groups performed not in a team manner but writer-centred working mode. The results were significant that most of the participants enjoyed their teamwork in a co-design team. There is a no significant difference between S2 implied group and S3 explicit co-designgroup.
The reasons participants felt satisfied first vary from the roles. Users felt happy about the teamwork because they got to work with strangers and to meet new people. One participant said, “it was
interesting because we work with people who never worked before and then started also feeling out of it that the different types of personalities they are.” Technical writers satisfaction towards teamwork
was related to their personal productivity. For example, one writer said she was super satisfied with the teamwork because they “formulated nice clean requirements.” Experts valued their satisfaction from perspectives of involvement and practical inputs. One expert mentioned: “I think most of us also covered our tasks pretty much.”
Secondly, a pleasant working vibe contributed to teamwork satisfaction. Notably, the users felt more satisfied with S2 and S3 co-design groups. Their comments on the co-design teamwork were like “a
calm vibe and a nice environment to work in”, or some “nice guys to get along really well”.
Therefore, thirdly, the personal characteristics of team members contributed to teamwork satisfaction. Especially for the experts, a kind technical writer in the team would be a blessing.
The neutral comments from S2 group on teamwork were classified in involvement (4.2.5) and team structure (4.2.3) as well. First, one user from S2 teams complained that he did not try the Myo armband on as a user during the entire process, “I was satisfied, but I would have liked to try the device more and then based on that, instead of imagination.” Second, influenced by expertise sharing
others’ could be less likely to be accepted. In S3-W3, the expert refused to follow one solution of the technical writer. However, in the later stage, the expert found out the solution was better and would have solved their problem faster. “We were interactive,” said the expert E3, “but the organisation could have been better.” Third, teamwork satisfaction related to the team structure. The expert E3 mentioned he wanted to have more hierarchy in the team. It is illustrated in the next part: team structure.
Satisfaction with team structure
The team structure satisfaction is from participants’ overall contentment of the way their team formed. It is partly connected with the improvement (see 4.2.5 for future improvement): some of the results are critical about the team building, such as the number of users the team. It does not apply to
S1 writer group. Most of the S2 implied and S3 explicit co-designteams spoke highly of their team structure, but there are a slight difference between S2 implied and S3 explicit co-designgroups that S2 group had more neutral reflections on their parallel team structure than S3.
Positively, the most mentioned reason by design groups was that the team benefited from the co-design structure: equally involved all stakeholders and maximised individual expertise. “Three people is a good balance because each role has one representative”, concluded by one writer from S2 group. Most of the feedback from the co-design groups are positive. Their words accurately describe the benefit a team acquired from a co-design method like the following:
“… Because sometimes the user cannot translate exactly what he means. Yet the user is not experienced enough sometimes to translate it into a manual. And the expert, even though if it is a real expert, he doesn't have the sensitivity of non-experience users. So he will say: ‘Oh, no, this is irrelevant.’ I think having those aspects is very good, but you need a link between those, so communication expertise is the link.” (S3-U1)
In S2 and S3 co-design groups,the difference in team structure satisfaction was on the degree of the cooperation. One S2 expert (S2-E3), whose team did not receive diagram instruction, pointed about that their working structure was entirely parallel and he would want “a bit more hierarchy”. The reason was although “there are positive sides of each role”, “we also need to consider which role might be the best for this stage” during three phases of quick start guide creation. He continued stressing that “if we choose and stick with one role, I do think that there is going to be complete and more fulfilled than if we chose this rather parallel system.” It also testified that diagram instruction could be influential (refers to 4.2.5).
Individual satisfaction
Individual satisfaction is how content a participant is with his or her work in the design process. It applied in all group types. The quotations featured in ‘cooperation’, ‘personal contribution’, along with participants’ background, influenced individual satisfaction. Overall, the results indicate that participants in co-design teams achieved higher personal satisfaction compared with the participants in writer groups. Within the co-design groups, S2 implied co-design group perceived a higher individual satisfaction than S3 explicit co-design group.
could have completed the task better and designed a better version of the guide. Among their self-evaluations, one writer said, “I didn't have a clear structure before that, like how to do it.” Second, three experts in S1 group were entirely not satisfied with their input. Due to the unbalanced team structure, the experts said they were hesitated to step in when they found the writer encounter difficulties. The expert E3 explained, “I did not that cooperate, although I tried to be as much as an expert as I could, and I tried to make notes of these things. I do think that I could have stepped in, but I did not do this.” Third, the users’ satisfaction was low because of limited involvement. One user complained, “I’d like to be more involved in the process of making instructions, and maybe… do more things at the same time, because now I just sit there. Too bad.” In S3 explicit co-design group, the writers and experts polarized personal satisfaction. The technical writers were not satisfied with their working efficiency while the experts felt very satisfied with their increased input. The
participants in the S2 implied co-design group relatively felt more satisfied with their individual work. The differences among the roles are significant. The writers’ satisfaction in the S1 and S3 co-design groups was comparatively the same, but notably higher in S2 group with less negative feelings to individual work. The users’ enjoyed the process more in co-design teams, especially when they had enough time to operate the device. The experts’ satisfaction increased significantly from S1 to S3. Two of the three experts mentioned that they were the most satisfied in S3 group because they achieved their highest contribution. The expert E2 concluded his last study, “I do think that I did tell most of my experiences, most of my hints. I communicated my insights for this which did help the user, maybe also that the writer.”
Satisfaction with product
Participants evaluated their quick start guides from the perspectives of user-friendliness, content,
structure and visuals. Moreover, everyone gave an overall satisfaction with the product. Therefore,
product satisfaction in this study only related to self-evaluation from the participants on the quick start guide their team designed.
The overall satisfaction mostly decided by the completeness of the product. When the team completed the guides within the time, participants felt satisfied with their product no matter which group. One typical quotation for this was: “It was ended up being rows because we do have time, but content-wise is great. So I'm partially satisfied.” Otherwise, they thought, “it is difficult to say you are satisfied with something unfinished.”
Every expert experienced all three groups from S1, S2 to S3, and compared the differences among those groups. Their product satisfaction increased in the same order of the study sequence. Two-third of the experts said they were most satisfied with two S3 products, and one expert thought one S2 product was the best. The users’ satisfaction with the product was not significantly changed: they all satisfied with the product in their team because they were “the representative” of their target group. For them, the guide was a personalised manual. One S1 user appreciated the product that she can quickly get access to any gestures and any actions she wanted to perform with the guide and “it is user-friendly”.
one technical writer said, “I do think it is user-friendly because the information that's included is broken down. So it's only the most important things that the user has to know, in this situation, how to operate it. There’s no redundant information.”
As for content, the S3 explicit co-design group generated more contents compared with S1 writer group, according to the comments from experts, “Compared to the other times this time there were
more things added because there was included troubleshooting in this one as well.” The rest does not very much among the comparison groups.
As for structure, most of the results have the same structure because the task itself was a procedure task. There were groups (both in writer group and co-design groups) used bullet point to break down information, or to highlight paragraph blocks.
Last, as for visuals, almost every group did not have a chance to improve the designs because of time constraints. The visuals elements like ‘pictures’, ‘videos and ‘layout’ were frequently mentioned in quotations. For example, one S3 user said: “The design is not to be attractive or is not concise enough. Visually needs more development.”
4.2.5 Critical reflections
In addition to above comparable features, abundant critical quotations from the interviews were coded. Although they did not directly answer RQs, they are valuable for this study. Those quotations were categorized in reality constraints and future improvements. The constraints were primarily related to time pressure. The future improvements include user involvement, user numbers, expert involvement, design process and visuals.
User involvement
All groups mentioned a need for involving users more actively. However, the motivation for involving users vary from different groups.
In S1 writer group, most of the participants indicated a demand for higher involvement of users. For example, the user U2 in an S1 group was involved primarily in Phase 1 (user requirement collection) and Phase 3 (user feedbacks) invited by the writer. That could be accepted as a successful “user involvement” based on the human-centred design approach in the textbook. However, this user still felt she could have contributed more to the final product. Not only the users, the writers in S1, believed they could have involved the users more. One writer stressed, “I had one, a very important one, is more users, and doing it more often.” The technical writers also thought they could have selected the interview questions “more specific” for the target group during the requirement collection. It suggests a need for a better effort to keep the target users into consideration.
In S2 and S3 co-design groups, which provided an ideal theoretical environment for working together with users, the fact was that not all users were actively involved in the design process. Participants thought it was because, in the technical scenarios, the expertise of the technical writers and experts made them relatively dominant during the whole process. One extreme case was that one user even did not try the Myo armband on personally. The user could have asked for using it, but when he found ‘the technical writer worn the Myo’, he compromised and created his requirement based on
have contributed more by trying to ask for the device which “could have made it (product) better”. The technical writer and the expert in this group also noticed this problem during interviews. The writer reflected on this improvement, “I would definitely include more the user and ask him more questions. Then it makes it quicker. We will avoid mistakes that we made in writing like we could have started writing it as bullet points straight away not as texted form.” The expert said, “I might want the user to have some experience with the device so that they use it first.”
However, if the user took too much control during the design process, it would go out of track. In one
S3 explicit co-design team, the user was the actual leader of the whole team because of personality. The expert and technical writer acknowledged his contribution but believed this should not have been a standard case.
User numbers
Should a co-design team invite more users in the process? If so, how many users in a team would be the right balance when design a quick start guide? Most of S2 and S3 co-design groups considered one user good enough for the design team while some participants from S1 writer group requested to have more users.
Participants who thought one user was sufficient in the design process listed four reasons. One expert said in S3 interview, having one user in the team was reasonable because more users would decrease communication. He pointed out that, primarily, “the user was a writer as well. The thing is that when the group is larger; people tend to speak out less. People speak out less; they will be less direct.” Secondly, technical writers thought the writers and experts “ could have double roles”. Thirdly, one writer in an S3 team explained that a writer went through two levels (one user’s entry-level and one technical writer’s basic level), and an expert probably fully understood all the levels; she thought the writers and experts “can be as a part of the user group”. Last, increasing the number of users in the design process would make communication work of the technical writers even harder, which means they have to manage more people.
Others who proposed to invite more users in the design process mainly focused on usability testing phase. One S1 writer said to have an extra user for comparing “different uses” between two users in order to make sure the right direction. Moreover, many technical writers, no matter in which groups, mentioned having more users to do usability testing. One writer said: “You have one user with which you create the guide, and you have one or more users to test if the guide works.” For this second type of users, he suggested that “just let them try to do everything by their own only using the guides”. -
Expert involvement