http://wrap.warwick.ac.uk/
Original citation:
Crafts, Nicholas (2013) What does the 1930s’ experience tell us about the future of the Eurozone? Working Paper. Coventry, UK: Department of Economics, University of Warwick. (CAGE Online Working Paper Series).
Permanent WRAP url:
http://wrap.warwick.ac.uk/59232 Copyright and reuse:
The Warwick Research Archive Portal (WRAP) makes this work of researchers of the University of Warwick available open access under the following conditions. Copyright © and all moral rights to the version of the paper presented here belong to the individual author(s) and/or other copyright owners. To the extent reasonable and practicable the material made available in WRAP has been checked for eligibility before being made available.
Copies of full items can be used for personal research or study, educational, or not-for-profit purposes without prior permission or charge. Provided that the authors, title and full bibliographic details are credited, a hyperlink and/or URL is given for the original metadata page and the content is not changed in any way.
A note on versions:
The version presented here is a working paper or pre-print that may be later published elsewhere. If a published version is known of, the above WRAP url will contain details on finding it.
WORKING PAPER SERIES
Centre for Competitive Advantage in the Global Economy
Department of Economics
July 2013
No.142
What Does the 1930s’ Experience Tell Us about the Future of
the Eurozone?
Nicholas Crafts
What Does the 1930s’ Experience Tell Us about the Future of the Eurozone?
Nicholas Crafts
CAGE, University of Warwick
June 2013
Abstract
If the Eurozone follows the precedent of the 1930s, it will not survive. The attractions of escaping from the gold standard then were massive and they point to a strategy of devalue and default for today’s crisis countries. A fully-federal Europe with a banking union and a fiscal union is the best solution to this problem but is politically infeasible. However, it may be possible to underpin the Euro by a ‘Bretton-Woods compromise’ that accepts a retreat from some aspects of deep economic integration since exit entails new risks of financial crisis that were not present eighty years ago.
JEL Classification: F33; N14
1
1.
Introduction
The economic crisis in Europe that started in 2008 is the most serious since the 1930s. Not surprisingly, the experience of that decade can be seen as a source of lessons as to the dangers that Europe now faces and the policy responses that may be forthcoming. Looking at the 1930s in this way is not reassuring. That decade was notorious not only for the severe economic downturn of the Great Depression but it was also a period notorious for banking crises, currency wars, exchange controls, protectionism and sovereign default. The gold standard collapsed, central banks lost their independence, and the public lost its faith in the market economy. Ultimately, it took half a century fully to reverse the 1930s’ economic disintegration of Europe although a beginning was made in the 1940s under the auspices of the Bretton Woods Agreement and the Marshall Plan.
If the debacle of the 1930s were to be repeated, the prognosis for the Eurozone would indeed be gloomy. In order to assess the likelihood of this happening and potentially to avert this outcome, it is important to understand in some depth the evolution of economic policy and its rationale in the aftermath of the shocks that battered the European economy following the Wall Street Crash. This paper provides just such an analysis using ideas building on the macroeconomic trilemma highlighted by Obstfeld and Taylor (2004) to throw light on the question ‘will this time be different?’. A key feature of 1930s’ macroeconomic policymaking was that, for much of the 1930s in depressed economies, nominal interest rates were at the zero lower bound (ZLB) and the implications of trying to achieve economic recovery in such conditions are also explored.
In any event, the post-2008 crisis has significantly affected the medium-term prospects of European economies. The legacy is one of misalignments of real exchange rates, high public debt to GDP ratios, a prolonged period of fiscal consolidation, a fragile banking system and levels of real GDP that will be appreciably below what would have been expected pre-crisis. The design of European Monetary Union has been revealed to be fundamentally flawed. The policy space available to troubled Eurozone economies appears to be uncomfortably narrow. The status quo does not seem to offer a viable future. Using the political trilemma proposed by Rodrik (2000) to reconsider the 1940s’ response to the damage done by the 1930s, this paper argues that the choice for the Eurozone economies lies between minor or major disintegration and that, either way, this will have adverse effects on growth performance.
1.
Economic Disintegration in the 1930s: an Outline
The Great Depression of the early 1930s was characterized by deflation, slump and financial crises; prices declined, there were substantial and prolonged falls in real GDP and unemployment rose dramatically while banking and currency crises proliferated. The responses of policymakers added up to a major globalization backlash which entailed greatly increased barriers to international trade and capital flows. Economic policy was very much the domain of the nation state and was orientated to what were perceived as domestic needs; attempts at international policy coordination such as the World Economic Conference held in London in 1933 were failures and, of course, this era preceded the establishment of the GATT/WTO and the IMF.
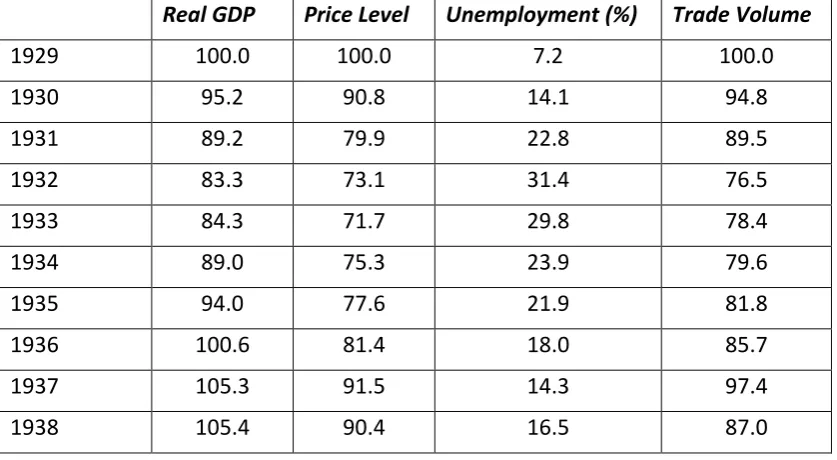
2 GDP fell from peak to trough by over 25 per cent in both Germany and the United States but only by about 6 per cent in the United Kingdom (Crafts and Fearon, 2013). In general, the slump was much worse for countries in which there was a banking crisis and which were slow to leave the gold standard. The 1930s are rightly notorious for high unemployment but internationally comparable data are scarce; the figures in Table 1 are useful for suggesting how rapidly unemployment rose and how slowly it fell in the internationally tradable industrial sector but, by excluding the service and public sectors, significantly exaggerate overall levels of unemployment. Table 1 also reports a steep decline in the volume of world trade which fell initially by about 24 per cent and never regained its 1929 peak during the 1930s.
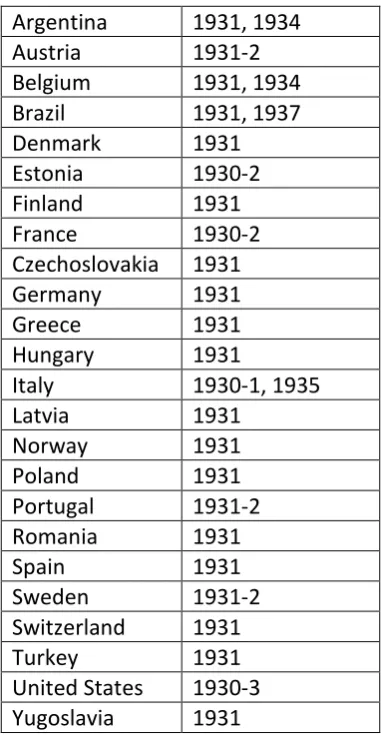
In Table 2 we see that many countries had a banking crisis (financial distress in the banking system, bank liquidations, significant bank runs etc.) Again experience varied greatly – in the United Kingdom there were no bank failures whereas in the United States about 9000 banks (accounting for about 1/7th of all deposits) failed. A comparison of the catastrophic banking crisis in 1931 with that of 2007/08 shows that the countries involved in 1931 accounted for 55.6 percent of world GDP while the figure for the latter period is 33.5 percent ( Reinhart, 2010; Maddison, 2010).
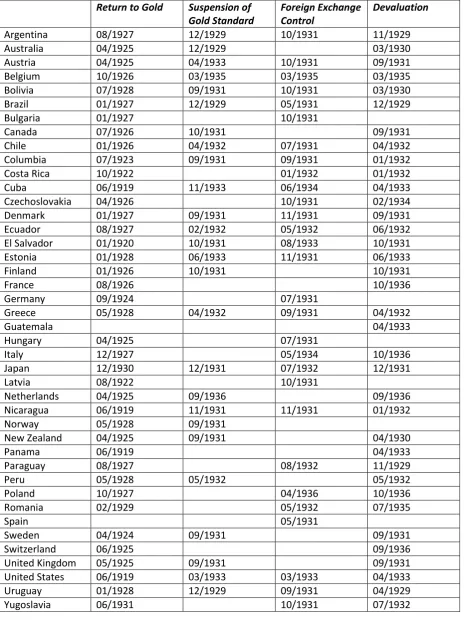
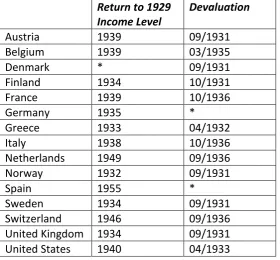
Table 3 chronicles the collapse of the gold standard in the 1930s quite soon after its restoration post World War I. Famously, the United Kingdom made an ignominious exit in September 1931 having returned to gold only 6 years earlier. Virtually all major economies were on gold in 1929 but by late 1936 the French devaluation signalled the final demise of an international monetary system based on free convertibility of currencies into gold at a fixed parity. Table 4 shows that the price of staying on the gold standard was a big loss of international competitiveness – reflected in numbers exceeding 100 – and massive deflationary pressure on prices. There was a stark contrast between France and the United Kingdom by late 1933.
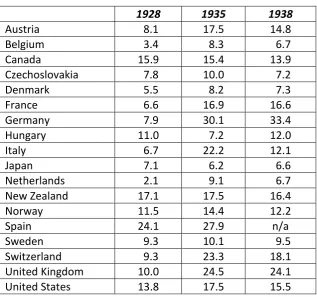
It is also apparent from Table 3 that foreign exchange controls, i.e., restrictions on the international mobility of capital, became widespread. The macroeconomic trilemma states that a country can have at most two of a fixed exchange rate, independent monetary policy and unrestricted capital mobility (Obstfeld and Taylor, 2004). Whereas in the 1920s the modal choice by far was to sacrifice independent monetary policy, in the 1930s typically one or both of capital mobility and a fixed exchange rate were discarded. Table 5 shows that there was a strong (though by no means perfect) correlation between abandonment of the fixed gold-standard exchange rate and recovery so that, on average, countries seem to have benefited from revising their macroeconomic trilemma choice. Table 6 reports a measure of increased protectionism based on tariff rates. This is only part of the picture since the 1930s also saw a substantial resort to non-tariff barriers to trade such as quantitative restrictions perhaps affecting as much as 50 per cent of world trade (Gordon, 1941). Increased barriers to trade clearly played an important role in reducing trade volumes in the 1930s. Models based on import demand functions (Madsen, 2001) and on the historical relationship between world production and trade (Irwin, 2012) both suggest that protectionism accounted for around 40 per cent of the fall. The goals of protectionist policies were typically to safeguard employment, to improve the balance of payments and to raise prices. Unlike today, there were no constraints from WTO membership.
3 Latin American countries in particular from the world economy. Debts were owed to private bondholders rather than banks and this was important in permitting a relaxed attitude by lender governments (Eichengreen and Portes, 1989).
2.
Economic Disintegration in the 1930s: Analysis
The decision to leave the gold standard was analyzed by Wolf (2008) who used a probit model to examine the odds of staying on gold. His results were that a country was more likely to leave if its main trading partner did, if it had returned to gold at a high parity, if it was a democracy, or if the central bank was independent. It was less likely to leave if it had large gold reserves, less price deflation, and strong banks. In other words, decisions as to whether to leave the gold standard were influenced by the strength of worries about loss of monetary discipline, the extent of deflationary pain, and deteriorating international competitiveness. The model predicts departures well and indicates that France was under the least pressure to exit in the early 1930s. This account maps into various generations of currency-crisis models. It also suggests that democratic politics undermined the gold standard. As Eichengreen (1996) underlined, the extension of the franchise had made acceptance of deflationary policies to stay on gold much less acceptable than in the nineteenth century.
For the typical small open economy in the rest of the world, the big problem as the Depression took hold was being subjected to deflationary pressure as world output and prices fell whilst being severely constrained in policymaking by membership of the gold standard. The concept of the macroeconomic trilemma tells us that such a country can only have two of a fixed exchange rate, capital mobility and an independent monetary policy. It follows that, for countries on the gold standard, a monetary-policy response to the deflationary shocks needed to be coordinated across countries (thereby allowing interest rate differentials to remain unchanged) but, as Wolf (2013) explains, international coordination was out of the question.
Besides having no control over monetary policy, staying on the gold standard required reductions in prices and money wages to maintain competitiveness, and entailed high real interest rates and increases in real labour costs (Newell and Symons, 1988). Leaving gold delivered autonomy over monetary policy with lower interest rates and real wage rates and also stimulated investment (Eichengreen and Sachs, 1985). In the post gold-standard world, central banks tended to lose control over the conduct of monetary policy which passed to governments. Indeed, Goodhart (2010) described the1930s to the 1960s as an era of ‘the subservience of central banks’.
4 Staying on the gold standard also increased the risk of a banking crisis as balance sheets deteriorated, although these crises were experienced in many countries and were associated with weaknesses in banking systems as well as the deflationary pressures which stressed them (Grossman, 1994). Banking crises were bad for the real economy and countries which went through them were exposed to much larger decreases in real output; the median banking crisis lasting a year lowered industrial output by 12 per cent according to the estimates in Bernanke and Carey (1996). The gold standard collapsed under the pressure of deflation. This problem stemmed from the behaviour of balance-of-payments-surplus countries and the asymmetric requirement for adjustment placed on deficit countries. Between 1927 and 1932 France saw its share of world gold reserves increase from 7 per cent to 27 per cent of the total. Since the gold inflow was effectively sterilized, the policies of the Bank of France created a shortage of reserves and put other countries under great deflationary pressure. By 1932, France and the United States together held 62 per cent of world gold reserves. Irwin (2010) concluded that, on an accounting basis, France was probably more responsible even than the US for the world wide deflation of 1929-33. He calculated that through their ‘gold hoarding’ policies the Federal Reserve and the Banque de France together directly accounted for half the 30 per cent fall in prices that occurred in 1930 and 1931. Deflation was accompanied by high real interest rates; central bank discount rates averaged 5 per cent as late as the end of 1931 and still almost 3.5 per cent in mid-1933 (Almunia et al., 2010).
The goals of protectionist policies were typically to safeguard employment, to improve the balance of payments and to raise prices. Unlike today, there were no constraints from WTO membership. Protectionism is usually thought of as the triumph of special-interest groups but, in this period, it may have been more a substitute for a macroeconomic-policy response. For example, Eichengreen and Irwin (2010) found that, on average, tariffs were higher in countries that stayed on gold longer and so had less scope to use monetary or fiscal policies to promote economic recovery. Their paper suggests that the financial crisis of 1931 rather than the Smoot-Hawley tariff was the real trigger for the 1930s’ trade war.
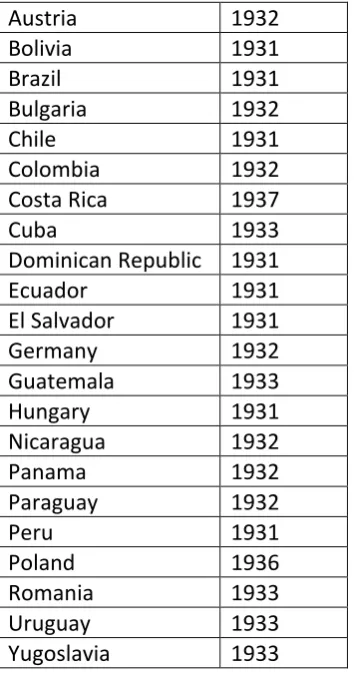
Default was typically triggered by the increased burden of debt service as the depression intensified and export prices fell while real interest rates rose. Econometric analysis of the decision to default shows that it was more likely the higher the debt to income ratio and the greater the terms of trade shock but was also made more likely by unwillingness to pursue austerity policies (Eichengreen and Portes, 1986). In the 1930s, maintaining debt service tended to be associated with fiscal austerity and measures to improve the current account of the balance of payments while the decision to suspend payments was often accompanied by fiscal expansion and monetary reflation.1 An analysis of the implications of default shows that it promoted growth, especially for heavy defaulters (Eichengreen and Portes, 1990).
This analysis highlights several points of relevance to today’s Eurozone crisis. First, back in the 1930s devaluation, perhaps accompanied by default, was the route to recovery. Macroeconomic-trilemma choices were dramatically revised. Second, the existence of the fixed exchange rate system was
1
5 undermined by surplus countries which placed large burdens of adjustment on economies with weak balance of payments positions. Third, exit from the gold standard was contagious. Fourth, when orthodox macroeconomic policies were unavailable as a way to fight unemployment, protectionism was to be expected. Finally, it should also be recognized that a long and deep contraction in GDP was conducive to the rise of extremist political parties, although the link was not automatic and depended on the structure of the electoral system and whether there was a long-standing democratic tradition (de Bromhead et al., 2013).
3.
Macroeconomic Policy at the ZLB
The pre-2008 norm for the macroeconomic policy framework was inflation targeting by an independent central bank. The way in which inflation targeting is implemented is generally through a Taylor Rule. The central bank raises short-term interest rates if inflation is above target or if GDP is above the economically sustainable level – i.e., if the ‘output gap’ is negative. Inflation targeting using a Taylor Rule runs into difficulties when it requires that the nominal interest rate be negative. This is the ‘zero lower bound’ constraint. This is most likely to matter in times of deflation or severe recession especially if this is associated with a banking crisis and credit crunch (Woodford, 2011a). This suggests either that a strategy has to be devised to lower real interest rates by creating inflationary expectations and/or that it may be necessary to use expansionary fiscal policy.
Indeed, New-Keynesian macroeconomic models have been developed which predict that fiscal stimulus may be expected generally to have a larger multiplier effect when interest rates are held constant at the lower bound, as recent discussions have emphasized. One way in which this may work is when a deficit-financed increase in government spending leads expectations of inflation to increase. Simulated examples of fiscal stimulus in ‘great depression’ conditions have suggested values in excess of 2 may be observed (Woodford, 2011b).
In principle, the central bank can stimulate the economy by holding its interest rate down while encouraging people to expect inflation. Reductions in the real interest rate sustained over a period of time have the potential to act as an expansionary policy so monetary policy is not impotent after all even when interest rates hit the zero lower bound. This strategy may be hard to implement, however. There is a problem of ‘time inconsistency’ in that the private sector may anticipate that the central bank will change its policy as soon as the economy starts to recover. For the real interest rate policy instrument to be effective, it is vital that there is a credible commitment to future inflation. One way to achieve this might be to change the policy mandate of the central bank. Svensson (2003) suggested that a ‘foolproof’ way to escape the liquidity trap is to combine a price-level target path with an initial currency devaluation and a crawling exchange-rate peg which will require a higher price level in equilibrium and can be underpinned by creating domestic currency to purchase foreign exchange. Another way might be to revoke central bank independence and allow the finance ministry to run monetary policy
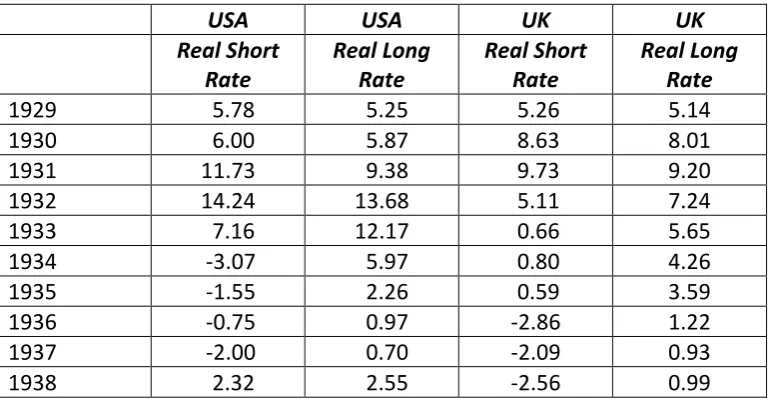
6 The most persuasive account of the American turning point in 1933 is to explain it as a ‘regime change’ linked to the exit from the gold standard and the Thomas Amendment which granted the President broad discretionary powers over monetary policy (Temin and Wigmore, 1990). Recent research has clarified and amplified this proposition in the context of the ZLB. Eggertsson (2008) sees devaluation as a necessary but not sufficient condition since the key is not devaluation per se but reducing real interest rates. In his analysis, the role of the New Deal and deficit spending is central but as a credible policy that raised inflationary expectations with the government targeting a return of prices to the 1926 level.2 The results of the calibrated DSGE model used by Eggertsson (2008) are that regime change accounted for around 75 per cent of the rapid rise in real GDP between 1933 and 1937. It is clear from Table 8 that real interest rates fell quite dramatically and very quickly. Movements in the exchange rate, which fell to $5.10 against the pound from $3.45 and remained in the range $4.90 to $5.10 during the next 4 years, and in gold reserves, which almost doubled within a year, were consistent with the ‘Foolproof Way’ to escape the liquidity trap.
Until the UK left the gold standard, the Bank of England set interest rates with a view to maintaining the $4.86 parity. In practice, this meant that policy had to ensure that rates were not out of line with foreign, especially American, interest rates. After leaving gold, control of monetary policy passed to the Treasury and it took some time for policy to be re-set. The opportunity to redeem the 5% War Loan was taken in mid-1932 and £1.92 billion was converted to 3.5% War Loan 1952 saving interest payments of £28.8 million annually, a non-trivial amount in the context of the fiscal consolidation of the time. At the same time, the so-called ‘cheap money’ policy became reasonably settled and clearly articulated; the Treasury Bill rate fell from 3.77% in the first quarter of 1932 to 0.60% in the third quarter of that year, a level close to which it remained through 1938 (Howson, 1975). It is generally agreed that ‘cheap money’ provided a significant monetary stimulus which worked through raising investment, especially in house-building (Broadberry, 1986, 1987).
Senior Treasury officials wanted the price level to rise and when the cheap money policy was introduced believed that prices would return at least to the 1929 level by 1935. The Chancellor of the Exchequer announced the objective of raising prices at the British Empire Economic Conference at Ottawa in July 1932 and subsequently reiterated it frequently. The fall in the exchange rate from $3.80 in March 1932 to $3.28 in December 1932 is consistent with escaping the liquidity trap in the ‘Foolproof Way’, as is the sustained fall in the value of the pound and the large increase in foreign exchange reserves over the next four years which reflected intervention by the authorities to keep the pound down (Howson, 1980). So market reactions suggest that the cheap money policy quickly became credible. As Table 8 reports, it brought about a considerable reduction in real interest rates compared with the start of the decade. Obviously, this strategy does not represent an irrevocable commitment but it was a credible policy given that the Treasury and the Chancellor of the Exchequer were in charge rather than the Bank of England.3 Cheap money and a rise in the price level were clearly in the Treasury’s interests from 1932 as a route to recovery, better fiscal arithmetic, and to provide an alternative to the Pandora’s Box of jettisoning balanced-budget orthodoxy and adopting Keynesianism (Howson, 1975).
2 Ever since the work of Brown (1956) it has been known that the New Deal was only a very modest fiscal stimulus. With interest rates at the lower bound, the multiplier effects of an aggressive Keynesian policy might have been big, as the estimates of Gordon and Krenn (2010) suggest, but it was not tried.
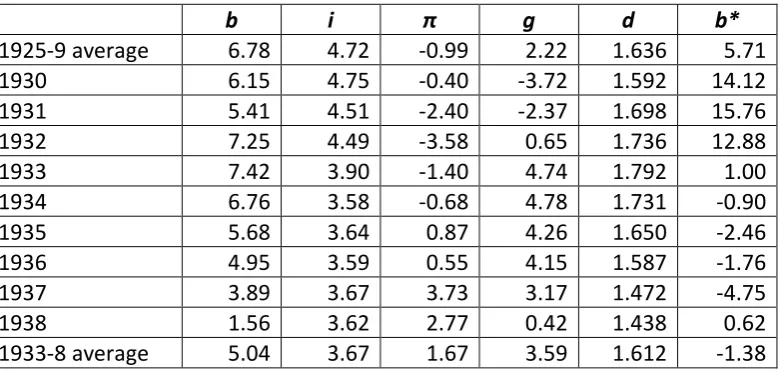
7 The interwar British economy lived under the shadow of a large public debt to GDP ratio that was the legacy of World War I. Both price deflation and recession threatened fiscal sustainability and this prompted a fiscal consolidation in the early 1930s which improved the structural budget surplus/GDP ratio by almost 4 percentage points between 1929/30 and 1933/34 (Middleton, 2010). After peaking in 1933 at 1.792, worries about a rising public debt to GDP ratio eased and, as Table 9 reports by 1938, it had fallen to 1.438 even though by then rearmament was well under way. How could this happen? The stark difference from the period prior to leaving the gold standard in September 1931 is clearly seen in Table 9. When the price-deflationary years of the early 1930s had been left behind, the required primary budget surplus fell steeply and, indeed, once the differential between the real interest rate and the real growth rate had turned negative, it would have been possible to run modest primary budget deficits and still have stabilized d. In fact, primary surpluses continued, albeit smaller relative to GDP, through 1938. A check on the fiscal arithmetic shows that about 2/3 of the fall in d came from continuing primary budget surpluses with about 1/3 from the real interest rate falling below the real growth rate during the recovery.4 This experience does, however, underline the point that ‘financial repression’ reduced considerably the severity of the required fiscal squeeze to improve this fiscal indicator.5 It also makes very clear why the Treasury liked ‘cheap money’ and its policy to raise the price level was credible.
This discussion has thrown up a number of points that bear on the policy options that Eurozone countries might like to access. First, at the ZLB, price deflation not inflation is public enemy number one. Second, conventional inflation targeting by an independent central bank is not necessarily an appropriate monetary policy framework in a depressed economy trying to escape the liquidity trap. Third, falling prices make achieving fiscal sustainability at high public debt to GDP ratios very demanding in terms of the required budget surplus so that, if deflation is required to restore competitiveness in a fixed exchange rate system, austerity fatigue is a likely consequence. Fourth, by the same token, financial repression which reduces or even eliminates the need to run a primary budget surplus will always have political attractions when sovereigns are highly indebted and are unwilling or unable to default. Finally, although the textbooks suggest that Keynesian fiscal stimulus policies may be effective at the ZLB, the 1930s does not provide much evidence for this because such policies were not really tried.
4.
The Euro Area 5 Years After the Crisis Started
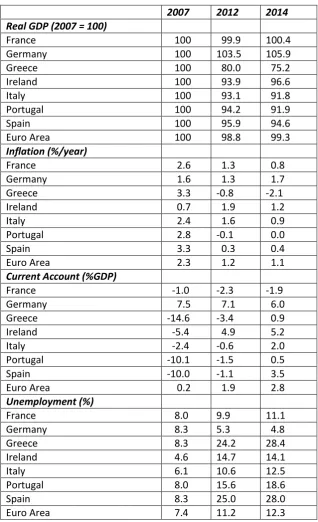
Economic performance in Eurozone countries remains very weak, as is summarized in Table 10. Current OECD estimates are that for the Euro Area as a whole real GDP in 2014 will still not have regained the pre-crisis peak while in the worst affected country, Greece, real GDP may be only about 75 per cent of 2007. Prolonged recession has been accompanied by rapidly rising unemployment - from 7.4 per cent in 2007 to a predicted 12.3 per cent in 2014 in the Euro Area but with much more dramatic increases in several countries including both Greece and Spain where unemployment is predicted to be around 28 per cent in 2014. Price deflation has generally been avoided but inflation
4
These proportions are derived using the method proposed by Ali-Abbas et al. (2011), which is an application of the fiscal sustainability formula in footnote 1.
5
8 remains very low so the growth of nominal GDP in the Euro Area is projected to average only about 1.5 per cent per year in 2013 and 2014.
Current account positions have adjusted substantially in southern Europe where big deficits accompanied by capital account surpluses were prominent in 2007. By 2012, these deficits were much smaller following a sudden stop in capital inflows, falls in income and improvements in competitiveness so that on the basis of relative unit labour costs only Italy was in a (slightly)weaker position than in 1999. Even so, external debt has risen and to restore sustainable external positions further improvements in competitiveness are needed to stabilize net external debt to GDP ratios or, preferably, to reduce them to less vulnerable levels, say, 35 per cent of GDP. For Portugal and Spain to achieve the latter it has been estimated that improvements in competitiveness relative to the rest of the Euro Area of about 30 per cent are required while for Greece the figure is nearly 80 per cent (Guillemette and Turner, 2013). If these changes in relative unit labour costs were to be delivered through falls in domestic wages and prices, many more years of high unemployment would have to be endured. Indeed, Euro-periphery economies appear close to downward nominal wage rigidity – only in Greece were labour costs per hour lower in 2012 than in 2008 (Eurostat, 2013).
Table 11 reports public debt to GDP ratios. Across the Euro Area, these are high and still rising. The extent of fiscal consolidation that would be required to reduce debt to GDP ratios to the Maastricht-prescribed level of 60 per cent within a 20-year time horizon is non-trivial in many cases and debt to GDP ratios are likely to remain high for a long time if the only way to reduce them is fiscal orthodoxy. Attempts to improve competitiveness which entail price deflation would intensify the required fiscal consolidations.
The long-term implications of high levels of public debt are likely to be unfavourable for growth, as is highlighted by growth models of the overlapping-generations variety. The adverse impacts can occur through a number of transmission mechanisms including reductions in market-sector capital formation, higher long-term interest rates and higher tax rates. Empirical research on advanced economies has found negative relationships; for example, Kumar and Woo (2010) estimate that a 10 percentage point increase in D/Y is associated with a fall of about 0.2 percentage points in growth. If taken literally, this could imply that the future trend growth rate would be as much as 0.75 percentage points lower than pre-crisis.6
A further implication of high public debt to GDP ratios is that they seriously reduce the scope for fiscal stimulus to boost growth. As is well-known, worries about fiscal sustainability have already undermined willingness to use fiscal stimulus. Much less widely noticed, however, is that the legacy of the crisis will be a lengthy period when public debt to GDP ratios are at a level which potentially renders fiscal stimulus ineffective. Auerbach and Gorodnichenko (2011) find that at debt to GDP ratios greater than 100 per cent fiscal multipliers are close to zero even in deep recessions while Ilzetzki et al. (2010) suggest that, on average, the fiscal multiplier is zero on impact and in the long run is actually negative at debt to GDP ratios above 60 per cent. For Euro Area economies which have given up the independent monetary policy instrument the implication may be that they have little or no scope to deliver economic stimulus through expansionary macroeconomic policies.
6
9 Fears of sovereign debt crises have been exacerbated by banking crises which in turn are made potentially more serious by sovereign default – the so-called ‘doom-loop’. Both types of crisis are made more likely by slow growth and, in turn, undermine growth performance. According to the criteria adopted by IMF economists, there have been systemic banking crises in 8 Eurozone economies since 2008 (Austria, Belgium, Germany, Greece, Ireland, Luxembourg, Netherlands and Spain) with borderline-systemic crises in 4 more (France, Italy, Portugal, Slovenia) (Laeven and Valencia, 2012). The threat to public finances from financial instability is much larger than in previous generations because bank balance sheets are now much larger relative to GDP. In 6 countries (Austria, Belgium, France, Ireland, Netherlands and Spain) this ratio was at least 3 by 2009 (Obstfeld, 2013) whereas until the 1970s it was typically less than 1 in advanced countries (Schularick and Taylor, 2012). Equally, the threat to financial stability from sovereign default is considerably greater now than in the 1930s because the debts are owed to banks rather than private bondholders.
In these circumstances, what might the 1930s suggest is likely to happen? Prima facie, the possibilities seem fairly clear. The macroeconomic-trilemma framework points to exits from the Euro since devaluation has attractions for the periphery countries of Southern Europe because it would allow more policy sovereignty and a route to an early return to growth. The experience of monetary policy at the ZLB suggests that the Eurozone may be more likely to survive if the European Central Bank credibly targets higher rates of inflation for a period; this would not only reduce real interest rates but would also reduce real wages and restore competitiveness in the periphery (Schmitt-Groheˊand Uribe, 2012). If neither of these comes about, then financial repression and/or sovereign default together with protectionism may take the place of orthodox macroeconomic and debt-management policies. Unless, of course, history is a poor guide and this time really is different.
5.
The Future of the Eurozone through a Political-Trilemma Lens
These arguments can be developed more fully in the framework of the political trilemma (reproduced in Figure 1), originally proposed by Rodrik (2000) and recently used by Crum (2013) to consider the future of the Eurozone. The trilemma is that it is possible to have at most 2 of deep economic integration, democratic politics and the nation state. If a ‘golden straitjacket’ choice is made, then democratic politics is subservient to a rules-based system of governance while if global federalism is chosen, the nation state loses at least some of its political authority but democracy obtains at the federal level.
10 sufficient policy space to make saving the remaining aspects (in this case moving back to freer trade) politically acceptable rather than accept the full 1930s’ retreat from globalization.
Despite the apparent precedent of the 1930s, the Eurozone has not yet collapsed so this time may be different for several reasons which imply that the benefit/cost ratio of leaving the gold standard was rather different from that of exit from the Euro. First, this may be a Pyrrhic victory because it could well engender capital flight and a devastating bank run – or, put differently, ‘the mother of all financial crises’ (Eichengreen and Temin, 2013). Second, the perception of dire consequences of a devaluation and default for other Eurozone countries in an integrated capital market with much bigger bank balance sheets that feature substantial amounts of sovereign debt led to the provision of financial support with conditionality under the auspices of the ‘troika’. Third, the European Central Bank has acted as a lender of last resort not only to banks but also to sovereigns through sovereign debt purchases and its offer of outright monetary transactions (OMT).
Furthermore, the initial thrust of policy proposals by the European Commission (2012) is to strengthen the ‘Golden Straitjacket’ to preserve deep economic integration and the primacy of the nation state but at the expense of democracy. The Commission charts a path through new fiscal rules together with the beginnings of a banking union in terms of a single supervisory mechanism (SSM) followed by a single resolution mechanism (SRM). Crum (2013, p. 615) sees this as ‘a strategy with considerable justification’ since democratic federalization is out of reach and thus the only realistic alternative is collapse of EMU.
Yet, European Commission (2012) clearly envisages that reforms should ideally go much further and require treaty changes. Later stages of the process that it spells out include a full fiscal union and participatory democracy at the federal level including direct election of an EU President. Arguably, given the size of bank balance sheets relative to national economies, an effective banking union, which would ensure financial stability and break the doom-loop, entails more than the SSM and SRM; it requires a supranational fiscal backstop that underpins deposit insurance and allows the issue of Eurobonds (Obstfeld, 2013). So, the ‘golden straitjacket’ may not be enough to save EMU. A ‘United States of Europe’ would entail banking union, fiscal union, and a constitution that ended Europe’s ‘democratic deficit’. Wolf (2012) spells out what this might enable. He notes that it would allow more effective European fiscal and monetary policy at the ZLB, and political legitimization of a much higher level of transfer payments from an expanded European budget while also finding a way to share burdens of adjustment between surplus and deficit countries. The advantages of this political-trilemma choice are the realization of economies of scale in the provision of federal public goods, the internalization of externalities and mutual insurance against asymmetric shocks (Spolaore, 2013). However, voters in different European countries have very different preferences for design of a reformed EU, i.e., ‘heterogeneity costs’ are probably too high to allow the realization of these putative benefits.
11 disintegration could make life within the Euro more politically tolerable for countries that otherwise have very limited policy space – indeed, this is already happening.
In the 1930s, countries ‘trapped’ in the gold standard turned to imposing barriers to trade, faute de mieux. Today’s equivalent includes increased reluctance to implement the Single Market in services and the creeping protectionism documented by Global Trade Alert (Table 12). These interventions are mostly not flagrant violations of WTO rules and traditional tariff measures are only a small part of what has happened. The European Commission and EU member states have been by far the most active protectionists accounting for 335 measures. EU protectionism has entailed a relatively high level of discrimination against foreign commercial interests and of selectivity among firms compared with other leading economic powers and 84 per cent of interventions in the EU have employed policy instruments that are subject to low or no regulation by the WTO using measures such as bailouts, trade finance, and subsidies, with the EU state-aids regime effectively suspended (Aggarwal and Evenett, 2012).
If high primary surpluses are required to achieve fiscal consolidation for countries which face high debt to GDP ratios and low rates of growth of nominal GDP, ‘austerity fatigue’ is a real worry. Indeed, Buiter and Rabhari (2013) have argued that in some cases the maximum politically feasible budget surplus may be less than that required for fiscal sustainability. This implies the attraction of ‘financial repression’ in the sense of manipulating the interest rate paid on government debt in order to use a positive differential between the real growth rate and the real interest rate to bear some of the burden of debt to GDP reduction, as in 1930s’ Britain. The increment to growth from greater financial integration in European countries which was realized pre-crisis (Gehringer, 2013) is at risk if moves towards financial repression intensify and entail barriers to capital flows together with reductions in cross-border lending.7
Economic disintegration on this scale would have some adverse supply-side effects on growth but this might still be preferable to the impact of a collapse of the Euro. How costly that might be is a matter of speculation but estimates suggest it would be very disruptive; for example, Cliffe (2011) suggests that after 5 years real GDP in the Euro Area would still be 5 per cent lower than at the break-up. It is also reasonable to suggest that there would be a permanent adverse effect on GDP levels, although perhaps not as large as has sometimes been claimed. The currency-union effect on trade volumes was once thought to be very large but better econometrics and the opportunity to examine the actual impact of EMU now suggests that trade volumes increased by perhaps 2 per cent (Baldwin et al., 2008) with the implication that the trade effect on GDP was less than 1 per cent. There are, however, several channels through which EMU may have raised productivity and a recent study found that EMU had raised the level of real GDP per hour worked by 2 per cent (Barrell et al., 2008); this would potentially be at risk.
6.
Conclusions
The economic history of the 1930s offers some clues about the future of the Eurozone but obviously does not provide a full template. Today’s world is different in important ways from that of 80 years
7
12 ago when the gold standard collapsed. In particular, institutions have changed in the context of European integration and the treaty obligations of WTO membership while capital is more internationally mobile and information travels faster.
Taken at face value, the example of the 1930s suggests that there are big attractions for struggling Eurozone economies to return to growth via a strategy of devaluation and default, and to exit from the currency union. The advantages would potentially include improved competitiveness and circumventing downward nominal wage rigidity, less need to run primary budget surpluses in pursuit of fiscal sustainability and the opportunity to implement a new monetary-policy framework. However, whether exit can be achieved without triggering a massive financial crisis is doubtful. An option that was not available in the 1930s may be for the European Union to undergo a major institutional reform to deliver a fully-federal Europe with a banking union, a fiscal union and democratic legitimacy. In principle, this certainly could sustain a combination of deep economic integration and democratic politics with the implication that the currency union is saved by downsizing the role of the nation state. Unfortunately, this requires a level of political agreement across EU member states that is unlikely to be realized.
13
References
Aggarwal, V. K. and Evenett, S. J. (2012) ‘Industrial Policy Choice during the Crisis Era’, Oxford Review of Economic Policy, Vol. 28, No. 2, pp. 261-283.
Ali Abbas, S. M., Belhocine, N., El-Ganainy, A. and Horton, M. (2011) ‘Historical Patterns and
Dynamics of Public Debt – Evidence from a New Database’, IMF Economic Review, Vol. 59, No. 4, pp. 717-742.
Almunia, M., Benetrix, A., Eichengreen, B., O’Rourke, K. H. and Rua, G. (2010) ‘Lessons from the Great Depression’. Economic Policy, Vol. 25, No.50, pp. 219-265.
Auerbach, A. and Gorodnichenko, Y. (2011) ‘Fiscal Policy in Recession and Expansion’. NBER Working Paper No. 17447 (New York: National Bureau of Economic Research).
Baldwin, R., Di Nino, V. , Fontagne, L., De Santis, R. and Taglioni, D. (2008) ‘Study on the Impact of the Euro on Trade and Foreign Direct Investment’, European Economy Economic Papers No. 321. Baldwin. R. E. and Evenett, S. J. (2012) ‘Beggar-thy-Neighbour Policies during the Crisis Era: Causes, Constraints and Lessons for Maintaining Open Borders’. Oxford Review of Economic Policy, Vol. 28, No. 2, pp. 211-234.
Barrell, R., Gootschalk, S., Holland, D., Khoman, E., Liadze, I. and Pomerantz, O. (2008) ‘The Impact of EMU on Growth and Employment’. European Economy Economic Papers No. 318.
Bernanke, B. (1995) ‘The Macroeconomics of the Great Depression: a Comparative Approach’. Journal of Money, Credit and Banking, Vol. 27, No. 1, pp. 1-28.
Bernanke, B. and Carey, K. (1996) ‘Nominal Wage Stickiness and Aggregate Supply in the Great Depression’. Quarterly Journal of Economics, Vol. 111, No. 3, pp. 853-883.
Bernanke, B. and James, H. (1991) ‘The Gold Standard, Deflation, and Financial Crisis in the Great Depression: an International Comparison’. In Hubbard, R. G. (ed) Financial Markets and Financial Crises (Chicago: University of Chicago Press).
Bordo, M., Eichengreen, B. , Klingbiel, D. and Martinez-Peria, M. (2001) ‘Is the Crisis Problem Growing More Severe?’ Economic Policy, Vol. 16, No. 32, pp. 53-82.
Broadberry, S.N.(1986) The British Economy between the Wars: a Macroeconomic Survey (Oxford: Basil Blackwell).
Broadberry, S. N. (1987) ‘Cheap Money and the Housing Boom in Interwar Britain: an Econometric Appraisal’. The Manchester School, Vol. 55, No. 3, pp. 378-389.
Brown, E. C. (1956) ‘Fiscal Policy in the Thirties: a Reappraisal’. American Economic Review, Vol. 46, No. 5, pp. 857-879.
14 Buiter, W. and Rahbari, E. (2013) ‘Why Do Governments Default and Why Don’t They Default More Often? CEPR Discussion Paper No. 9492 (London: Centre for Economic Policy Research).
Chadha, J. S. and Dimsdale, N. H. (1999) ‘A Long View of Real Rates’. Oxford Review of Economic Policy, Vol. 15, No. 2, pp. 17-45.
Cliffe, M. (2011) EMU Break-Up: Pay Now, Pay Later (London: ING).
Crafts, N. and Fearon, P. (2013) ‘Depression and Recovery in the 1930s: an Overview’. In N. Crafts and P. Fearon (eds) The Great Depression of the 1930s: Lessons for Today (Oxford: Oxford University Press).
Crum, B. (2013) ‘Saving the Euro at the Cost of Democracy’. Journal of Common Market Studies, Vol. 51, No. 4, pp. 614-630.
De Bromhead, A., Eichengreen, B. and O’Rourke, K. H. (2013) ‘Political Extremism in the 1920s and 1930s: Do German Lessons Generalize? Journal of Economic History, Vol. 73, No. 2, pp. 371-406. Egert, B. (2013) ‘The 90% Public Debt Threshold: the Rise and Fall of a Stylized Fact’. OECD
Economics Department Working Paper No. 1055 (Paris: OECD).
Eggertsson, G. B. (2008) ‘Great Expectations and the End of the Depression’. American Economic Review, Vol. 98, No. 4, pp. 1476-1516.
Eichengreen, B. (1992) Golden Fetters: the Gold Standard and the Great Depression, 1919-1939 (New York: Oxford University Press).
Eichengreen, B. (1996) ’Deja Vu All Over Again: Lessons from the Gold Standard for European Monetary Unification’. In Bayoumi, T., Eichengreen, B. and Taylor, M. (eds) Modern Perspectives onthe Gold Standard (Cambridge: Cambridge University Press).
Eichengreen, B. (2013) ‘Currency War or International Policy Coordination?’ Journal of Policy Modeling, forthcoming.
Eichengreen, B. and Hatton, T. J. (1988), ‘Interwar Unemployment in International Perspective: an Overview’. In Eichengreen, B. and Hatton, T. J. (eds) Interwar Unemployment in International Perspective (London: Kluwer Academic Publishers).
Eichengreen, B. and Irwin, D. (2010) ‘The Slide to Protectionism in the Great Depression: Who Succumbed and Why?’ Journal of Economic History, Vol. 70, No. 4, pp. 871-897.
Eichengreen, B. and Portes, R. (1986) ‘Debt and Default in the 1930s’. European Economic Review, Vol. 30, No. 3, pp. 599-640.
Eichengreen, B. and Portes, R. (1989) ‘Settling Defaults in the Era of Bond Finance’. World Bank Economic Review, Vol. 3, No. 2, pp. 211-239.
15 Eichengreen, B. and Sachs, J. (1985) ‘Exchange Rates and Economic Recovery in the 1930s’. Journal of Economic History, Vol. 45, No. 4, pp. 925-946.
Eichengreen, B. and Temin, P. (2013) ‘Fetters of Gold and Paper’. In Crafts, N. and Fearon, P. (eds) The Great Depression of the 1930s: Lessons for Today (Oxford: Oxford University Press).
European Commission (2012) A Blueprint for a Deep and Genuine Economic and Monetary Union: Launching a European Debate (Brussels).
Eurostat (2013) Eurostat News Release 54/2013.
Feinstein, C. H. (1972) National Income, Expenditure and Output of the United Kingdom, 1855-1965 (Cambridge: Cambridge University Press).
Gehringer, A. (2013) ‘Growth, Productivity and Capital Accumulation: the Effects of Financial Liberalization in the Case of European Integration’, International Review of Economics and Finance, Vol. 25, No. 1, pp. 291-309.
Goodhart, C. A. E. (2010) ‘The Changing Role of Central Banks’. BIS Working Paper No. 326 (Basel: Bank for International Settlements).
Gordon, M. (1941) Barriers to World Trade (New York: Macmillan).
Gordon, R. J. and Krenn, R. (2010) ‘The End of the Great Depression, 1939-41: Policy Contributions and Fiscal Multipliers’. NBER Working Paper No. 16380 (New York: National Bureau of Economic Research).
Grossman, R. S. (1994), ‘The Shoe That Didn’t Drop: Explaining Banking Stability during the Great Depression’. Journal of Economic History, Vol. 54, No. 3, pp. 654-682.
Grossman, R. S. (2010) Unsettled Account (Princeton NJ: Princeton University Press).
Guillemette, Y. and Turner, D. (2013) ‘Policy Options to Durably Resolve Euro Area Imbalances’. OECD Economics Department Working Paper No. 1035. (Paris: OECD).
Howson, S. (1975) Domestic Monetary Management in Britain, 1919-1938 (Cambridge: Cambridge University Press).
Howson, S. (1980) ‘The Management of Sterling, 1932-1939’. Journal of Economic History, Vol. 40, No. 1, pp. 53-60.
Ilzetzki, E., Mendoza, E. G. and Vegh, C. A. (2010) ‘How Big (Small?) are Fiscal Multipliers?’ NBER Working Paper No. 16479 (New York: National Bureau of Economic Research).
Irwin, D. (2010) ‘Did France Cause the Great Depression’. NBER Working Paper No. 16350 (New York: National Bureau of Economic Research).
16 League of Nations (1941) Statistical Yearbook, 1940/1 (League of Nations: Geneva).
Laeven, L. and Valencia, F. (2012) ‘Sytemic Banking Crises Database: an Update’. IMF Working Paper 12/163 (Washington, DC.: International Monetary Fund).
Maddison, A. (1985) Two Crises: Latin America and Asia 1929-38 and 1973-83 (Paris: OECD). Maddison, A. (2010), Historical Statistics of the World Economy, 1-2008AD.
http:// www.ggdc.net/maddison
Madsen, J. (2001) ‘Trade Barriers and the Collapse of World Trade during the Great Depression’. Southern Economic Journal, Vol. 67, No. 4, pp. 848-868.
Middleton, R. (2010) ‘British Monetary and Fiscal Policy in the 1930s’. Oxford Review of Economic Policy, Vol. 26, No. 3, pp. 414-441.
Mitchell, J., Solomou, S. and Weale, M. (2012) ‘Monthly GDP Estimates for Interwar Britain’. Explorations in Economic History, vol. 49, No. 4, pp. 543-556.
Newell, A. and Symons, J. (1988) ‘The Macroeconomics of the Interwar Years: International
Comparisons’. In Eichengreen, B. and Hatton, T. J. (eds) Interwar Unemployment in International Perspective (London: Kluwer).
Obstfeld, M. (2013) ‘Finance at Center Stage: Some Lessons of the Euro Crisis’. CEPR Discussion Paper No. 9415 (London: Centre for Economic Policy Research).
Obstfeld, M. and Taylor, A. M. (2004) Global Capital Markets: Integration, Crisis, and Growth (Cambridge: Cambridge University Press).
OECD (2013), Economic Outlook (Paris: OECD).
Reinhart, C. M. (2010), “This Time is Different Chartbook: Country Histories on Debt, Default, and Financial Crises”. NBER Working Paper No. 15815 (New York: National Bureau of Economic Research).
Reinhart, C. M. (2012) ‘The Return of Financial Repression’. CEPR Discussion Paper No. 8947 (London: Centre for Economic Policy Research).
Reinhart, C. M. and Rogoff, K. (2009) This Time is Different (Princeton NJ: Princeton University Press). Rodrik, D. (2000) ‘How Far will International Economic Integration Go?’ Journal of Economic
Perspectives, Vol. 14, No. 1, pp. 177-186.
Schmitt-Groheˊ, S. and Uribe, M. (2012) ‘The Case for Temporary Inflation in the Eurozone’. CEPR Discussion Paper No. 9133 (London: Centre for Economic Policy Research).
17 Sturzenegger, F. and Zettelmeyer, J. (2007) Debt Defaults and Lessons from a Decade of Crises
(Cambridge, Mass.: MIT Press).
Svensson, L. E. O. (2003) ‘Escaping from a Liquidity Trap and Deflation: the Foolproof Way and Others’. Journal of Economic Perspectives, Vol. 17, No. 4, pp. 145-166.
Temin, P. and Wigmore, B. A. (1990) ‘The End of One Big Deflation’. Explorations in Economic History, Vol. 27, No. 4, pp. 483-502.
The Maddison Project (2013) Per Capita GDP Update. http://www.ggdc.net/maddison-project
Wolf, H. C. and Yousef, T. M. (2007) ‘Breaking the Fetters: Why Did Countries Exit the Interwar Gold Standard?’ In Hatton, T. J., O’Rourke, K. H. and Taylor, A. M. (eds) The New Comparative
EconomicHistory (Cambridge, Mass: MIT Press).
Wolf, N. (2008) ‘Scylla and Charybdis: Explaining Europe’s Exit from Gold, January 1928 to December 1936’. Explorations in Economic History, Vol. 45, No. 4, pp. 383-401.
Wolf, N. (2012). ‘Crises and Policy Responses within the Political Trilemma: Europe, 1929-36 and 2008-2011’. EHES Working Papers in Economic History No. 16. (Berlin: European Historical Economics Society).
Wolf, N. (2013) ‘Europe’s Great Depression: the Failure to Coordinate Economic Policies after the First World War”. In N. Crafts and P. Fearon (eds) The Great Depression of the 1930s: Lessons for Today (Oxford: Oxford University Press).
Woodford, M. (2011a) ‘Financial Intermediation and Macroeconomic Analysis’. Journal of Economic Perspectives, Vol. 24, No. 4, pp. 21-44.
18
Table 1. The Great Depression in the Advanced Countries
Real GDP
Price Level
Unemployment (%)
Trade Volume
1929
100.0
100.0
7.2
100.0
1930
95.2
90.8
14.1
94.8
1931
89.2
79.9
22.8
89.5
1932
83.3
73.1
31.4
76.5
1933
84.3
71.7
29.8
78.4
1934
89.0
75.3
23.9
79.6
1935
94.0
77.6
21.9
81.8
1936
100.6
81.4
18.0
85.7
1937
105.3
91.5
14.3
97.4
1938
105.4
90.4
16.5
87.0
Sources:
Real GDP: Maddison (2010), western European countries plus western offshoots.
Price Level: League of Nations (1941); data are for wholesale prices, weighted average of 17 countries.
Unemployment: Eichengreen and Hatton (1988); data are for industrial unemployment, unweighted average of 11 countries.
19
Table 2. Banking Crises, 1929-38
Argentina
1931, 1934
Austria
1931-2
Belgium
1931, 1934
Brazil
1931, 1937
Denmark
1931
Estonia
1930-2
Finland
1931
France
1930-2
Czechoslovakia
1931
Germany
1931
Greece
1931
Hungary
1931
Italy
1930-1, 1935
Latvia
1931
Norway
1931
Poland
1931
Portugal
1931-2
Romania
1931
Spain
1931
Sweden
1931-2
Switzerland
1931
Turkey
1931
United States
1930-3
Yugoslavia
1931
20
Table 3. Dates of Changes in Gold Standard Policies
Return to Gold Suspension of Gold Standard
Foreign Exchange Control
Devaluation
Argentina 08/1927 12/1929 10/1931 11/1929
Australia 04/1925 12/1929 03/1930
Austria 04/1925 04/1933 10/1931 09/1931
Belgium 10/1926 03/1935 03/1935 03/1935
Bolivia 07/1928 09/1931 10/1931 03/1930
Brazil 01/1927 12/1929 05/1931 12/1929
Bulgaria 01/1927 10/1931
Canada 07/1926 10/1931 09/1931
Chile 01/1926 04/1932 07/1931 04/1932
Columbia 07/1923 09/1931 09/1931 01/1932
Costa Rica 10/1922 01/1932 01/1932
Cuba 06/1919 11/1933 06/1934 04/1933
Czechoslovakia 04/1926 10/1931 02/1934
Denmark 01/1927 09/1931 11/1931 09/1931
Ecuador 08/1927 02/1932 05/1932 06/1932
El Salvador 01/1920 10/1931 08/1933 10/1931
Estonia 01/1928 06/1933 11/1931 06/1933
Finland 01/1926 10/1931 10/1931
France 08/1926 10/1936
Germany 09/1924 07/1931
Greece 05/1928 04/1932 09/1931 04/1932
Guatemala 04/1933
Hungary 04/1925 07/1931
Italy 12/1927 05/1934 10/1936
Japan 12/1930 12/1931 07/1932 12/1931
Latvia 08/1922 10/1931
Netherlands 04/1925 09/1936 09/1936
Nicaragua 06/1919 11/1931 11/1931 01/1932
Norway 05/1928 09/1931
New Zealand 04/1925 09/1931 04/1930
Panama 06/1919 04/1933
Paraguay 08/1927 08/1932 11/1929
Peru 05/1928 05/1932 05/1932
Poland 10/1927 04/1936 10/1936
Romania 02/1929 05/1932 07/1935
Spain 05/1931
Sweden 04/1924 09/1931 09/1931
Switzerland 06/1925 09/1936
United Kingdom 05/1925 09/1931 09/1931
United States 06/1919 03/1933 03/1933 04/1933
Uruguay 01/1928 12/1929 09/1931 04/1929
Yugoslavia 06/1931 10/1931 07/1932
21
Table 4. Price Levels as a Percentage of 1929 Purchasing Power Parities in December 1933
(129 = 100)
Cost of French Franc Cost of Pound Sterling
Austria 98.4 76.8
Belgium 115.2 90.0
Denmark 138.2 108.0
Finland 123.9 96.7
France 78.1
Germany 92.5 72.3
Greece 137.0 107.0
Italy 112.6 88.0
Netherlands 119.6 93.5
Norway 129.1 100.8
Spain 158.4 123.7
Sweden 130.9 102.3
Switzerland 100.4 78.5
United Kingdom 128.0
United States 136.3 106.6
Note:
22
Table 5. Dates of Changes in Gold Standard Policies and Economic Recovery
Return to 1929
Income Level
Devaluation
Austria
1939
09/1931
Belgium
1939
03/1935
Denmark
*
09/1931
Finland
1934
10/1931
France
1939
10/1936
Germany
1935
*
Greece
1933
04/1932
Italy
1938
10/1936
Netherlands
1949
09/1936
Norway
1932
09/1931
Spain
1955
*
Sweden
1934
09/1931
Switzerland
1946
09/1936
United Kingdom 1934
09/1931
United States
1940
04/1933
Notes: real GDP per person never fell below the 1929 level in Denmark, Germany did not devalue but by imposing exchange controls effectively left the gold standard in July 1931, Spain was not on the gold standard.
23
Table 6. Tariff Rates, 1928, 1935 and 1938 (%)
1928
1935
1938
Austria
8.1
17.5
14.8
Belgium
3.4
8.3
6.7
Canada
15.9
15.4
13.9
Czechoslovakia
7.8
10.0
7.2
Denmark
5.5
8.2
7.3
France
6.6
16.9
16.6
Germany
7.9
30.1
33.4
Hungary
11.0
7.2
12.0
Italy
6.7
22.2
12.1
Japan
7.1
6.2
6.6
Netherlands
2.1
9.1
6.7
New Zealand
17.1
17.5
16.4
Norway
11.5
14.4
12.2
Spain
24.1
27.9
n/a
Sweden
9.3
10.1
9.5
Switzerland
9.3
23.3
18.1
United Kingdom
10.0
24.5
24.1
United States
13.8
17.5
15.5
24
Table 7. Sovereign Debt Defaults, 1929-1938
Austria
1932
Bolivia
1931
Brazil
1931
Bulgaria
1932
Chile
1931
Colombia
1932
Costa Rica
1937
Cuba
1933
Dominican Republic
1931
Ecuador
1931
El Salvador
1931
Germany
1932
Guatemala
1933
Hungary
1931
Nicaragua
1932
Panama
1932
Paraguay
1932
Peru
1931
Poland
1936
Romania
1933
Uruguay
1933
Yugoslavia
1933
25
Table 8. Real Interest Rates
(%)
USA
USA
UK
UK
Real Short
Rate
Real Long
Rate
Real Short
Rate
Real Long
Rate
1929
5.78
5.25
5.26
5.14
1930
6.00
5.87
8.63
8.01
1931
11.73
9.38
9.73
9.20
1932
14.24
13.68
5.11
7.24
1933
7.16
12.17
0.66
5.65
1934
-3.07
5.97
0.80
4.26
1935
-1.55
2.26
0.59
3.59
1936
-0.75
0.97
-2.86
1.22
1937
-2.00
0.70
-2.09
0.93
1938
2.32
2.55
-2.56
0.99
Note:
Real rates of interest are calculated on an ex-post basis. Real long rates are based on the yield of consols minus a 3 year backward-looking weighted average of actual inflation rates; for further details, see Chadha and Dimsdale (1999). I am grateful to Jagjit Chadha for providing me with the data.
Source:
26
Table 9. Fiscal Sustainability Data for United Kingdom, 1925-1938
b
i
π
g
d
b*
1925-9 average
6.78
4.72
-0.99
2.22
1.636
5.71
1930
6.15
4.75
-0.40
-3.72
1.592
14.12
1931
5.41
4.51
-2.40
-2.37
1.698
15.76
1932
7.25
4.49
-3.58
0.65
1.736
12.88
1933
7.42
3.90
-1.40
4.74
1.792
1.00
1934
6.76
3.58
-0.68
4.78
1.731
-0.90
1935
5.68
3.64
0.87
4.26
1.650
-2.46
1936
4.95
3.59
0.55
4.15
1.587
-1.76
1937
3.89
3.67
3.73
3.17
1.472
-4.75
1938
1.56
3.62
2.77
0.42
1.438
0.62
1933-8 average
5.04
3.67
1.67
3.59
1.612
-1.38
Note:
The required primary budget surplus to GDP ratio, b*, satisfies the condition that Δd = 0, where Δd = -b + (i – π – g)d
Sources:
27
Table 10. Macroeconomic Indicators
2007 2012 2014 Real GDP (2007 = 100)
France 100 99.9 100.4
Germany 100 103.5 105.9
Greece 100 80.0 75.2
Ireland 100 93.9 96.6
Italy 100 93.1 91.8
Portugal 100 94.2 91.9
Spain 100 95.9 94.6
Euro Area 100 98.8 99.3
Inflation (%/year)
France 2.6 1.3 0.8
Germany 1.6 1.3 1.7
Greece 3.3 -0.8 -2.1
Ireland 0.7 1.9 1.2
Italy 2.4 1.6 0.9
Portugal 2.8 -0.1 0.0
Spain 3.3 0.3 0.4
Euro Area 2.3 1.2 1.1
Current Account (%GDP)
France -1.0 -2.3 -1.9
Germany 7.5 7.1 6.0
Greece -14.6 -3.4 0.9
Ireland -5.4 4.9 5.2
Italy -2.4 -0.6 2.0
Portugal -10.1 -1.5 0.5
Spain -10.0 -1.1 3.5
Euro Area 0.2 1.9 2.8
Unemployment (%)
France 8.0 9.9 11.1
Germany 8.3 5.3 4.8
Greece 8.3 24.2 28.4
Ireland 4.6 14.7 14.1
Italy 6.1 10.6 12.5
Portugal 8.0 15.6 18.6
Spain 8.3 25.0 28.0
Euro Area 7.4 11.2 12.3
Notes:
Inflation based on GDP deflator Sources:
28
Table 11. Debt Ratios in 2012 and Fiscal Consolidation ‘Required’.
Public
Debt/GDP (%)
Fiscal
Consolidation
2012-2014 (%)
Average Fiscal
Consolidation from
2014 to 2030 (%)
Peak Fiscal
Consolidation (%)
France
109.7
2.4
2.4
4.3
Germany
89.2
-0.1
0.0
1.5
Greece
165.6
3.2
3.2
8.1
Ireland
123.3
3.1
2.5
5.0
Italy
140.2
1.5
0.4
3.6
Portugal
138.8
2.1
3.7
7.7
Spain
90.5
2.8
2.5
4.9
Euro Area
103.9
1.4
1.1
2.4
Notes:
Fiscal consolidation is improvement in primary balance/GDP; the ‘requirement’ is to reduce debt to GDP to 60% by 2030.
29