Original citation:
Becker, Sascha O. and Woessmann, Ludger (2013) Not the opium of the people : income and secularization in a panel of Prussian counties. Working Paper. Coventry: Economics Department, University of Warwick. (Warwick economics research paper series (TWERPS), Vol.2013, No.1003
Permanent WRAP url:
http://wrap.warwick.ac.uk/53086 Copyright and reuse:
The Warwick Research Archive Portal (WRAP) makes the work of researchers of the University of Warwick available open access under the following conditions. Copyright © and all moral rights to the version of the paper presented here belong to the individual author(s) and/or other copyright owners. To the extent reasonable and practicable the material made available in WRAP has been checked for eligibility before being made available.
Copies of full items can be used for personal research or study, educational, or not-for-profit purposes without prior permission or charge. Provided that the authors, title and full bibliographic details are credited, a hyperlink and/or URL is given for the original metadata page and the content is not changed in any way.
A note on versions:
The version presented here is a working paper or pre-print that may be later published elsewhere. If a published version is known of, the above WRAP url will contain details on finding it.
Not the Opium of the People :
Income and Secularization in a Panel of Prussian Counties
Sascha O. Becker and Ludger Woessmann
No 1003
WARWICK ECONOMIC RESEARCH PAPERS
Not the Opium of the People:
Income and Secularization in a Panel of Prussian Counties
*Sascha O. Becker† Ludger Woessmann‡
University of Warwick and CAGE University of Munich and Ifo Institute
The interplay between religion and the economy has occupied social scientists for long. We construct a unique panel of income and Protestant church attendance for six waves of up to 175 Prussian counties spanning 1886-1911. The data reveal a marked decline in church attendance coinciding with increasing income. The cross-section also shows a negative association between income and church attendance. But the association disappears in panel analyses, including first-differenced models of the 1886-1911 change, panel models with county and time fixed effects, and panel Granger-causality tests. The results cast doubt on causal interpretations of the religion-economy nexus in Prussian secularization.
Keywords: Religion, secularization, Prussian economic history
JEL classification: Z12, N33
January 14, 2013
* We would like to thank Lucian Hölscher for providing the Sacrament Statistics; Eli Berman, Davide Cantoni,
Francesco Cinnirella, Jean-Luc Demeulemeester, Dan Hungerman, Markus Nagler, and seminar participants at Stanford University, Ifo Munich, and the American Economic Association meeting in San Diego for valuable comments; Christoph Albert, Laurenz Detsch, and Markus Nagler for capable research assistance; and the Pact for Research and Innovation of the Leibniz Association for financial support.
†
Department of Economics, University of Warwick, Coventry, CV4 7AL, United Kingdom;
[email protected]. Becker is also affiliated with CEPR, CESifo, IZA, and Ifo.
The interplay between religion and the economy has occupied social scientists for long. We
construct a unique panel of income and Protestant church attendance for 175 Prussian counties in
1886-1911. The data reveal a marked decline in church attendance – secularization – coinciding
with increasing income. The cross-section also shows a negative association between income and
church attendance. But the association disappears when using the panel structure: In
first-differenced models of the 1886-1911 change, counties with larger increases in income did not
see significantly larger reductions in church attendance; in panel models with county and time
fixed effects, counties with earlier increases in income than others did not see earlier reductions
in church attendance; and in panel Granger-causality tests, initial income is not related to lower
subsequent church attendance, or vice versa. These findings cast doubt on causal interpretations
of the religion-economy nexus during this important phase of secularization in Prussia.
I. Concepts
Religion and the economy may interact in both directions (Iannaccone (1998); McCleary and
Barro (2006)). On the one hand, classic secularization hypotheses suggest that improved material
conditions may reduce the demand for religious consolation. This point was perhaps most
forcefully made by Karl Marx (1844), who referred to religion as “opium of the people” (p. 72)
that is required only to alleviate the ailments of poor economic conditions. More generally,
increased opportunity costs may restrain religious participation (e.g., Gruber and Hungerman
(2008)).
On the other hand, religious beliefs may influence economic behavior and outcomes.
E.g., Weber (1904/05) argued that a Protestant ethic furthered the spirit of capitalism. But
generally, religion may affect beliefs, behaviors, and network interactions that in turn affect
economic outcomes.
Existing empirical evidence is far from conclusive. In cross-country analyses, McCleary
and Barro (2006) find that per-capita GDP negatively predicts religious participation and beliefs
and that economic growth relates negatively to church attendance, but positively to religious
beliefs. At the micro level, e.g., Guiso, Sapienza, and Zingales (2003) find that religious beliefs
are positively associated with economic attitudes, whereas Lipford and Tollison (2003) find a
mildly negative two-way relationship between church membership and income. It is unclear,
however, to what extent such cross-sectional identification can rule out that omitted factors –
e.g., any beliefs, attitudes, and mentalities such as individualism or scientific rationality that
relate to both income and religious participation – affect the observed associations.
In our analysis, we draw on county-level panel data. Such within-country analysis is less
plagued by the substantial cultural and institutional differences that aggravate cross-country
studies. What is more, the panel structure of our data allows us to condition on county and time
fixed effects, thereby identifying from county-specific longitudinal variation. Such models hold
constant any unobserved time-invariant county characteristics and any common country-wide
trends.
Our application relates to Prussia, a core European state, during a period (1886-1911)
when industrialization advanced rapidly and when secularization tendencies were a leading
public concern in Europe (Hölscher (2001), pp. 16, 29-30). While in the United States, religious
participation did not decline in a vivid religious market setting (Finke and Stark (1992)), Prussia
remained dominated by two established churches, making official church membership hardly
of investigation: On average across all Prussian counties, 98.7 percent of inhabitants formally
were members of the Protestant or Catholic Churches both in 1885 and in 1910.
But as our analysis below shows, Protestant church attendance – a direct measure of
participation in church life – in fact declined significantly during the same period. Active church
attendance reflects “demonstrations of churchly life … that were considered already by
contemporaries as indicators of churchliness” (Hölscher (2001), p. 4). Of course, reduced church
attendance does not necessarily imply a reduction in “religiosity” in the sense of inner attitudes
towards belief in God. But it does depict people’s active involvement with the institutionalized
church and its rituals. It is in this way that we use the term “secularization” here.
II. Data
Our unique database on historical church attendance stems from the practice of the Protestant
Church in Germany to count the number of participations in Holy Communion every year, which
Hölscher (2001) gathered at the church-district (Kirchenkreis) level from regional archives covering modern Germany. This exceptional database “unlocks source material that is
internationally unique in its scope and historical depth: the statistical surveys of the Protestant
Regional Churches of Germany on the Expressions of Churchly Life” (Hölscher (2001), p. 29).
The Sacrament Statistics (Abendmahlsstatistik) stem from a uniform annual survey organized by the Statistical Central Office at the Protestant Higher Church Council in Berlin
from 1880 (with precursors) to World War II. Data collection was done by the parish priests on a
preprinted form following uniform surveying directives. Regional Consistories combined these
parish data into registers at the level of church districts, which usually comprised 10-20 adjacent
Our main indicator of church attendance is the number of participations in Holy
Communion divided by the number of Protestants in a district. The general Protestant norm at
the time was to have Holy Communion only once a year (Hölscher (2001), p. 37), although there
were regional differences. By the end of the 19th century, the Church also started to propagate the
possibility of attending Holy Communion more than once a year, which will lead our indicator to
underestimate any decline in church involvement over time. In addition, participants were
counted in the parish where Communion was taken, not in their host parish, and children not yet
confirmed and thus not allowed to participate in Holy Communion (on average roughly one third
of parishioners) are counted among the Protestants in the denominator. Still, sacrament
participation is a useful proxy for church attendance, already used by contemporaries, that “best
allows to discover the long-term change in churchliness” (Hölscher (2001), p. 31).1
Our income data refer to the average annual income of male elementary-school teachers,
available every five years from 1886 to 1911 for all Prussian counties (Kreise) from Education Censuses (Galloway (2007)). Following Galloway, Hammel, and Lee (1994), we use teacher
income as a proxy for overall income, as teaching is a well-defined occupation that facilitates
comparison and as teacher income was almost entirely financed from local contributions, thus
likely reflecting overall income in the county. Teacher incomes are the only income data
1 Actual data on church attendance collected at specific Count Sundays, available only in few Regional
Churches, indicate a largely parallel movement of church attendance and sacrament participation both in the
consistently available across counties and time in this period and are highly correlated with other
measures of economic development in the cross-section (see Appendix A2).2
Our dataset covers an unbalanced panel of 175 territorial entities (“counties”) in
1886-1911. This sample of Prussian counties constitutes the intersection between end-of-19th-century
Prussia (for which income data are available) and modern Germany (for which church
attendance data are available) and is thus not necessarily representative of Prussia or of
Germany. To this dataset, we merge cross-sectional data for Prussian counties used in Becker
and Woessmann (2009). The Appendix provides details on data sources and construction.
III. Evidence on Secularization
The Sacrament Statistics clearly suggest that a process of secularization was underway in the late
19th and early 20th centuries in the Protestant Church in Prussia (s.a. Hölscher (2001), pp. 15-16).
In the 89 counties observed in both 1886 and 1911, church attendance (proxied by participations
in Holy Communion over Protestants) decreased by 12.8 percent from 0.508 to 0.443. From
1862 to 1930 (59 counties), church attendance declined by more than half from 0.561 to 0.258.
Panel estimates with county fixed effects suggest an average annual decline in church
attendance by 0.25 percentage points per year over the quarter century 1886-1911 (Table 1, col.
1).3 Non-linear inspection shows that church attendance was largely flat from 1886 to 1896 and
2
Daily wages of urban male day laborers aged 16 and over, an alternative income measure available only in
1892 and 1901, show the same pattern of results (see Table A6 in the Appendix).
3 Throughout, to reduce measurement error we measure church attendance as average of the actual (e.g., 1886),
the preceding (1885), and the subsequent (1887) years; qualitative results are identical when using the actual year
church-then declined steadily from 1896 to 1911 (col. 2). Earlier data suggest significant decreases also
in 1862-1876 (8.6 percentage points) and in 1876-1886 (3.2 percentage points).
At the same time, income (proxied by teacher income) increased on average by 1.65
percent per year from 1886 to 1911, with the strongest increases from 1891 to 1906 (cols. 3, 4).4
Thus, over the period, a process of secularization coincided with increasing income in Prussia.
IV. Income and Secularization: Empirical Models and Results
We start our investigation of the relationship between income and secularization by looking
separately at cross-sectional variation and at time-series variation, respectively.
In a model that uses only cross-sectional variation – pooled cross-sectional estimation
with time fixed effects – there is a significant negative association between log income and
church attendance; a 10 percentage-point (0.356 standard-deviation) increase in the church
attendance measure is related to a 3.0 percent (0.145 standard-deviation) decline in income
(Table 2, col. 1). (The model follows a standard log earnings equation; in bivariate models,
direction and statistical precision of the estimates are identical in the inverse model with church
attendance as dependent variable.) The pooled estimate reflects a consistent negative
cross-sectional association that is relatively stable over time (e.g., -0.291 in 1886 and -0.309 in 1911,
see Table A2 and Figure A1 in the Appendix). The cross-sectional association remains
attendance data and without averaging, where we have 3,633 data points for our 175 counties in 1886-1911, we get
almost exactly the same estimate (coef. -0.0026, std. err. 0.00008). When we extend the analysis to 1850-1931
(7,261 data points), the average annual decline in church attendance is even larger (coef. -0.0036, std. err. 0.00004).
4 Given that a general price deflator is not available at the time and that the currency is pegged to gold
throughout the period, the analysis is performed with nominal income. Using Desai (1968)’s cost-of-living index to
significantly negative when adding controls for age structure, gender distribution, urbanization,
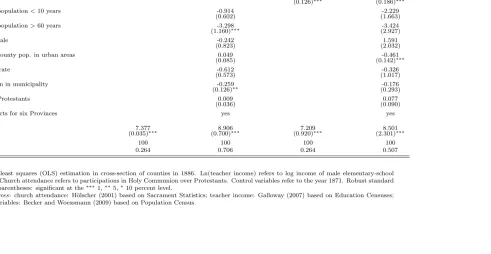
literacy, migration, Protestant share, and Province fixed effects (see Table A3 in the Appendix).5
In a model that uses only time-series variation – with fixed effects for counties but not for
years – there is again a significant negative association between income and church attendance,
now indicating an 18.5 percent decline in income for each 10 percentage-point increase in church
attendance (col. 2).6 This reflects the overall coincidence of increasing income and declining
church attendance in Prussia during this period.
However, once we make direct use of the panel structure of our data, there is little
evidence that these negative associations reflect any causal relationship between income and
secularization.
First, in a simple long first-differenced model that regresses the change in log income
between 1886 and 1911 on the change in church attendance over the same period (where both
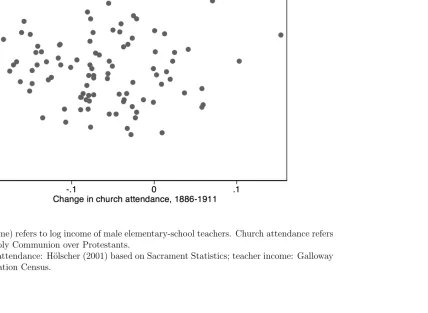
changes show substantial cross-county variation, see Figure A2 in the Appendix), the association
becomes statistically insignificant (col. 3). The point estimate is small and significantly different
from the first two columns. That is, counties with larger decreases in church attendance did not
see significantly larger increases in income, or vice versa.
Second, the association also gets statistically and quantitatively insignificant (and
significantly different from the first two columns) in a panel model with county and time fixed
effects (col. 4). That is, counties that saw relatively strong decreases in church attendance from
5 Unfortunately, these cross-sectional control variables are not consistently available in the panel dimension.
6 This is the only model of Table 2 affected by using the estimate of real (rather than nominal) income, which
one period to the next did not contemporaneously see significantly different relative increases in
income.
Finally, there are also no significant associations when adding lagged church attendance
to the model (col. 5). The same is true when regressing church attendance on income and its lag
(col. 6). That is, lagged church attendance does not predict income and lagged income does not
predict church attendance. Hence in this panel, there is no causality in the spirit of Granger (in
that cause happens before consequence) in either direction.7
The pattern of results is confirmed in a number of robustness checks, including restriction
to mostly Protestant counties and to a balanced sample (see Appendix A5).
V. Conclusion
Annual surveys of the Protestant Regional Churches of Germany on “Expressions of Churchly
Life” uniquely document active religious involvement for a panel of Prussian counties in the late
19th and early 20th centuries. The church attendance data clearly show that – contrary to what
church membership data suggest for the United States – a process of secularization was
underway among Prussian Protestants between 1886 and 1911. Furthermore, using only variation
across counties or using only variation within counties over time, church attendance is strongly
negatively associated with income. However, this association disappears in first-differenced
models of the 1886-1911 change, in panel models with county and time fixed effects, and in
panel Granger-causality tests where secularization does not follow increased income, or vice
7 The same is true in specifications with just the lagged variable (without the contemporaneous one); when
adding the twice-lagged variable; and when including the lag, the contemporaneous, and the lead of the variable (in
versa. It thus seems that unobserved factors correlated with both income and secularization –
e.g., individualism or rationality – and common country-wide trends give rise to the observed
associations. Our findings are not in line with an interpretation that income was a causal driver of
secularization or that changing religious participation affected income.
While the panel analyses cast strong doubt on a causal interpretation of the simple
associations, future research should aim to directly model exogenous variation in income and in
church attendance that would allow for a causal identification of their mutual interdependence.
An investigation of the omitted factors underlying the observed associations would also be
revealing. Furthermore, a comparable analysis of Catholics would be welcome. Finally, different
dimensions of development like income and education may have differing relevance for religious
participation. In fact, in a companion project (Becker, Nagler, and Woessmann (2013)), we find
panel evidence of a relation between increasing enrollment in advanced schools and decreasing
References
Becker, Sascha O., Francesco Cinnirella, Erik Hornung, and Ludger Woessmann. 2012. "iPEHD
- The ifo Prussian Economic History Database." CESifo Working Paper 3904. Munich.
Becker, Sascha O., Markus Nagler, and Ludger Woessmann. 2013. "Education and
secularization: Resurrecting the “traditional view” with panel evidence from German cities,
1890-1930." Work in progress. Munich: Ifo Institute.
Becker, Sascha O., and Ludger Woessmann. 2009. "Was Weber wrong? A human capital theory
of Protestant economic history." Quarterly Journal of Economics 124, no. 2: 531-596. Desai, Ashok V. 1968. Real wages in Germany 1871-1913. Oxford: Clarendon Press.
Finke, Roger, and Rodney Stark. 1992. The churching of America, 1776-1990: Winners and losers in our religious economy. New Brunswick, NJ: Rutgers University Press.
Galloway, Patrick R. 2007. "Galloway Prussia Database 1861 to 1914." patrickgalloway.com.
Galloway, Patrick R., Eugene A. Hammel, and Ronald D. Lee. 1994. "Fertility decline in
Prussia, 1875-1910: A pooled cross-section time series analysis." Population Studies 48, no. 1: 135-158.
Gruber, Jonathan, and Daniel M. Hungerman. 2008. "The Church vs. the Mall: What happens
when religion faces increased secular competition." Quarterly Journal of Economics 123, no. 2: 831-862.
Guiso, Luigi, Paola Sapienza, and Luigi Zingales. 2003. "People's opium? Religion and
economic attitudes." Journal of Monetary Economics 50, no. 1: 225-282.
Hölscher, Lucian. 2005. Geschichte der protestantischen Frömmigkeit in Deutschland. Munich: C.H.Beck.
Iannaccone, Laurence R. 1998. "Introduction to the economics of religion." Journal of Economic Literature 36, no. 3: 1465-1496.
Lipford, Jody W., and Robert D. Tollison. 2003. "Religious participation and income." Journal of Economic Behavior and Organization 51, no. 2: 249-260.
Marx, Karl. 1844. "Zur Kritik der Hegel'schen Rechtsphilosophie: Einleitung." In Deutsch-Französische Jahrbücher, edited by Arnold Ruge and Karl Marx. Paris: Bureau der Jahrbücher: 71-85.
McCleary, Rachel M., and Robert J. Barro. 2006. "Religion and economy." Journal of Economic Perspectives 20, no. 2: 49-72.
Nipperdey, Thomas. 1988. "Religion und Gesellschaft: Deutschland um 1900." Historische Zeitschrift 246, no. 3: 591-615.
Pollack, Detlef. 2003. Säkularisierung - Ein moderner Mythos? Studien zum religiösen Wandel in Deutschland. Tübingen: Mohr Siebeck.
Pollack, Detlef. 2006. "Der Protestantismus in Deutschland in den 1960er und 70er Jahren:
Forschungsprogrammatische Überlegungen." Mitteilungen der Evangelischen Arbeitsgemeinschaft für Kirchliche Zeitgeschichte 24: 103-125.
Schleunes, Karl A. 1989. Schooling and society: The politics of education in Prussia and Bavaria 1750-1900. London: St. Martin’s Press.
Table 1
Trends in Church Attendance and in Income, 1886-1911
Dependent variable: Church attendance ln(teacher income)
(1) (2) (3) (4)
Linear time trend -0.0025 0.0165
(0.0003)∗∗∗ (0.0003)∗∗∗
Year 1891 0.002 0.034
(0.003) (0.005)∗∗∗
Year 1896 -0.0006 0.106
(0.004) (0.005)∗∗∗
Year 1901 -0.011 0.303
(0.005)∗∗ (0.007)∗∗∗
Year 1906 -0.032 0.347
(0.005)∗∗∗ (0.007)∗∗∗
Year 1911 -0.062 0.349
(0.006)∗∗∗ (0.007)∗∗∗
County fixed effects yes yes yes yes
Const. 0.519 0.490 7.118 7.232
(0.005)∗∗∗ (0.004)∗∗∗ (0.006)∗∗∗ (0.004)∗∗∗
Obs. 898 898 1050 1050
Number of counties 175 175 175 175
R2 (within) 0.299 0.378 0.821 0.902
Panel estimation with county fixed effects. Unbalanced panel of counties observed every five years in 1886-1911. Dependent variable in col. 1 and 2: participations in Holy Communion over Protestants; in col. 3 and 4: log income of male elementary-school teachers. Standard errors (clustered by county) in parentheses: significant at the∗∗∗1,∗∗5,∗10 percent level.
Table 2
Income and Church Attendance, 1886-1911
Dependent variable: ln(teacher income) Church attendance
Cross-section Time-series First Two-way
(time fixed effects) (county fixed effects) difference fixed effects
1886-1911
(1) (2) (3) (4) (5) (6)
Church attendance -0.298 -1.852 -0.071 0.066 0.046
(0.031)∗∗∗ (0.228)∗∗∗ (0.129) (0.079) (0.076)
Church attendance (t−5) 0.018
(0.089)
ln(teacher income) 0.009
(0.026)
ln(teacher income) (t−5) 0.035
(0.029)
Time fixed effects yes no no yes yes yes
County fixed effects no yes no yes yes yes
Const. 7.368 8.301 0.355 7.549 7.218 0.169
(0.023)∗∗∗ (0.108)∗∗∗ (0.013)∗∗∗ (0.034)∗∗∗ (0.048)∗∗∗ (0.312)
Obs. 898 898 101 898 705 775
Number of counties 175 175 101 175 167 175
R2 (within) 0.691 0.203 0.003 0.899 0.900 0.430
Unbalanced panel of counties observed every five years in 1886-1911. Dependent variable in col. 1-5: log income of male elementary-school teachers; in col. 6: participations in Holy Communion over Protestants. In col. 3, dependent variable and independent variable refer to the change between 1886 and 1911. Standard errors (clustered by county) in parentheses: significant at the∗∗∗1,∗∗ 5,∗10 percent level.
Appendix
A1. Church Attendance Data
The Protestant Regional Churches of Germany conducted annual surveys of “Expressions of
Churchly Life” between 1880 (with precursors) and World War II (see main text for further
information). Our main indicator of church attendance is the “sacrament participation” (Hölscher
(2001)), measured as the number of participations in Holy Communion divided by the number of
Protestants in a church district. Counting sacrament participations is deemed relatively reliable
because the established practice was to count the number of issued wafers from the number of
wafers before and after the sacrament. As indicated in the main text, the possibility of multiple
individual attendances, the possibility of attending Holy Communion outside the home parish,
and the counting of non-confirmed children among the number of Protestants in the denominator
constitute reasons why the indicator does not directly measure the actual sacrament participation
of parishioners.
While the data were contemporaneously regularly published in a comparative manner at
the level of the Regional Churches, Hölscher (2001)’s “Data Atlas on the Religious Geography
in Protestant Germany: From the Mid-19th Century to the Second World War” for the first time
brings together the district-level data, gathered from regional archives, for the geographic
coverage of modern Germany.8 Hölscher kindly provided us with digital versions of the data as
8 For additional background on secularization in Germany around this time, see Nipperdey (1988) and Hölscher
(2005), and Pollack (2003) for the post-WW II period. In post-WW II West Germany, the share of Protestants
reporting to regularly attend church service declined from 13 percent in 1952 to 8 percent in 2005 (Pollack (2006),
published in the Data Atlas. After assigning IDs to every church district (Kirchenkreis) and cross-checking the data, we combined the data into one panel dataset. In a few cases, data were
reported as double years, e.g., 1892/93. Attendance numbers for double years turned out to be in
the same range as those in single calendar years, so we assigned attendance numbers to the first
year of a double year.
In our analysis, in order to reduce potential measurement error, we take three-year
averages of church attendance around our years of analysis. However, results are equivalent
when using the original year-specific data.
The church attendance data have gaps for some church districts in some years. Our main
analyses in Tables 1 and 2 use an unbalanced panel of observed church attendance (using
three-year averaged data). Table A5 uses a balanced panel of counties where church attendance is
observed in all six waves (as is the income data).
A2. Income Data
Income data refer to income of male elementary-school teachers, the only income data we are
aware of that are available as a panel at the county level over our period of investigation.
Because teacher salaries were almost entirely financed from local contributions at the time, they
should provide a reasonable proxy for average income in the county (cf. Schleunes (1989)).
Becker and Woessmann (2009) show that across the 452 Prussian counties, log teacher income
in 1886 is highly correlated with other measures of economic development such as the size of the
non-agricultural sector in 1882 (correlation coefficient 0.74) and a proxy for average income
constructed from data on income tax and wages of unskilled day laborers in 1900 (0.71).
The data were collected by the Prussian Statistical Office and reported at the level of
all the years 1886, 1891, 1896, 1901, 1906, and 1911. The data are drawn from the Galloway
(2007) Prussia Database and are based on the following volumes of the Preussische Statistik: Volume 101, pp. 2-391 (for 1886); Volume 120, part II, pp. 2-313 (for 1891); Volume 151, part
II, pp. 315 (for 1896); Volume 176, part III, pp. 485 (for 1901); Volume 209, part III, pp.
2-513 (for 1906); and Volume 231, part II, pp. 2-599 (for 1911).
In several cases, county reforms led to the split of counties into smaller units over time;
typically, with increasing urbanization, counties were split into urban counties (Stadtkreise) and rural counties (Landkreise). In those cases, we aggregated data in later years up to the boundaries as of earlier years. Since teacher income data are complete for all years 1886, 1891, …, 1911,
this yields a balanced panel of teacher income data in constant county borders.
There are two changes in how teacher income is reported over time. First, in 1886 and
1891, teacher income covers only direct wage payments, but not extras such as housing
allowances and any other allowances. From 1896 onwards, data include all components of
income. To make data consistent over time, we pre-multiply direct wage payments in 1886 and
1891 by the county-specific ratio of total income over (only) wage payments observed in 1896.
Second, in 1911, income is only reported as total income of male and female
elementary-school teachers combined, whereas for all other years both genders are reported separately. In
1911, we impute income of male elementary-school teachers by pre-multiplying total income of
elementary-school teachers by the county-specific share of male teachers in total income
observed in 1906.
As an alternative income measure available only in 1892 and 1901, Table A6 uses daily
wages of urban male day laborers aged 16 and over, taken from the Social Security Statistics.
contributions to the compulsory Health Insurance System (1.5 percent of the customary wage
paid to day laborers), indicating that they were considered sufficiently representative of wages in
low-income households and thus constitute a useful proxy for their local standard of living. The
source of the variable is Georg Neuhaus, “Die ortsüblichen Tagelöhne gewöhnlicher
Tagearbeiter in Preußen 1892 und 1901,” Zeitschrift des Königlich Preussischen Statistischen
Bureaus, 44 (1904), 310-346. For additional information, see Becker and Woessmann (2009) and the ifo Prussian Economic History Database (iPEHD) described in Becker, Cinnirella, Hornung,
and Woessmann (2012).
A3. Additional Data
The control variables used in Table A3 are taken from the Prussian Population Census in 1871.
First used in Becker and Woessmann (2009), who provide variable definitions and detailed
documentation (see also iPEHD), they are based on Königliches Statistisches Bureau, Die Gemeinden und Gutsbezirke des Preussischen Staates und ihre Bevölkerung: Nach den Urmaterialien der allgemeinen Volkszählung vom 1. December 1871 (Berlin: Verlag des Königlichen Statistischen Bureaus, 1874).
The Population Census provides data on several measures that are often used in the
church attendance literature and in the income literature, such as the age structure (where, in
addition to the share of the population below 10 years of age, we also use the share of the
population aged 60 and older from Galloway (2007)), gender distribution, the share of the county
population. Unfortunately, these cross-sectional control variables are not consistently available in
the panel dimension.9
In the province of Hannover, county borders changed substantially between 1871 and
1886 in a fashion that prevents re-aggregation (for example, two old counties split and merged
into three new counties). Counties in the province of Hannover are therefore dropped in the
regression analyses in Table A3 that involve control variables from 1871.
A4. Merging the Datasets
We merge the church attendance and income data by assigning the income data, available at the
level of the administrative county, to that church district (for which we have church attendance
data) which contains the capital of the administrative county (same for the 1871 control variables
available for administrative counties). In cases where several county capitals are located in the
same district, we aggregated the county data up to the church district level (taking
population-weighted averages of income data).
To make regional entities comparable over time in face of territorial changes during our
period of observation, we aggregated church-district and county data up to the highest level at
which consistency over time is given.
Our resulting dataset covers an unbalanced panel of 175 separate territorial entities
(which we refer to as “counties”) spanning 1886-1911. These counties constitute the intersection
between modern Germany (for which Hölscher (2001) collected church attendance data) and
9 Available data suggest that church membership barely changed over our period of investigation. On average
across the 508 (593) Prussian counties in 1885 (1910), 65.9 (63.4) percent of inhabitants were Protestants, 32.8
(35.3) percent Catholics, 0.25 (0.43) percent other Christians, 0.99 (0.65) percent Jews, and only 0.01 (0.16) percent
Prussia at the end of the 19th century (for which Prussian census records provide income data).
Due to the intersection requirement, our analysis does not cover the non-Prussian parts of
modern Germany (esp. the Southern parts) and the parts of Prussia not located in modern
Germany (esp. the Eastern Provinces located in modern Poland and Russia). Due to lack of
church-district data, we also miss the Province of Brandenburg (except for Berlin) and Western
Pomerania.
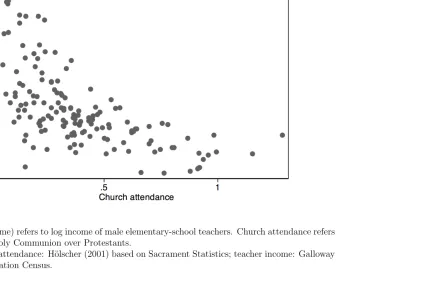
Table A1 provides descriptive statistics. Figure A1 shows a scatterplot of income and
church attendance in 1911.
A5. Robustness Checks
The pattern of results of the basic models presented in the paper is confirmed in a number of
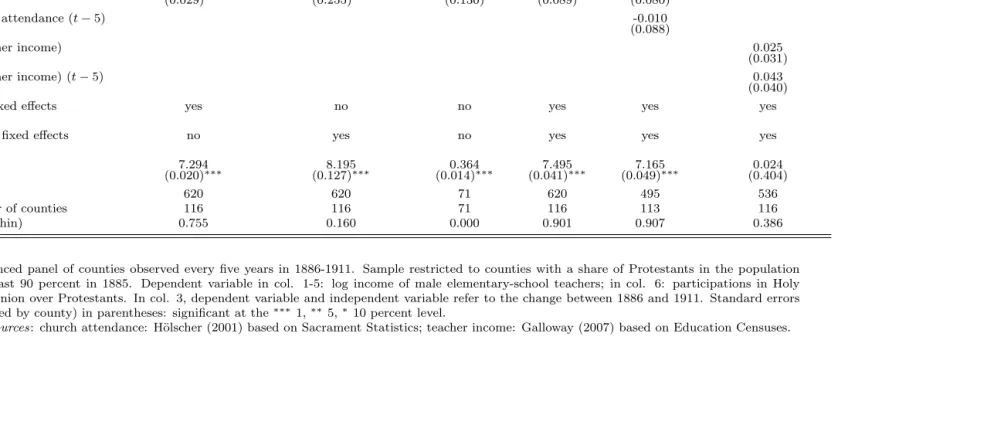
robustness checks. First, results are robust in the subsample of 116 counties with more than 90
percent Protestant population (Table A4), which shows that results are not affected by the fact
that income refers to all teachers while church attendance refers to Protestants. Second, results
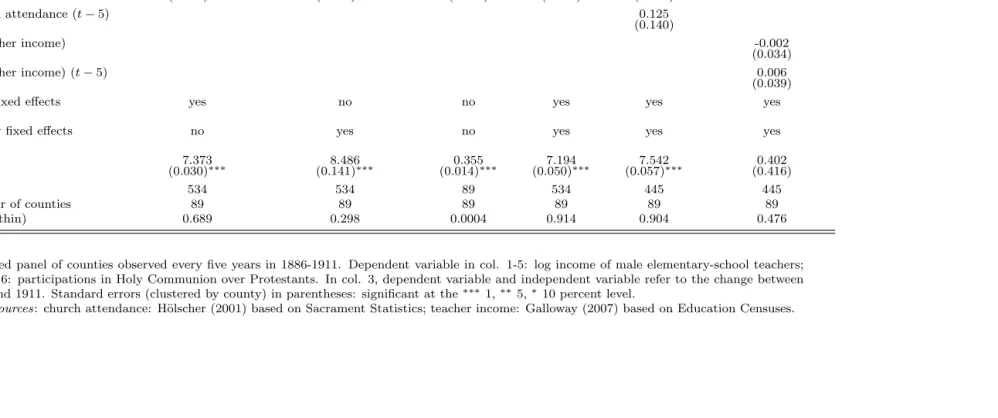
are robust in a balanced sample of 89 counties with full data in all six waves (Table A5). Finally,
results are robust when dropping Berlin (which has the highest income level in most waves) and
when dropping the two counties with participations in Holy Communion over Protestants larger
Table A1 Descriptive Statistics
Obs. Mean Std. Dev. Min Max
(1) (2) (3) (4) (5)
Church attendance
Pooled 898 0.47 0.28 0.06 1.48
1886 123 0.53 0.28 0.07 1.48
1891 149 0.50 0.28 0.07 1.42
1896 156 0.49 0.28 0.07 1.43
1901 162 0.48 0.29 0.07 1.40
1906 160 0.46 0.28 0.06 1.35
1911 148 0.39 0.25 0.06 1.29
Change 1886-1911 101 -0.07 0.07 -0.20 0.15
ln(teacher income)
Pooled 1,050 7.42 0.21 6.94 8.08
1886 175 7.23 0.16 6.95 7.78
1891 175 7.27 0.16 6.94 7.91
1896 175 7.34 0.15 7.08 8.06
1901 175 7.54 0.13 7.25 8.04
1906 175 7.58 0.15 7.29 8.08
1911 175 7.58 0.12 7.39 7.99
Change 1886-1911 101 0.36 0.09 0.19 0.59
Control variables (1871)
Share of population<10 years 100 0.24 0.02 0.19 0.28
Share of population>60 years 100 0.08 0.01 0.04 0.10
Share female 100 0.51 0.02 0.44 0.54
Share of county pop. in urban areas 100 0.31 0.19 0.06 1.00
Share literate 100 0.95 0.02 0.87 0.99
Share born in municipality 100 0.66 0.10 0.40 0.85
Share of Protestants 100 0.81 0.28 0.03 1.00
Church attendance refers to participations in Holy Communion over Protestants. Ln(teacher income) refers to log income of male elementary-school teachers.
Table A2
Income and Church Attendance: Year-by-Year Cross-Sections
1886 1891 1896 1901 1906 1911
(1) (2) (3) (4) (5) (6)
Church attendance -0.291 -0.334 -0.321 -0.256 -0.286 -0.309
(0.042)∗∗∗ (0.033)∗∗∗ (0.034)∗∗∗ (0.031)∗∗∗ (0.038)∗∗∗ (0.037)∗∗∗
Const. 7.365 7.426 7.497 7.657 7.705 7.705
(0.030)∗∗∗ (0.022)∗∗∗ (0.023)∗∗∗ (0.020)∗∗∗ (0.022)∗∗∗ (0.020)∗∗∗
Obs. = number of counties 123 149 156 162 160 148
R2 0.308 0.384 0.381 0.314 0.321 0.376
Dependent variable: log income of male elementary-school teachers. Ordinary least squares (OLS) estimations in cross-sections of counties for respective year indicated in header. Church attendance refers to participations in Holy Communion over Protestants. Robust standard errors in parentheses: significant at the∗∗∗1,∗∗5,∗10 percent level.
Table A3
Income and Church Attendance, 1886
Dependent variable: ln(teacher income) Church attendance
(1) (2) (3) (4)
Church attendance -0.285 -0.183
(0.052)∗∗∗ (0.049)∗∗∗
ln(teacher income) -0.927 -1.000
(0.126)∗∗∗ (0.186)∗∗∗
Share of population<10 years -0.914 -2.229
(0.602) (1.663)
Share of population>60 years -3.298 -3.424
(1.160)∗∗∗ (2.927)
Share female -0.242 1.591
(0.823) (2.032)
Share of county pop. in urban areas 0.049 -0.461
(0.085) (0.142)∗∗∗
Share literate -0.612 -0.326
(0.573) (1.017)
Share born in municipality -0.259 -0.176
(0.126)∗∗ (0.293)
Share of Protestants 0.009 0.077
(0.036) (0.090)
Fixed effects for six Provinces yes yes
Const. 7.377 8.906 7.209 8.501
(0.035)∗∗∗ (0.700)∗∗∗ (0.920)∗∗∗ (2.301)∗∗∗
Obs. 100 100 100 100
R2 0.264 0.706 0.264 0.507
Ordinary least squares (OLS) estimation in cross-section of counties in 1886. Ln(teacher income) refers to log income of male elementary-school teachers. Church attendance refers to participations in Holy Communion over Protestants. Control variables refer to the year 1871. Robust standard errors in parentheses: significant at the∗∗∗1,∗∗5,∗10 percent level.
Table A4
Restriction to Counties with at least 90 Percent Protestants
Dependent variable: ln(teacher income) Church attendance
Cross-section Time-series First Two-way
(time fixed effects) (county fixed effects) difference fixed effects
1886-1911
(1) (2) (3) (4) (5) (6)
Church attendance -0.224 -1.610 -0.003 0.109 0.104
(0.029)∗∗∗ (0.255)∗∗∗ (0.130) (0.089) (0.080)
Church attendance (t−5) -0.010
(0.088)
ln(teacher income) 0.025
(0.031)
ln(teacher income) (t−5) 0.043
(0.040)
Time fixed effects yes no no yes yes yes
County fixed effects no yes no yes yes yes
Const. 7.294 8.195 0.364 7.495 7.165 0.024
(0.020)∗∗∗ (0.127)∗∗∗ (0.014)∗∗∗ (0.041)∗∗∗ (0.049)∗∗∗ (0.404)
Obs. 620 620 71 620 495 536
Number of counties 116 116 71 116 113 116
R2 (within) 0.755 0.160 0.000 0.901 0.907 0.386
Unbalanced panel of counties observed every five years in 1886-1911. Sample restricted to counties with a share of Protestants in the population of at least 90 percent in 1885. Dependent variable in col. 1-5: log income of male elementary-school teachers; in col. 6: participations in Holy Communion over Protestants. In col. 3, dependent variable and independent variable refer to the change between 1886 and 1911. Standard errors (clustered by county) in parentheses: significant at the∗∗∗1,∗∗ 5,∗10 percent level.
Table A5
Balanced Panel of Counties with Observed Data in All Waves
Dependent variable: ln(teacher income) Church attendance
Cross-section Time-series First Two-way
(time fixed effects) (county fixed effects) difference fixed effects
1886-1911
(1) (2) (3) (4) (5) (6)
Church attendance -0.281 -2.271 -0.024 0.076 -0.081
(0.043)∗∗∗ (0.294)∗∗∗ (0.131) (0.099) (0.132)
Church attendance (t−5) 0.125
(0.140)
ln(teacher income) -0.002
(0.034)
ln(teacher income) (t−5) 0.006
(0.039)
Time fixed effects yes no no yes yes yes
County fixed effects no yes no yes yes yes
Const. 7.373 8.486 0.355 7.194 7.542 0.402
(0.030)∗∗∗ (0.141)∗∗∗ (0.014)∗∗∗ (0.050)∗∗∗ (0.057)∗∗∗ (0.416)
Obs. 534 534 89 534 445 445
Number of counties 89 89 89 89 89 89
R2 (within) 0.689 0.298 0.0004 0.914 0.904 0.476
Balanced panel of counties observed every five years in 1886-1911. Dependent variable in col. 1-5: log income of male elementary-school teachers; in col. 6: participations in Holy Communion over Protestants. In col. 3, dependent variable and independent variable refer to the change between 1886 and 1911. Standard errors (clustered by county) in parentheses: significant at the∗∗∗1,∗∗ 5,∗10 percent level.
Table A6
Alternative Income Measure: Wages of Day Laborers in 1892 and 1901
Dependent variable: ln(day laborer wages)
Cross-section Time-series First Two-way
(time fixed effects) (county fixed effects) difference fixed effects
1892-1901
(1) (2) (3) (4) (5)
Church attendance -0.309 -1.547 -0.131 -0.131 -0.164
(0.035)∗∗∗ (0.662)∗∗ (0.208) (0.208) (0.233)
Church attendance (t−5) 0.224
(0.226)
Time fixed effects yes no no yes yes
County fixed effects no yes no yes yes
Const. 0.707 1.363 0.146 0.619 0.515
(0.024)∗∗∗ (0.313)∗∗∗ (0.009)∗∗∗ (0.1)∗∗∗ (0.101)∗∗∗
Obs. 244 244 113 244 216
Number of counties 131 131 113 131 126
R2 0.399 0.138 0.003 0.753 0.796
Unbalanced panel of counties observed in 1892 and 1901. Dependent variable: log daily wages of urban male day laborers aged 16 and over. Church attendance refers to participations in Holy Communion over Protestants. In col. 3, dependent variable and independent variable refer to the change between 1892 and 1901. Standard errors (clustered by county) in parentheses: significant at the∗∗∗1,∗∗ 5,∗10 percent level.
Figure A1
Income and Church Attendance, 1911
Note: Ln(teacher income) refers to log income of male elementary-school teachers. Church attendance refers to participations in Holy Communion over Protestants.
Figure A2
Change in Income and in Church Attendance, 1886-1911
Note: Ln(teacher income) refers to log income of male elementary-school teachers. Church attendance refers to participations in Holy Communion over Protestants.