ORIGINAL RESEARCH
ADULT BRAIN
Analysis of White Matter Damage in Patients with Multiple
Sclerosis via a Novel In Vivo MR Method for Measuring Myelin,
Axons, and G-Ratio
X A. Hagiwara,XM. Hori,XK. Yokoyama,X M. Nakazawa,X R. Ueda,X M. Horita,XC. Andica,XO. Abe, andXS. Aoki
ABSTRACT
BACKGROUND AND PURPOSE: Myelin and axon volume fractions can now be estimated via MR imaging in vivo, as can the g-ratio, which equals the ratio of the inner to the outer diameter of a nerve fiber. The purpose of this study was to evaluate WM damage in patients with MS via this novel MR imaging technique.
MATERIALS AND METHODS: Twenty patients with relapsing-remitting MS with a combined total of 149 chronic plaques were analyzed. Myelin volume fraction was calculated based on simultaneous tissue relaxometry. Intracellular and CSF compartment volume fractions were quantified via neurite orientation dispersion and density imaging. Axon volume fraction and g-ratio were calculated by combining these measurements. Myelin and axon volume fractions and g-ratio were measured in plaques, periplaque WM, and normal-appearing WM.
RESULTS:All metrics differed significantly across the 3 groups (P⬍.001, exceptP⫽.027 for g-ratio between periplaque WM and normal-appearing WM). Those in plaques differed most from those in normal-appearing WM. The percentage changes in plaque and periplaque WM metrics relative to normal-appearing WM were significantly larger in absolute value for myelin volume fraction than for axon volume fraction and g-ratio (P⬍.001, exceptP⫽.033 in periplaque WM relative to normal-appearing WM for comparison between myelin and axon volume fraction).
CONCLUSIONS: In this in vivo MR imaging study, the myelin of WM was more damaged than axons in plaques and periplaque WM of patients with MS. Myelin and axon volume fractions and g-ratio may potentially be useful for evaluating WM damage in patients with MS.
ABBREVIATIONS:AVF⫽axon volume fraction; EDSS⫽Expanded Disability Status Scale; MVF⫽myelin volume fraction; NAWM⫽normal-appearing white matter; NODDI⫽neurite orientation dispersion and density imaging; PD⫽proton density; PWM⫽periplaque white matter; Vic⫽volume fraction of the intracellular compartment; Vec⫽volume fraction of the extracellular compartment; Viso⫽volume fraction of the CSF compartment
M
R imaging, particularly T2-weighted imaging, is used for diagnosis and follow-up in patients with MS.1Advanced MR imaging modalities such as DTI, diffusional kurtosis imaging,q-space imaging, and MR spectroscopy have revealed abities that were not apparent on conventional T2WI in the normal-appearing white matter (NAWM)2,3and periplaque white matter (PWM)4,5in the brains of patients with MS. A recently developed quantification pulse sequence called QRAPMASTER (an acro-nym derived from “quantification of relaxation times and proton density by multiecho acquisition of a saturation-recovery by us-ing turbo spin-echo readout”) has enabled the rapid simultaneous quantification of R1 and R2 relaxation rates and proton density (PD) in approximately 5 minutes, and thus enabled the use of these measurements in clinical practice.6,7Myelin volume frac-tion (MVF) can also be estimated based on R1, R2, and PD mea-surements.8 The model hypothesizes 4 compartments in the brain: the myelin partial volume (or MVF), the cellular partial volume, the free water partial volume, and the excess parenchy-mal water partial volume. It assumes that the relaxation behavior of each compartment contributes to the effective relaxation be-havior of an acquisition voxel as a whole. In this model, the mag-netization exchange rates between tissue compartments are Received March 15, 2017; accepted after revision May 24.
From the Departments of Radiology (A.H., M. Hori., M.N., R.U., M. Horita, C.A., S.A.) and Neurology (K.Y.), Juntendo University School of Medicine, Tokyo, Japan; De-partment of Radiology (A.H., O.A.), Graduate School of Medicine, University of Tokyo, Tokyo, Japan; and Department of Radiological Sciences (R.U.), Graduate School of Human Health Sciences, Tokyo Metropolitan University, Tokyo, Japan. This work was supported by JSPS KAKENHI grant number 16K19852; grant number JP16H06280, Grant-in-Aid for Scientific Research on Innovative Areas - Resource and technical support platforms for promoting research “Advanced Bioimaging Support”; the Japan Radiological Society and Bayer Yakuhin (KJ-08); the Impulsing Paradigm Change through disruptive Technologies (ImPACT) Program of the Coun-cil for Science, Technology and Innovation (Cabinet Office, Government of Japan); and the program for Brain Mapping by Integrated Neurotechnologies for Disease Studies (Brain/MINDS) from the Japan Agency for Medical Research and Development, AMED.
Please address correspondence to Akifumi Hagiwara, MD, Department of Radiol-ogy, Juntendo University School of Medicine, 1-2-1, Hongo, Bunkyo-ku, Tokyo, Japan, 113-8421; e-mail: [email protected]
Indicates open access to non-subscribers at www.ajnr.org
considered to be simulated by using Bloch estimation. MVF mea-sured by this model has been validated by myelin staining of brain sections derived from cadavers.9 We have previously reported that MVF, excess parenchymal water partial volume, R1, R2, and PD differed significantly across NAWM, PWM, and plaques.10In plaques, these parameters differed most from those in NAWM. The percentage differences in MVF and excess parenchymal water partial volume for plaques and PWM relative to NAWM differed significantly from those of R1, R2, and PD. It was concluded that MVF and excess parenchymal water partial volume are more sen-sitive to the MS disease process than R1, R2, and PD.
Neurite orientation dispersion and density imaging (NODDI) is one of the recently developed advanced diffusion metrics that assumes 3 compartments: a restricted intracellular compartment (Vic), a hindered extracellular compartment (Vec), and CSF with free diffusion (Viso).11Vic is attributed to the density of “neu-rites” (ie, axons and dendrites). As opposed to DTI, which is sen-sitive to the partial volume averaging of fiber orientations, NODDI incorporates the curving and fanning of fibers into the model and is considered to be more robust for estimating the volume of axons.12Even though it was not explicitly designed for handling the crossing of fibers, a preliminary study has also shown the robustness of the NODDI model for crossing fibers.13
The g-ratio, which is the ratio of the inner (axon only) to the outer diameter of a myelinated axon (axon plus myelin), is asso-ciated with speed of conduction.14Larger axons and thicker my-elin sheaths give rise to faster conduction of electrochemical in-formation, but there is a trade-off between these because of the limited space in the brain. G-ratio has a limited dynamic range in healthy WM13and depends on age15-17and region.15,18Stikov et al12developed a model that estimates “aggregate” g-ratio in a voxel via MR imaging. This model assumes that the g-ratios of all axons in a voxel are the same. Otherwise, the measured g-ratio would be the value if all of the myelin and axons were redistrib-uted in a voxel such that all axons had the same g-ratio. Combin-ing MVF, Viso, and Vic enables the calculation of axon volume fraction (AVF) and g-ratio. Notably, these measurements are spe-cific to WM and not defined in GM.13These novel MR imaging methods in combination may differentiate between demyelina-tion and axonal degenerademyelina-tion, whereas convendemyelina-tional T2WI or FLAIR images cannot. Remyelinated lesions are known to have thinner myelin sheaths and higher g-ratios than normal tissue.19 G-ratio may also be useful for the evaluation of treatment effects in patients with MS.
The aim of the current study was to evaluate WM damage in patients with MS via novel MR imaging methods for quantifying MVF, AVF, and g-ratio.
MATERIALS AND METHODS
Study ParticipantsThis prospective study recruited 24 patients with relapsing-remit-ting MS between April and July 2016. These patients were diag-nosed according to standard criteria.1,20,21Of these patients, 1 did not have any plaques on brain MR imaging, the images of 1 were degraded by motion artifacts, and 2 had extensive WM abnormal-ities and it was difficult to evaluate focal plaques correctly. There-fore, these 4 patients were excluded, and 20 patients (5 men and
15 women; mean age, 46.7 years; age range, 31– 67 years) were included in the analysis. The median Expanded Disability Status Scale (EDSS) score22at imaging was 1.3 (range, 0 –7), and the mean disease duration was 11.5⫾7.5 years. The institutional review board of Juntendo University Hospital approved this study, and written informed consent was obtained from all participants.
MR Imaging
All MR imaging was performed on a 3T system (Discovery MR750w; GE Healthcare, Milwaukee, Wisconsin) with a 24-channel head coil. All patients underwent MR relaxometry and diffusion-weighted, conventional T1-weighted, T2-weighted, and FLAIR imaging.
MR relaxometry was performed with a 2D axial pulse se-quence. This is a multisection, multiecho, multisaturation delay saturation-recovery turbo spin-echo acquisition method in which images are collected with different combinations of TEs and sat-uration delay times.6In Juntendo University Hospital, combina-tions of 2 TEs and 4 delay times were used to generate a matrix of 8 complex images that were then used to quantify longitudinal R1 relaxation and transverse R2 relaxation rates and PD. The TEs used were 16.9 and 84.5 ms, and the delay times were 146, 546, 1879, and 3879 ms. The TR was 4.0 seconds. The other parameters used for MR relaxometry were as follows: FOV, 240⫻240 mm; matrix, 320⫻320; echo-train length, 10; bandwidth, 31.25 kHz; section thickness/gap, 4.0 mm/1.0 mm; sections, 30; and acquisi-tion time, 7 minutes 12 seconds.
With the assumption that all the R1, R2, and PD values of myelin partial volume (or MVF), excess parenchymal water par-tial volume, cellular parpar-tial volume, and free water parpar-tial volume contribute to the effective R1, R2, and PD in each acquisition voxel, a model was produced to estimate partial volumes of these 4 compartments as described by Warntjes et al.8This was done by running Bloch equations and optimizing model parameters in a spatially normalized and averaged brain from a group of healthy controls. Using this model, MVF maps were created from R1, R2, and PD maps via SyMRI software (version 8.0; SyntheticMR, Linko¨ping, Sweden). Although the more commonly used method (ie, quantitative magnetization transfer imaging) for estimating MVF to be used for calculating g-ratio requires a scaling factor to estimate MVF from measured macromolecular pool size based on proportionality,12we omitted this procedure because the method we used directly estimates the volume fraction of myelin in a voxel.8The R1, R2, and PD maps were also used to create synthetic T2WI with the following parameters: TR, 4500 ms; TE, 100 ms.
length, 16; section thickness/gap, 4.0/1.0 mm; and number of sec-tions, 30.
Single-shot echo-planar imaging was performed for DWI by using 2 b-values (30 directions withb⫽1000 seconds/mm2and 60 directions withb⫽2000 seconds/mm2). Non-DWI (b⫽0 seconds/mm2) was also acquired. An array spatial sensitivity en-coding technique (ASSET) with an acceleration factor of 2 was used. Other parameters used for diffusion MR imaging were as follows: TR, 5000 ms; TE, 88.2 ms; diffusion gradient pulse dura-tion, 41.184 ms; diffusion gradient separadura-tion, 29.596 ms; FOV, 256⫻256 mm; matrix, 256⫻256; echo-train length, 128; band-width, 1953.12 kHz; section thickness/gap, 4.0 mm/1.0 mm; sec-tions, 30; and acquisition time, 7 minutes 40 seconds.
For DWI, distortions caused by eddy currents and motion effects were corrected by using affine whole-brain registration to
b⫽0 images with consideration of through-plane distortion in addition to in-plane distortion.23Images were then denoised by using multishell position-orientation adaptive smoothing based on the propagation-separation approach.24,25 This algorithm does not assume a specific model and can be used for any diffusion model including NODDI. Instead of treating data from each shell separately, we treated the 2-shell diffusion data simultaneously for denoising to improve stability.25
We used the NODDI Matlab Toolbox5 (http://www.nitrc.org/ projects/noddi_toolbox) to fit the NODDI model to the acquired and processed diffusion-weighted data to create maps of intracel-lular volume fraction (Vic), orientation dispersion index, and
iso-tropic volume fraction (Viso). Extract-ing free diffusion compartment Viso, remaining Vic plus extracellular volume fraction Vec equals 1. The computa-tional procedure for NODDI was accel-erated by a convex optimization proce-dure that converts the nonlinear fitting into a linear one.26
Maps of AVF and g-ratio were ob-tained as described by Stikov et al.12 Be-cause transverse relaxation time T2 of myelin water is approximately 10 ms27 and much shorter than the TE (88.2 ms in this study) for acquiring sufficient dif-fusion sensitization, the signal of myelin is negligible in the NODDI model, but the volume of myelin is not. In other words, the volume fractions estimated by NODDI correspond to nonmyeli-nated tissue. Therefore, AVF is given by the following equation:
AVF⫽共1⫺MVF兲共1⫺Viso兲Vic.
G-ratio is calculated by using fiber vol-ume fraction (FVF) and AVF:
AVF/FVF⫽g2.
MVF is:
MVF⫽FVF⫺AVF.
Thus, g-ratio is calculated as follows:
g⫽
冑
1/关1⫹共MVF/AVF兲兴.These calculations were performed by using an in-house program developed with Matlab (MathWorks, Natick, Massachusetts). Linear transformation was performed to register the acquired images.
Image Analysis
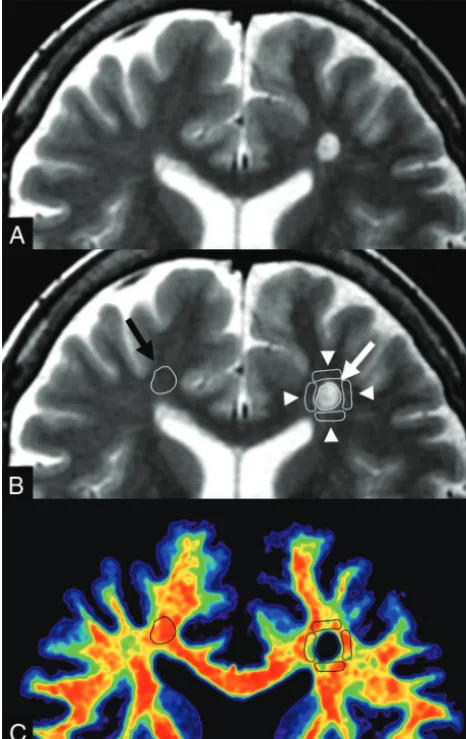
Synthetic T2WI and maps of MVF, AVF, and g-ratio (Fig 1) were converted to DICOM files and analyzed by using OsiriX Imaging Software, Version 7.5 (http://www.osirix-viewer.com). An expe-rienced neuroradiologist (A.H.) used conventional and synthetic MR images to confirm 150 plaques (defined as a WM area of more than 5 mm in diameter in the supratentorial area with abnormally high intensity on a T2WI). Of these, 1 plaque was new compared with the MR imaging performed 2 months earlier. None of the other lesions showed remarkable change compared with the MR imaging performed at least 1 year earlier. These 149 plaques were considered chronic and were used for ROI analysis. The mean number of plaques in the 20 patients was 7.45⫾4.52. A.H. man-ually drew freehand ROIs on plaques, PWM, and NAWM on synthetic T2WI. An ROI was placed to encircle a plaque, and up to 4 ROIs, approximately half the size of the ROI of that plaque, were also placed on the PWM (defined as a normal-intensity WM area closest to and surrounding a plaque) (Fig 2).4,5,10The PWM ROIs were placed approximately 90° from the adjacent ROI to form a FIG 1. Representative images from a patient with MS. Synthetic T2WI (A) and maps of myelin
[image:3.594.56.376.47.345.2]box that surrounded the plaque. If a PWM ROI overlapped CSF, GM, or other plaques, it was discarded; 206 PWM ROIs were removed on this basis (ie, 390 PWM ROIs were used for analysis). The ROI of the plaque was copied and pasted on the contralateral NAWM. The mean ROI sizes were 45.17⫾30.19 mm2for plaques and 22.72⫾15.16 mm2for PWM. All the ROIs made on synthetic T2WI were copied and pasted onto the MVF, AVF, and g-ratio maps for the same patient, and the mean value of each ROI was recorded. To confirm the accuracy of ROI analyses, a second in-vestigator (M. Horita) blinded to the patient information also independently conducted the same measurements.
Statistical Analysis
Because not all data were normally distributed, we used the Steel-Dwass test for multiple comparisons to compare MVF, AVF, and g-ratio values among plaques, PWM, and NAWM. The percent-age changes of plaques or PWM relative to NAWM were also calculated and compared among different metrics (ie, MVF, AVF,
and g-ratio). The signs of the percentage changes for MVF and AVF were inverted for statistical analysis because these values were higher overall in NAWM than in plaques and PWM. EDSS and disease duration were correlated with MVF, AVF, and g-ratio of NAWM averaged in each patient via the Spearman rank order correlation coefficient. A 2-sidedPvalue⬍.05 was considered significant. All statistical analyses were performed with the soft-ware package R, version 3.2.1 (http://www.r-project.org/).
RESULTS
The results of ROI analysis and comparisons among plaques, PWM, and NAWM are shown inTable 1. MVF, AVF, and g-ratio all differed significantly among plaques, PWM, and NAWM. MVF and AVF were lower in plaques and PWM than in NAWM, with plaques showing the lowest value (P⬍.001), and g-ratio was higher in plaques and PWM than in NAWM, with plaques showing the highest value (P⬍.001, exceptP⫽.027 for g-ratio between PWM and NAWM).
The percentage changes of MVF, AVF, and g-ratio in plaques and PWM relative to NAWM are shown inTable 2. Those of MVF and AVF in plaques relative to NAWM differed significantly more from zero than that of g-ratio, with that of MVF differing the most from zero (P ⬍.001, exceptP ⫽.016 for comparison between those of AVF and g-ratio). Those of MVF and AVF in PWM relative to NAWM differed significantly more from zero than that of g-ratio, with that of MVF differing the most from zero (P⬍.001, exceptP⫽.033 for comparison between those of MVF and AVF).
The interobserver reproducibility between the 2 observers (A.H. and M. Horita) for the mean MVF values was measured. The inter-class correlation coefficient for plaques was 0.84 (95% CI, 0.78 – 0.88), that for PWM was 0.94 (95% CI, 0.92– 0.96), and that for NAWM was 0.89 (95% CI, 0.85– 0.92).
Significant correlations with EDSS and disease duration were not found for MVF, AVF, and g-ratio of NAWM averaged in each patient (EDSS versus MVF,P⫽.25; EDSS versus AVF,P⫽.87; EDSS versus g-ratio,P⫽.80; disease duration versus MVF,P⫽
.25; disease duration versus AVF,P⫽.26; disease duration versus g-ratio,P⫽.22).
[image:4.594.53.286.49.418.2]FIG 2. An example of ROI analysis in a patient with MS. The upper 2 images show the same synthetic T2WI without (A) and with (B) the placement of ROIs. A ROI (white arrow) was drawn on a plaque, and 4 ROIs (arrowheads) were placed on periplaque white matter to encir-cle the plaque. The ROI of the plaque was copied and pasted onto the contralateral normal-appearing white matter (black arrow). These ROIs were then copied and pasted onto maps of myelin volume frac-tion, axon volume fracfrac-tion, and g-ratio. A map of the corresponding myelin volume fraction (C) is shown as an example.
Table 1: Descriptive values of plaques, PWM, and NAWM MVF (%)a AVF (%)a G-Ratio (%)a
Plaques 5.97⫾4.86 31.49⫾10.39 0.93⫾0.058
PWM 25.74⫾4.42 39.08⫾7.09 0.77⫾0.049
NAWM 30.96⫾3.74 44.10⫾7.56 0.76⫾0.051
a
Values are mean⫾SD.P⬍.001 for all metrics among each tissue type, exceptP⫽
.027 for g-ratio between PWM and NAWM.
Table 2: Percentage changes of MVF, AVF, and g-ratio in plaques and PWM relative to NAWM
MVF (%)a AVF (%)a G-Ratio (%)a
Plaques 80.78⫾15.27 27.18⫾25.27 23.81⫾11.52
PWM 16.19⫾14.82 9.31⫾22.05 2.17⫾8.24
aValues are mean⫾SD.P⬍.001 for percentage changes of plaques and PWM relative to NAWM for comparisons among all metrics, exceptP⫽.016 for percentage change of plaques relative to NAWM when comparing between AVF and g-ratio, and
[image:4.594.302.531.55.101.2] [image:4.594.299.532.146.183.2]DISCUSSION
The observation of lower MVF in plaques and PWM than in NAWM, with plaques showing the lowest value, is consistent with the results of our previous report.10In this study, AVF of PWM was also in between that of NAWM and plaques, with plaques showing the lowest value. However, the percentage changes of MVF for plaques and PWM relative to NAWM were higher than those of AVF. This implies that myelin was more damaged than axons in plaques and PWM. This corresponds to the results of previous histologic studies showing that demyelination is the pri-mary event in patients with MS, and axons are relatively preserved in chronic plaques.28 Even though Wallerian degeneration is known to cause axonal loss and contribute to secondary myelin degradation in PWM,29,30myelin loss may be the primary event in PWM as well as in plaques.28However, there is growing evi-dence that axonal damage is also a feature of MS that is associated with long-term disability and functional deficits.31For example, the average percentage change of AVF in plaques relative to NAWM in our study was 27.18%, lower than the value (68%) reported by Bjartmar et al32for histopathologic average axonal loss in MS lesions. However, their study involved the spinal cords of 5 paralyzed patients with MS with EDSS scores of ⱖ7.5, whereas the median EDSS score of the patients in our study was much lower (1.3), and the degrees of axonal damage in the pa-tients in the 2 studies were presumably different. A greater num-ber of patients would be required to stratify them according to EDSS to investigate patterns of myelin and axonal damage ac-cording to disease progression. In the current study, neither EDSS nor disease duration were significantly correlated with MVF, AVF, or g-ratio in NAWM. Correlations between clinical indica-tors and MVF, AVF, and g-ratio should also be re-evaluated in a larger study.
Our study is the first to report the g-ratio in the brains of a number of patients with MS. The average g-ratio of 0.76 in NAWM of patients with MS in this study is almost equal to the value of 0.75 in a patient with MS measured via MR imaging reported by Stikov et al.12In the current study, the average g-ratio of MS plaques was higher than that of NAWM (0.93 versus 0.76). This is consistent with a histologic study that showed myelin is thinner in plaques even after partial remyelination.17Although our result for the relationship of g-ratios between MS plaques and NAWM corresponds to the aforementioned report by Stikov et al,12the reported average g-ratio for plaques was 0.80 in that study, which is lower than that of the current study (0.93). This difference in g-ratios may be related to variations in the disease duration and differences in the methods used to measure g-ratio. In the current study, g-ratios in various regions were averaged, and the dependence of g-ratio on specific regions was not ex-plored. Larger axons (eg, those in corticospinal tracts) are known to have greater g-ratios than smaller axons.18,33
There are various approaches for estimating MVF in the brain. Magnetization transfer imaging is one of these, and quantitative magnetization transfer imaging has shown a strong correlation with quantitative histology.34MR studies evaluating g-ratio have mostly been based on magnetization transfer imaging.12,15,18 However, quantitative magnetization transfer imaging requires approximately 30 minutes for acquisition, and it is still unrealistic
for routine use in a clinical setting. Quantitative magnetization transfer imaging first measures macromolecular pool size, and a coefficient for regressing it to MVF should be determined in each protocol.12The model based on tissue relaxometry used in the current study8directly estimates MVF in a voxel and can be used without determining a coefficient as is done by quantitative mag-netization transfer imaging. Our report is the first to show g-ratios calculated with MVF measured via simultaneous tissue relaxom-etry. Although MVF calculated based on this tissue relaxometry has been validated in cadavers with no known brain diseases,9the methodology has not yet been histologically validated in brains with MS. In plaques, expected histology is heterogeneous, includ-ing myelin debris, poor remyelination, and remyelination with higher quality.35The extent to which MVF is affected by myelin debris may depend on the MR imaging technique used for estimation.13
The myelin model used in our study considers magnetization exchange rates between tissue compartments.8However, it does not explicitly incorporate a partial volume pool to account for magnetization transfer effects, which were shown to create an offset bias for steady-state approaches.36Magnetization transfer effects may result in small changes of our observed Carr-Purcell Meiboom-Gill multiecho signal amplitudes, which will propagate to the R2 estimations. In the model used in our study, however, myelin is estimated from combinations of the measured R1, R2, and PD values, and the effect of a potential offset in R2 is expected to be small. The inclusion of magnetization transfer effects and correction of a potential bias on our myelin water fraction mea-surements may be improvements in future works. Mossahebi et al37recently suggested a method to reduce the partial volume effect by CSF on the estimation of magnetization transfer. CSF partial volume is expected at the brain tissue interface with the surrounding CSF and is accounted for in the model used in our study by the incorporation of the free water partial volume compartment.
In addition to calculating MVF, measures of R1, R2, and PD acquired via simultaneous tissue relaxometry can also be used for synthesizing various contrast-weighted images, including T1-weighted, T2-T1-weighted, FLAIR, double inversion recovery, or phase-sensitive inversion recovery images.7,38-40Thus, the need to obtain these images separately can be eliminated. The clinical usefulness of this specific tissue relaxometry with synthetic MR imaging has been shown in studies of patients with MS.41,42
The current study had some limitations. First, the sample size was small. Second, it did not include healthy controls. Third, only chronic plaques were investigated, and acute plaques may yield different results. Fourth, because the resolution of 2 techniques used for simultaneous tissue relaxometry and NODDI were not matched, there was a possibility of misregistration and partial volume effects.
CONCLUSIONS
measured by methods other than those used in the current study. MVF, AVF, and g-ratio have the potential to be useful for evalu-ating WM damage in patients with MS.
ACKNOWLEDGMENTS
We thank Araya Brain Imaging for technical support with data analysis. We are grateful to Dr. Marcel Warntjes and Dr. Nikola Stikov for providing us with the idea support and thoughtful comments on our manuscript.
Disclosures: Akifumi Hagiwara—RELATED:Grants/Grants Pending: JSPS KAKENHI, Advanced Bioimaging Support, Japan Radiological Society and Bayer Yakuhin, Im-PACT Program, AMED,Comments: this work was supported by JSPS KAKENHI Grant Number 16K19852; grant number JP16H06280, Grant-in-Aid for Scientific Research on Innovative Areas - Resource and technical support platforms for promoting research “Advanced Bioimaging Support”; the Japan Radiological Society and Bayer Yakuhin (KJ-08); the Impulsing Paradigm Change through disruptive Technologies (ImPACT) Program of the Council for Science, Technology and Innovation (Cabinet Office, Government of Japan); and the program for Brain Mapping by Integrated Neurotech-nologies for Disease Studies (Brain/MINDS) from the Japan Agency for Medical Re-search and development, AMED. Kazumasa Yokoyama—UNRELATED:Other: be-longing to the department funded by Mitsubishi Tanabe Pharma, Hydrogen Health Medical Labo, ABIST, Melodian, Kenkoukazoku, Yamato, Biogen Idec Japan, Bayer, Nihon Pharmaceutical, Asahi Kasei Medical, Japan Blood Products Organization, MiZ, Ono Pharmaceutical.* Shigeki Aoki—RELATED:Grant: Brain/MINDS, ABiS*;
UNRELATED:Board Membership: Bayer;Consulting Fee or Honorarium: SyMRI meeting chair;Grants/Grants Pending: Bayer, Daiichi-Sankyo, Eisai, Fuji-yakuhin, Fuji Film RI, Mediphysics, Toshiba,Comments: grant for diagnostic radiology*;Payment for Lectures (including service on Speakers Bureaus): GE, Toshiba, Hitachi, Siemens, Bayer, Daiichisankyo, Eisai, Fuji-yakuhin, Fuji Film RI, Mediphysics, Novartis, Takeda, Biojen,Comments: honorarium for lectures/chair. *Money paid to the institution.
REFERENCES
1. Polman CH, Reingold SC, Banwell B, et al.Diagnostic criteria for multiple sclerosis: 2010 revisions to the McDonald criteria.Ann Neurol2011;69:292–302CrossRef Medline
2. Filippi M, Rocca MA, De Stefano N, et al.Magnetic resonance tech-niques in multiple sclerosis: the present and the future.Arch Neurol
2011;68:1514 –20CrossRef Medline
3. Yoshida M, Hori M, Yokoyama K, et al.Diffusional kurtosis im-aging of normal-appearing white matter in multiple sclerosis: preliminary clinical experience. Jpn J Radiol 2013;31:50 –55
CrossRef Medline
4. Guo AC, MacFall JR, Provenzale JM.Multiple sclerosis: diffusion tensor MR imaging for evaluation of normal-appearing white mat-ter.Radiology2002;222:729 –36CrossRef Medline
5. Hori M, Yoshida M, Yokoyama K, et al.Multiple sclerosis: bene-fits of q-space imaging in evaluation of normal-appearing and periplaque white matter. Magn Reson Imaging2014;32:625–29
CrossRef Medline
6. Warntjes JB, Leinhard OD, West J, et al.Rapid magnetic resonance quantification on the brain: optimization for clinical usage.Magn Reson Med2008;60:320 –29CrossRef Medline
7. Hagiwara A, Warntjes M, Hori M, et al.SyMRI of the brain: rapid quantification of relaxation rates and proton density, with syn-thetic MRI, automatic brain segmentation, and myelin measure-ment.Invest Radiol2017 Mar 3. [Epub ahead of print]CrossRef Medline
8. Warntjes M, Engstro¨m M, Tisell A, et al.Modeling the presence of myelin and edema in the brain based on multi-parametric quanti-tative MRI.Front Neurol2016;7:16CrossRef Medline
9. Warntjes JBM, Persson A, Berge J, et al.Myelin detection using rapid quantitative MR imaging correlated to macroscopically registered luxol fast blue–stained brain specimens.AJNR Am J Neuroradiol
2017;38:1096 –1102CrossRef Medline
10. Hagiwara A, Hori M, Yokoyama K, et al.Utility of a multiparametric quantitative MRI model that assesses myelin and edema for evalu-ating plaques, periplaque white matter, and normal-appearing
white matter in patients with multiple sclerosis: a feasibility study.
AJNR Am J Neuroradiol2017;38:237– 42CrossRef Medline
11. Zhang H, Schneider T, Wheeler-Kingshott CA, et al.NODDI: prac-tical in vivo neurite orientation dispersion and density imaging of the human brain.Neuroimage2012;61:1000 –16CrossRef Medline
12. Stikov N, Campbell JS, Stroh T, et al.In vivo histology of the myelin g-ratio with magnetic resonance imaging.Neuroimage2015;118: 397– 405CrossRef Medline
13. Campbell JS, Leppert IR, Narayanan S, et al.Promise and pitfalls of g-ratio estimation with MRI.arXiv:1701.02760v1 [physics.med-ph]. Janu-ary 10, 2017. https://arxiv.org/abs/1701.02760v1. Accessed July 2, 2017 14. Rushton WA.A theory of the effects of fibre size in medullated
nerve.J Physiol1951;115:101–22CrossRef Medline
15. Cercignani M, Giulietti G, Dowell NG, et al.Characterizing axonal myelination within the healthy population: a tract-by-tract map-ping of effects of age and gender on the fiber g-ratio.Neurobiol Aging
2017;49:109 –18CrossRef Medline
16. Dean DC 3rd, O’Muircheartaigh J, Dirks H, et al.Mapping an index of the myelin g-ratio in infants using magnetic resonance imaging.
Neuroimage2016;132:225–37CrossRef Medline
17. Melbourne A, Eaton-Rosen Z, Orasanu E, et al.Longitudinal devel-opment in the preterm thalamus and posterior white matter: MRI correlations between diffusion weighted imaging and T2 relaxom-etry.Hum Brain Mapp2016;37:2479 –92CrossRef Medline
18. Mohammadi S, Carey D, Dick F, et al.Whole-brain in-vivo measure-ments of the axonal g-ratio in a group of 37 healthy volunteers.
Front Neurosci2015;9:441Medline
19. Albert M, Antel J, Bru¨ck W, et al.Extensive cortical remyelination in patients with chronic multiple sclerosis. Brain Pathol 2007;17: 129 –38CrossRef Medline
20. McDonald WI, Compston A, Edan G, et al.Recommended diagnos-tic criteria for multiple sclerosis: guidelines from the International Panel on the diagnosis of multiple sclerosis.Ann Neurol2001;50: 121–27CrossRef Medline
21. Polman CH, Reingold SC, Edan G, et al.Diagnostic criteria for mul-tiple sclerosis: 2005 revisions to the “McDonald Criteria.”Ann Neu-rol2005;58:840 – 46CrossRef Medline
22. Kurtzke JF.A new scale for evaluating disability in multiple sclero-sis.Neurology1955;5:580 – 83CrossRef Medline
23. Mohammadi S, Mo¨ller HE, Kugel H, et al.Correcting eddy current and motion effects by affine whole-brain registrations: evaluation of three-dimensional distortions and comparison with slicewise correction.Magn Reson Med2010;64:1047–56CrossRef Medline
24. Becker SM, Tabelow K, Voss HU, et al.Position-orientation adap-tive smoothing of diffusion weighted magnetic resonance data (POAS).Med Image Anal2012;16:1142–55CrossRef Medline
25. Becker SM, Tabelow K, Mohammadi S, et al.Adaptive smoothing of multi-shell diffusion weighted magnetic resonance data by msPOAS.Neuroimage2014;95:90 –105CrossRef Medline
26. Daducci A, Canales-Rodríguez EJ, Zhang H, et al.Accelerated micro-structure imaging via convex optimization (AMICO) from diffu-sion MRI data.Neuroimage2015;105:32– 44CrossRef Medline
27. Levesque IR, Pike GB.Characterizing healthy and diseased white matter using quantitative magnetization transfer and multicompo-nent T(2) relaxometry: a unified view via a four-pool model.Magn Reson Med2009;62:1487–96CrossRef Medline
28. Lucchinetti CF, Bru¨ck W, Rodriguez M, et al.Distinct patterns of multiple sclerosis pathology indicates heterogeneity on pathogen-esis.Brain Pathol1996;6:259 –74CrossRef Medline
29. Dziedzic T, Metz I, Dallenga T, et al.Wallerian degeneration: a ma-jor component of early axonal pathology in multiple sclerosis.
Brain Pathol2010;20:976 – 85Medline
30. Simons M, Misgeld T, Kerschensteiner M.A unified cell biological perspective on axon-myelin injury. J Cell Biol2014;206:335– 45
CrossRef Medline
31. Haines JD, Inglese M, Casaccia P.Axonal damage in multiple scle-rosis.Mt Sinai J Med2011;78:231– 43CrossRef Medline
with spinal cord axonal loss and reduced N-acetyl aspartate in chronic multiple sclerosis patients.Ann Neurol2000;48:893–901Medline
33. Graf von Keyserlingk D, Schramm U.Diameter of axons and thick-ness of myelin sheaths of the pyramidal tract fibres in the adult human medullary pyramid.Anat Anz1984;157:97–111Medline
34. West KL, Kelm ND, Carson RP, et al.Myelin volume fraction imag-ing with MRI.Neuroimage2016 Dec 23. [Epub ahead of print]
CrossRef Medline
35. Lampron A, Larochelle A, Laflamme N, et al.Inefficient clearance of myelin debris by microglia impairs remyelinating processes.J Exp Med2015;212:481–95CrossRef Medline
36. Liu F, Block WF, Kijowski R, et al.Rapid multicomponent relaxom-etry in steady state with correction of magnetization transfer ef-fects.Magn Reson Med2016;75:1423–33CrossRef Medline
37. Mossahebi P, Alexander AL, Field AS, et al.Removal of cerebrospinal fluid partial volume effects in quantitative magnetization transfer imaging using a three-pool model with nonexchanging water com-ponent.Magn Reson Med2015;74:1317–26CrossRef Medline
38. Hagiwara A, Nakazawa M, Andica C, et al.Dural enhancement in a patient with Sturge-Weber syndrome revealed by double inversion recovery contrast using synthetic MRI.Magn Reson Med Sci2016; 15:151–52CrossRef Medline
39. Hagiwara A, Hori M, Suzuki M, et al.Contrast-enhanced synthetic MRI for the detection of brain metastases.Acta Radiol Open2016;5: 2058460115626757CrossRef Medline
40. Andica C, Hagiwara A, Nakazawa M, et al.The advantage of syn-thetic MRI for the visualization of early white matter change in an infant with Sturge-Weber syndrome.Magn Reson Med Sci2016;15: 347– 48CrossRef Medline
41. Granberg T, Uppman M, Hashim F, et al.Clinical feasibility of syn-thetic MRI in multiple sclerosis: a diagnostic and volumetric vali-dation study. AJNR Am J Neuroradiol2016;37:1023–29CrossRef Medline