ORIGINAL RESEARCH
PEDIATRICS
Gray Matter Growth Is Accompanied by Increasing Blood Flow
and Decreasing Apparent Diffusion Coefficient
during Childhood
XN.D. Forkert, XM.D. Li, X R.M. Lober, and XK.W. Yeom
ABSTRACT
BACKGROUND AND PURPOSE: Normal values of gray matter volume, cerebral blood flow, and water diffusion have not been established for healthy children. We sought to determine reference values for age-dependent changes of these parameters in healthy children.
MATERIALS AND METHODS: We retrospectively reviewed MR imaging data from 100 healthy children. Using an atlas-based approach, age-related normal values for regional CBF, apparent diffusion coefficient, and volume were determined for the cerebral cortex, hip-pocampus, thalamus, caudate, putamen, globus pallidus, amygdala, and nucleus accumbens.
RESULTS:All gray matter structures grew rapidly before the age of 10 years and then plateaued or slightly declined thereafter. The ADC of all structures decreased with age, with the most rapid changes occurring prior to the age of 5 years. With the exception of the globus pallidus, CBF increased rather linearly with age.
CONCLUSIONS: Normal brain gray matter is characterized by rapid early volume growth and increasing CBF with concomitantly decreas-ing ADC. The extracted reference data that combine CBF and ADC parameters durdecreas-ing brain growth may provide a useful resource when assessing pathologic changes in children.
ABBREVIATION:ASL⫽arterial spin-labeling
A
t birth, brain volume is approximately one-third that of a healthy adult brain and undergoes rapid growth during the first 3 months.1By the age of 1 year, brain volume has already doubled in size.2Initially, most hemispheric growth relates to an increase in gray matter volume,3thought to reflect synapse for-mation occurring earliest in the primary motor and sensory cor-tices and later in the prefrontal cortex,4directing a posterior-to-anterior pattern of hemispheric white matter maturation.5After the first few years, white matter volume increases at a higher rate during the rest of the childhood,6while synaptic pruning occurs concurrently in the gray matter.4Compared with macrostructural analysis using image-based volume extraction, diffusion-weighted MR imaging can be used to probe microstructural changes, including myelination pat-terns7,8and white matter connectivity,9and has also shown utility for brain tumor characterization10and metabolic diseases.11 Var-ious studies have examined apparent diffusion coefficient changes of white matter in children.12-14However, at present, the ADC of the gray matter, notably at the cortical level, is not well-documented.
While volumetric and diffusion analysis can be used to probe macro- and microstructural changes, respectively, arterial spin-labeling (ASL) cerebral blood flow is increasingly used clinically to obtain advanced physiologic information.15-18ASL may be par-ticularly useful in the pediatric population because it does not require intravenous contrast or ionizing radiation. However, only a few studies have examined ASL CBF changes in children.19,20
These few studies have included ASL CBF of unsedated healthy term and preterm neonates21or infants 3–5 months of age.22 Apart from these 2 studies, normal values have also been assessed as part of studies investigating CBF changes across the whole life span with only limited data from children20or for feasibility anal-ysis of ASL imaging, also using only a limited number of healthy children.19
Received December 10, 2015; accepted after revision February 8, 2016. From the Department of Radiology and Hotchkiss Brain Institute (N.D.F.), Univer-sity of Calgary, Calgary, Alberta, Canada; Department of Radiology (M.D.L., K.W.Y.), Lucile Packard Children’s Hospital, Stanford University, Palo Alto, California; and Department of Neurosurgery (R.M.L.), Dayton Children’s Hospital, Boonshoft School of Medicine, Dayton, Ohio.
This work was supported by a Brain and Behavior Center Award in Pediatric Neu-rosciences at Stanford Lucile Packard Children’s Hospital.
Please address correspondence to Nils Daniel Forkert, PhD, Department of Radiol-ogy and Hotchkiss Brain Institute, University of Calgary, HSC Building, Rm 2913, 3330 Hospital Drive NW, Calgary, Alberta T2N 4N1, Canada; e-mail:
Indicates article with supplemental on-line photo.
At present, no study has examined the CBF of a healthy pedi-atric cohort across the age spectrum. Therefore, the goal of this study was to extract and establish age-related CBF values in gray matter along with corresponding volume and diffusion metrics.
MATERIALS AND METHODS
Study CohortAll children presenting for evaluation by a 3T MR imaging system at our children’s hospital from May 2010 to October 2013 were retrospectively reviewed after approval by the Stanford University institutional review board (protocol 28674). The study cohort included patients 4 months to 18 years of age with no known neurologic, neurocognitive, or developmental deficits, who had a normal appearing brain MRI protocol that included ASL and DWI datasets. All MR imaging brain studies with normal findings were additionally reviewed and confirmed by at least 1 pediatric neuroradiologist with a Certificate of Added Qualification (K.W.Y. or P. Barnes both with⬎7 years of dedicated experience). Patients who had brain MR imaging with any focal intensity on FLAIR or other sequences, cysts, wide Sylvian fissures, or other nonspecific structural appearances were excluded. Patients with dental braces/metal artifacts and motion-degraded or non-diag-nostic-quality imaging were also excluded.
A thorough chart review was performed (M.D.L.) to identify any disease history. Examples of clinical reasons for obtaining MR imaging included syncope, nausea, family history of aneurysm or cancers, scalp nevus, isolated facial lesions (eg, orbital or glabellar dermoid) without associated syndromes or intracranial exten-sion, orbital strabismus, cholesteatoma of the ear, isolated head-aches, sinus disease or inflammatory nasal obstruction, and short stature that was considered familial without intracranial or endo-crine abnormality.
Patients with any systemic or non-central nervous system dis-eases (eg, disdis-eases of the renal, gastrointestinal, cardiac systems), cancers, history of prematurity, phacomatoses, genetic or syn-dromic conditions, epilepsy, migraines, hearing loss, hemor-rhage, vascular lesions (aneurysm, AVM, fistula, or steno-occlu-sive disease of the CNS or elsewhere), acute or recent infection and fever of unknown origin, prior radiation or chronic medical therapy, or endocrine symptoms/laboratory abnormalities were excluded. Patients were also screened for all psychiatric and ab-normal behavioral conditions (attention deficit/hyperactivity dis-order, autism, psychosis) and were excluded if present.
Finally, subjects with insufficient data or registration results (see below) were also excluded from the final analysis.
Imaging Methods
All subjects had brain MR imaging obtained at 3T (Discovery 750; GE Healthcare, Milwaukee, Wisconsin) using an 8-channel head coil. Pseudocontinuous ASL MR imaging was performed using the technique described by Dai et al.23Briefly, this vendor-sup-plied ASL was performed using a pseudocontinuous labeling pe-riod of 1500 ms, followed by a 1500-ms postlabel delay. Whole-brain images were acquired with a 3D background-suppressed fast spin-echo stack-of-spirals method. Multiarm spiral imaging was used, with 8 arms and 512 points acquired on each arm (bandwidth⫽62.5 kHz), yielding a 3-mm2in-plane spatial
reso-lution and a 4-mm section thickness. A high level of background suppression was achieved using 4 separate inversion pulses spaced around the pseudocontinuous labeling pulse. The acquisition time for this sequence is approximately 5 minutes, which also includes proton-density images required for CBF quantification. For a graphic setup of the ASL, the sagittal image following the 3-plane localizer was used for alignment. Postprocessing was per-formed using an automated reconstruction procedure using the microsphere methodology described by Buxton et al.24 Other pseudocontinuous ASL MR imaging parameters were TR⫽4632 ms, TE⫽10.5 ms, FOV⫽24 cm, and NEX⫽3.
Additionally, echo-planar DWI was performed using TR⫽ 1500 ms, TE⫽37 ms, flip angle⫽90°, acceleration factor⫽2, in-plane resolution⫽0.94 mm2, acquisition matrix⫽128⫻128
interpolated to a 256⫻256 matrix, 44 sections with 4-mm section thickness, no skip, FOV⫽24 cm, 2 diffusion-weightings ofb⫽0 s/mm2andb⫽1000 s/mm2, with diffusion gradients acquired in 3
directions averaged for the latter.
Image Processing
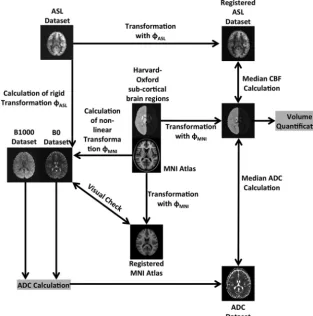
The image-processing pipeline used for extraction of quantitative values of regional brain volume, ADC, and CBF is illustrated in
Fig 1. The complete image-processing pipeline used was cus-tom-developed and implemented in C⫹⫹ using the Insight Segmentation and Registration Toolkit (ITK, http://www.itk. org/). In the first step of this pipeline, the ASL CBF andb⫽1000 s/mm2 DWI dataset were registered to the corresponding
T2-weighted DWI dataset (b⫽0 s/mm2) using rigid transformations,
linear interpolation, and maximization of the mutual informa-tion.25The registered DWI datasets were then used to calculate the corresponding ADC map for each subject using the Stejskal-Tanner equation.26
Finally, the Montreal Neurological Institute-152 brain atlas27 was registered to eachb⫽0 s/mm2DWI dataset using a
concat-enated affine and nonlinear spline transformation. The affine transformation was determined using a linear interpolation and maximization of the mutual information metric. The calculated affine transformation was used to prealign the atlas to the patient anatomy in terms of initialization of a b-spline transformation, which was used for the fine nonlinear alignment of the Montreal Neurological Institute atlas to theb⫽0 s/mm2DWI dataset. This
b-spline transformation was optimized using linear interpolation and maximization of the mutual information metric.
All registrations were performed within a multiresolution reg-istration framework with 3 levels, while the calculation of the mutual information similarity metric was restricted in all cases to the brain mask of theb⫽0 s/mm2DWI dataset, which was
gener-ated using the method described by Forkert et al.28Two experi-enced observers (N.D.F., K.W.Y.) checked all registration results to ensure suitable data and registration quality.
For quantitative assessment of volume, ADC, and CBF of the different gray matter brain regions, the resulting nonlinear spatial deformation field for alignment of the Montreal Neurological In-stitute atlas to each subject was used to warp the Harvard-Oxford subcortical brain regions, as defined in the Montreal Neurological Institute atlas space, to eachb⫽0 s/mm2DWI dataset by applying
After registration of all datasets, volume, median ADC, and median CBF values were determined for each subject within the following 8 gray matter brain structures: cerebral cortex, hippocampus, thalamus, caudate, putamen, globus pallidus, amygdala, and nucleus accumbens.
Statistical Analysis
The volume for each structure was averaged between the 2 corre-sponding structures in the left and right hemispheres, while the median ADC and median CBF values were determined for each region combined for the left and right hemispheres.
The quantile local piecewise regression analysis described by Sakov et al29was used in this work to determine the age-related 5th, 10th, 25th, 50th, 75th, 90th, and 95th quantile curves indi-vidually for each brain structure and for the 3 parameters: vol-ume, ADC, and CBF. The parameters for the local piecewise
re-gression analysis were kept identical for all plots generated. More specifically, a window size of 30 points, 95% overlap between the windows, Gaussian smoothing, and a polynomial degree of 2 were used.
Each scatterplot and corresponding regression curves were inspected for qualitative description of the age-related changes.
In our study, intravenous propofol sedation was performed for all children 3 months to 6 years of age. After 10 years of age, no patients received sedation. Be-tween 6 and 9 years of age, there were variable rates of sedation. In this age group, comparison of sedated and nonsedated groups was conducted using the Welch 2-tailedttest to test for signif-icant differences between children with and without sedation.
All statistics were calculated using the R statistical software package of The R Foundation of Statistical Computing (Version 3.2.2; www.r-project.org).
RESULTS
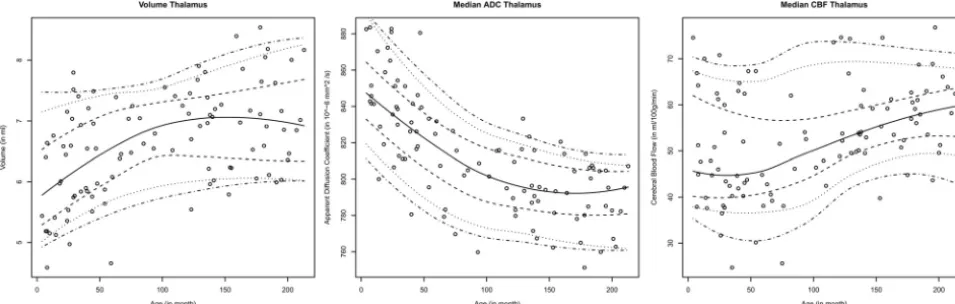
One hundred healthy subjects (age range, 4 month to 18 years; 39 males) met the inclusion criteria and were included in the study. The specific number of children in each age group is summarized in theTable. Overall, all structures analyzed exhibited similar pat-terns of the age-dependent distribution of regional brain volume, ADC, and CBF values with different levels.Figure 2exemplarily displays the age-dependent distribution of regional brain volume, ADC, and CBF values in the thalamus. The corresponding graphs for all gray matter structures analyzed in this work can be found in On-line Fig 1.
Gray Matter Volume
In general, the volume increased with age in all gray matter structures. The volumetric increase with age was nonlinear and was highest from birth to approximately 8 –10 years of age. Thereafter, volumes reached a stable plateau or displayed a slight decrease.
ADC of the Gray Matter
Median ADC values of the gray matter declined with increasing age. The highest median ADC values occurred in the first 5 years of childhood. During this period, an exponential decay of ADC values was observed in all gray matter structures. After 5 years of age, ADC continued to decrease in a rather linear fashion with increasing age. Overall, median ADC values in the cerebral cortex and hippocampus were about 10% higher than in the other gray matter regions investigated. This finding was consistent across all age groups.
FIG 1. Illustration of the image-processing pipeline used for determination of the age-dependent volumetric, ADC, and CBF normal values.
Age distribution of neurologically healthy patients
Age Range (yr) No. of Children
0–2 14
2–4 22
4–6 8
6–8 7
8–10 4
10–12 16
12–14 7
14–16 13
16–18 9
[image:3.594.55.369.49.365.2]CBF of the Gray Matter
Cerebral blood flow was more variable than volume and ADC, particularly in the first 5 years of childhood. Unlike the rapid volume and ADC changes in the first 5 years of life, CBF increased rather linearly with age, with decreased variability at older ages. CBF in all gray matter structures increased with age, except for the globus pallidus, which was stable throughout childhood. The de-gree of CBF increase did not differ considerably among the cau-date, thalamus, putamen, nucleus accumbens, and amygdala, but a smaller degree of CBF increase was found for the hippocampus, and a larger CBF increase, for the cerebral cortex with age.
Sedated versus Nonsedated Children
The comparison of sedated (n⫽7; mean age, 7.6 years) and nonsedated children (n⫽ 4; mean age, 7.9 years) revealed no significant CBF differences in any brain region studied (Welch 2-tailedttest,P⬎.01; Bonferroni-adjusted significance level⫽ .005).
DISCUSSION
Gray matter CBF increased with age, except in the globus pallidus. Notably, the cerebral cortex, amygdala, and nucleus accumbens showed the highest CBF increase. These CBF changes were ac-companied by a progressive ADC decrease and volumetric in-crease for all gray matter structures, with ADC stabilizing at about 10 –12 years and peak volume occurring at around 8 –12 years, with a slight decrease thereafter. To our knowledge, this is the first study to investigate age-related changes of gray matter CBF ac-companied by corresponding volume and ADC values in a single cohort of neurologically healthy children throughout childhood and adolescence.
Our volumetric results are consistent with prior studies of healthy subjects that showed an overall increase in cortical gray matter volume in the preadolescent years and a decline in the postadolescent period.30 Volumetric analysis for infancy and early childhood remains sparse, but our results are also consistent with the growth pattern described in a study of 28 children 1 month to 10 years of age, in whom a rapid growth pattern was followed by a more gradual increase.31A more recent study that focused on infants (3–13 months of age) also observed an increas-ing volume of all gray matter regions with some regionally differ-ent growth patterns.32
While volume increased, the ADC of the gray matter declined rapidly, with a fast exponential component in the first few years, which then stabilized in early adolescence. These findings likely reflect the combined effects of neuronal development, myelina-tion, and decrease in water content33and associated MR imaging signal changes34,35that rapidly occur in the early years of devel-opment. Potential contributions of iron-deposition that decrease T2 relaxation time may also be considered, particularly in the deep gray nuclei, which has been observed in children older than 4 years of age and in adolescents.36
Although various studies have reported ADC changes of cere-bral white matter in children,12-14gray matter structures have remained relatively unexplored. We observed a steep decline with an exponential component in early childhood with a decreasing trend continuing into later childhood, consistent with results of prior ROI-based studies in selected deep gray regions (caudate, putamen, globus pallidus).37,38
Compared with volume and ADC changes, a wider variation in CBF values was seen across age. In addition, median CBF values and the magnitude of increase varied among the gray matter re-gions. Previous studies have described a close relationship be-tween CBF and the cerebral metabolic rate39-41; and in a study of cerebral metabolism in 29 children (5 days to 15 years of age) using18F-FDG positron-emission tomography, a similar pattern
of highest proportional increase in metabolic activity was seen in the cerebral cortex compared with the other brain regions.42
[image:4.594.55.533.48.200.2]which has been shown to have a superior labeling efficiency,23 signal-to-noise ratio, and reproducibility,45and is thus preferred over other ASL methods. We also used a postlabel delay of 1500 ms recommended by the current guidelines of the International Society for Magnetic Resonance in Medicine for clinical imaging of the pediatric brain.46
Biagi et al20also observed increased gray matter CBF in pedi-atric patients receiving halogenated anesthesia relative to awake patients, which was rather similar to those receiving only intrave-nous propofol. A review of adult functional imaging studies noted that propofol was associated with decreased CBF, determined by PET, in all brain regions in multiple studies.47Thus, a dispropor-tionate number of younger children requiring halogenated anes-thesia could have affected their results. For example, an ASL study in 4 patients with Moyamoya disease found that halogenated an-esthesia (sevoflurane) was associated with consistently higher global gray matter CBF.48In our study, intravenous propofol se-dation, with or without mask induction using a halogenated an-esthetic, was performed for all children 3 months to 6 years of age. Between 6 and 9 years of age, there were variable rates of sedation. The statistical analysis of children with and without sedation in this age range showed no significant differences. This could pos-sibly be explained by a balancing effect of increased CBF with halogenated anesthesia and decreased CBF with propofol.20Thus, no correction was necessary in this study.
Brain development has been shown to be associated with re-gional changes in the glucose cerebral metabolic rate42and CBF.49 Thus, continued increases in ASL CBF during childhood and ad-olescence may reflect a more protracted period of functional de-velopment and maturation. While global cerebral volume has been shown to peak at 14.5 years for boys and 11.5 years for girls, changes in cortical gray matter volume are more complex and have shown regional heterochronicity.50For example, in a study of 145 subjects 4 –21 years of age, the frontal and parietal lobes showed an earlier peak at 11–12 years of age, while maximal tem-poral gray matter volumes occurred at 16 –17 years of age, and the occipital lobes had a linear increase through 20 years of age with-out signs of decline.30Previous studies have also reported periods of postnatal rapid brain growth up to 20 years of age based on electroencephalography energy metrics in the␣frequencies.51,52 A spike in CBF was observed preceding these stages of brain growth, suggesting a higher energy requirement during these pe-riods,53 a pattern also seen in the rat cerebral cortex that has shown increased vascular sprouting shortly before rapid growth stages.54
Individual differences in brain growth spurts may also explain variations of CBF observed in the present study to some degree. While the definitive reasons for relatively stable CBF in the globus pallidus and a slower rate of CBF increase in the hippocampus compared with the other brain regions analyzed remain un-known, it is possible that these regions demonstrate different rates of growth or metabolism. For example, a morphometric analysis of infants 3–13 months of age showed a slower growth rate in certain brain regions, such as the globus pallidus and hippocam-pus, relative to the whole brain, despite an overall increase in volume in absolute values.32
We recognize certain limitations of this study. For example,
for our analysis, the adult Montreal Neurological Institute atlas was registered to the pediatric brain. While registration of a pedi-atric atlas might be more accurate for this purpose, different brain atlases generated by using different age ranges and subjects (eg, described by Fonov et al55) would be necessary, potentially mak-ing the results not directly comparable. Therefore, we decided to use the well-established Montreal Neurological Institute adult brain atlas with the available Harvard-Oxford atlas brain regions for this purpose so that the same reference was used for each subject to analyze CBF, ADC, and volume data metrics. To min-imize any effects of suboptimal registration results, we performed further quality control, including visual inspection by our team members with knowledge of brain imaging and anatomy. Within this context, 22 subjects not part of the 100 subjects described in this study were excluded from the final analysis due to insufficient registration of the Montreal Neurological Institute brain atlas.
In addition, theb⫽0 s/mm2DWI datasets were used as a
ref-erence for atlas registration. These datasets do not offer the same high spatial resolution compared with T1-weighted datasets usu-ally used for this purpose, which limits the precision of the ex-tracted regional brain volumes, especially for small structures such as the amygdala.
However, although our goal was to demonstrate CBF changes against volume and ADC across various age groups for various brain regions rather than to define precise metrics for volume, the growth patterns found are well in line with previous findings, suggesting reasonable registration results.
Finally, the regional brain volumes were averaged between corresponding left and right hemispheric structures, while me-dian ADC and CBF values were calculated for each combined corresponding left and right hemisphere brain structure. This procedure was selected to decrease the influence of noise in the data, especially for the small structures such as the amygdala and nucleus accumbens. When analyzed separately, no significant dif-ference between the age-related trends of corresponding left and right brain structures was found for the regional brain volume, ADC, and CBF metrics.
CONCLUSIONS
Normal gray matter is characterized by rapid early volume growth and increasing CBF, with concomitantly decreasing ADC. The extracted reference data that combine CBF and ADC parameters during brain growth may provide a useful resource when assess-ing pathologic changes in children.
ACKNOWLEDGMENTS
The authors would like to thank Patrick Barnes, Department of Pediatric Neuroradiology, Stanford University, for his support in reviewing the MR imaging brain studies used in this work.
REFERENCES
1. Holland D, Chang L, Ernst TM, et al.Structural growth trajectories and rates of change in the first 3 months of infant brain develop-ment.JAMA Neurol2014;71:1266 –74CrossRef Medline
2. Gilmore JH, Lin W, Prastawa MW, et al.Regional gray matter growth, sexual dimorphism, and cerebral asymmetry in the neona-tal brain.J Neurosci2007;27:1255– 60CrossRef Medline
human brain development from birth to 2 years.J Neurosci2008;28: 12176 – 82CrossRef Medline
4. Huttenlocher PR, Dabholkar AS.Regional differences in synapto-genesis in human cerebral cortex.J Comp Neurol1997;387:167–78
Medline
5. Sampaio CS, Truwit CL.Myelination in the developing brain.In: Nelson CA, Luciana M, eds.Handbook of Developmental Cognitive Neuroscience.Cambridge, Massachusetts: MIT Press; 2001:35– 44 6. Dubois J, Dehaene-Lambertz G, Kulikova S, et al.The early
develop-ment of brain white matter: a review of imaging studies in fetuses, newborns and infants. Neuroscience 2014;276:48 –71 CrossRef Medline
7. Loh KB, Ramli N, Tan LK, et al.Quantification of diffusion tensor imaging in normal white matter maturation of early childhood us-ing an automated processus-ing pipeline.Eur Radiol2012;22:1413–26
CrossRef Medline
8. Uda S, Matsui M, Tanaka C, et al.Normal development of human brain white matter from infancy to early adulthood: a diffusion tensor imaging study. Dev Neurosci 2015;37:182–94 CrossRef Medline
9. Alcauter S, Lin W, Smith JK, et al.Development of thalamocortical connectivity during infancy and its cognitive correlations.J Neuro-sci2014;34:9067–75CrossRef Medline
10. Lo¨bel U, Sedlacik J, Reddick WE, et al.Quantitative diffusion-weighted and dynamic susceptibility-diffusion-weighted contrast-enhanced perfusion MR imaging analysis of T2 hypointense lesion compo-nents in pediatric diffuse intrinsic pontine glioma.AJNR Am J Neu-roradiol2011;32:315–22CrossRef Medline
11. Dyke JP, Voss HU, Sondhi D, et al.Assessing disease severity in late infantile neuronal ceroid lipofuscinosis using quantitative MR dif-fusion-weighted imaging.AJNR Am J Neuroradiol2007;28:1232–36
CrossRef Medline
12. Lo¨bel U, Sedlacik J, Gu¨llmar D, et al.Diffusion tensor imaging: the normal evolution of ADC, RA, FA, and eigenvalues studied in mul-tiple anatomical regions of the brain. Neuroradiology 2009;51: 253– 63CrossRef Medline
13. Engelbrecht V, Scherer A, Rassek M, et al.Diffusion-weighted MR imaging in the brain in children: findings in the normal brain and in the brain with white matter diseases.Radiology2002;222:410 –18
CrossRef Medline
14. Rollins NK, Glasier P, Seo Y, et al.Age-related variations in white matter anisotropy in school-age children.Pediatr Radiol2010;40: 1918 –30CrossRef Medline
15. Chen J, Licht DJ, Smith SE, et al.Arterial spin labeling perfusion MRI in pediatric arterial ischemic stroke: initial experiences.J Magn Reson Imaging2009;29:282–90CrossRef Medline
16. Yeom KW, Lober RM, Alexander A, et al.Hydrocephalus decreases arterial spin-labeled cerebral perfusion.AJNR Am J Neuroradiol
2014;35:1433–39CrossRef Medline
17. Yeom KW, Lober RM, Barnes PD, et al.Reduced cerebral arterial spin-labeled perfusion in children with neurofibromatosis type 1.
AJNR Am J Neuroradiol2013;34:1823–28CrossRef Medline
18. Yeom KW, Mitchell LA, Lober RM, et al.Arterial spin-labeled per-fusion of pediatric brain tumors.AJNR Am J Neuroradiol2014;35: 395– 401CrossRef Medline
19. Wang J, Licht DJ, Jahng GH, et al.Pediatric perfusion imaging using pulsed arterial spin labeling.J Magn Reson Imaging2003;18:404 –13
CrossRef Medline
20. Biagi L, Abbruzzese A, Bianchi MC, et al.Age dependence of cerebral perfusion assessed by magnetic resonance continuous arterial spin labeling.J Magn Reson Imaging2007;25:696 –702CrossRef Medline
21. Miranda MJ, Olofsson K, Sidaros K.Noninvasive measurements of regional cerebral perfusion in preterm and term neonates by mag-netic resonance arterial spin labeling.Pediatr Res2006;60:359 – 63
CrossRef Medline
22. Duncan AF, Caprihan A, Montague EQ, et al.Regional cerebral blood flow in children from 3 to 5 months of age.AJNR Am J Neu-roradiol2014;35:593–98CrossRef Medline
23. Dai W, Garcia D, de Bazelaire C, et al.Continuous flow-driven in-version for arterial spin labeling using pulsed radio frequency and gradient fields.Magn Reson Med2008;60:1488 –97CrossRef Medline
24. Buxton RB, Frank LR, Wong EC, et al.A general kinetic model for quantitative perfusion imaging with arterial spin labeling.Magn Reson Med1998;40:383–96CrossRef Medline
25. Wells WM 3rd, Viola P, Atsumi H, et al.Multi-modal volume regis-tration by maximization of mutual information.Med Image Anal
1996;1:35–51CrossRef Medline
26. Stejskal EO, Tanner JE.Spin diffusion measurements: spin echoes in the presence of a time-dependent field gradient.J Chem Phys1965; 42:288 –92CrossRef
27. Mazziotta JC, Toga AW, Evans A, et al.A probabilistic atlas of the human brain: theory and rationale for its development—the Inter-national Consortium for Brain Mapping (ICBM).Neuroimage1995; 2:89 –101CrossRef Medline
28. Forkert ND, Cheng B, Kemmling A, et al.ANTONIA perfusion and stroke: a software tool for the multi-purpose analysis of MR perfu-sion-weighted datasets and quantitative ischemic stroke assess-ment.Methods Inf Med2014;53:469 – 81CrossRef Medline
29. Sakov A, Golani I, Lipkind D, et al.High-throughput data analysis in behavior genetics.Ann Appl Stat2010;4:743– 63CrossRef
30. Giedd JN, Blumenthal J, Jeffries NO, et al.Brain development during childhood and adolescence: a longitudinal MRI study.Nat Neurosci
1999;2:861– 63CrossRef Medline
31. Matsuzawa J, Matsui M, Konishi T, et al.Age-related volumetric changes of brain gray and white matter in healthy infants and chil-dren.Cereb Cortex2001;11:335– 42CrossRef Medline
32. Choe MS, Ortiz-Mantilla S, Makris N, et al.Regional infant brain development: an MRI-based morphometric analysis in 3 to 13 month olds.Cereb Cortex2013;23:2100 –17CrossRef Medline
33. Dobbing J, Sands J.Quantitative growth and development of hu-man brain.Arch Dis Child1973;48:757– 67CrossRef Medline
34. Barkovich AJ, Kjos BO, Jackson DE J., et al.Normal maturation of the neonatal and infant brain: MR imaging at 1.5 T.Radiology1988; 166:173– 80CrossRef Medline
35. Autti T, Raininko R, Vanhanen SL, et al.MRI of the normal brain from early childhood to middle age, II: age dependence of signal intensity changes on T2-weighted images.Neuroradiology1994;36: 649 –51CrossRef Medline
36. Thomas LO, Boyko OB, Anthony DC, et al.MR detection of brain iron.AJNR Am J Neuroradiol1993;14:1043– 48Medline
37. Mukherjee P, Miller JH, Shimony JS, et al.Normal brain maturation during childhood: developmental trends characterized with diffu-sion-tensor MR imaging. Radiology 2001;221:349 –58 CrossRef Medline
38. Pal D, Trivedi R, Saksena S, et al.Quantification of age- and gender-related changes in diffusion tensor imaging indices in deep grey matter of the normal human brain.J Clin Neurosci2011;18:193–96
CrossRef Medline
39. Raichle ME.Behind the scenes of functional brain imaging: a his-torical and physiological perspective.Proc Natl Acad Sci U S A1998; 95:765–72CrossRef Medline
40. Jueptner M, Weiller C.Review: does measurement of regional cere-bral blood flow reflect synaptic activity? Implications for PET and fMRI.Neuroimage1995;2:148 –56CrossRef Medline
41. Sokoloff L.Localization of functional activity in the central nervous system by measurement of glucose utilization with radioactive de-oxyglucose.J Cereb Blood Flow Metab1981;1:7–36CrossRef Medline
42. Chugani HT, Phelps ME, Mazziotta JC.Positron emission tomogra-phy study of human brain functional development.Ann Neurol
1987;22:487–97CrossRef Medline
43. Petersen ET, Mouridsen K, Golay X.The QUASAR reproducibility study, part II: results from a multi-center arterial spin labeling test-retest study.Neuroimage2010;49:104 –13CrossRef Medline
45. Chen Y, Wang DJ, Detre JA.Test-retest reliability of arterial spin labeling with common labeling strategies.J Magn Reson Imaging
2011;33:940 – 49CrossRef Medline
46. Alsop DC, Detre JA, Golay X, et al.Recommended implementation of ar-terial spin-labeled perfusion MRI for clinical applications: a consensus of the ISMRM perfusion study group and the European consortium for ASL in dementia.Magn Reson Med2015;73:102–16CrossRef Medline
47. Song XX, Yu BW.Anesthetic effects of propofol in the healthy hu-man brain: functional imaging evidence.J Anesth2015;29:279 – 88
CrossRef Medline
48. Venkatraghavan L, Poublanc J, Bharadwaj S, et al.Noninvasive mea-surement of cerebral blood flow under anesthesia using arterial spin labeling MRI: a pilot study.J Neurosurg Anesthesiol2015 Sep 20. [Epub ahead of print]Medline
49. Chiron C, Raynaud C, Mazie`re B, et al.Changes in regional cerebral blood flow during brain maturation in children and adolescents.
J Nucl Med1992;33:696 –703Medline
50. Lenroot RK, Gogtay N, Greenstein DK, et al.Sexual dimorphism of brain developmental trajectories during childhood and adoles-cence.Neuroimage2007;36:1065–73CrossRef Medline
51. Epstein HT.EEG developmental stages.Dev Psychobiol 1980;13: 629 –31CrossRef Medline
52. Hudspeth WJ, Pribram KH.Stages of brain and cognitive matura-tion.J Educ Psychol1990;82:881– 84CrossRef
53. Epstein HT.Stages of increased cerebral blood flow accompany stages of rapid brain growth.Brain Dev1999;21:535–39CrossRef Medline
54. Rowan RA, Maxwell DS.Patterns of vascular sprouting in the post-natal development of the cerebral cortex of the rat.Am J Anat1981; 160:247–55CrossRef Medline