291
©IJRASET: All Rights are Reserved
Analysis of Urine Samples to Classify as Hydrated
or Dehydrated using Image Processing and
XGboost Model
Mohammed Azam Sayeed1, Sakeena Fiza2, Noor Ayesha3, Mohammed Akram Sayeed4
1
Department of Computer sciences, SET Jain University Bangalore -562112
2
UG Student at UC Berkeley
Abstract: This paper presents a Methodology which classifies urine samples into normal hydration or dehydration labels using image processing techniques and XGboost ensemble boosting model. Images of urine samples were captured by the digital camera and processed through image acquisition, color transform, image segmentation, and feature extraction procedures. Suitable Features are extracted which serves as a train and test set for the XGboost model which can be improvised using feature importance. The proposed methodology is a valuable alternative to Standard Laboratory test for dehydration being Economical, faster, efficient and reliable alternative.
Keywords:Hydrated, Dehydrated urine levels, colorspaces, Image segmentation, Feature extraction, xgsboost model
I. INTRODUCTION
Water is a critical ingredient for our survival and its absence or even its presence in excess will very quickly prove to be lethal to our mortality. Heat Waves and Dehydration in the Elderly from the BMJ: British Medical Journal states “Dehydration with or without concurrent electrolyte disturbances in itself is an important cause of death, but it is also an important factor in most other causes of death,”[1] (Rikkert 119). The hydration status serves as an indicator of the diseases an individual has. Dehydration has been linked to several ominous disorders such as but not limited to; gastrointestinal, circulatory, urological and neurological disorders. Whereas, fluid overload poses a prominent threat in terms of hyponatremia, edema, cardiopulmonary disorders, and postoperative complications.
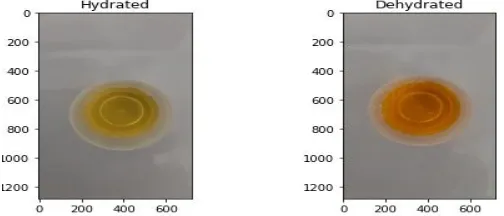
[image:1.612.181.433.614.722.2]The Present Systems to estimation dehydration levels of patients such as Blood tests and Urinalysis have the major drawback for being non economical, time-consuming and not a very flexible approach. This paper will propose an alternative Methodology to determine whether the urine samples is of normal hydration or dehydration level in an economical, faster, efficient and reliable way ,useful for both patients and health workers.The Paper evidences the employment of an innovative system to identify if an individual is dehydrated and normal levels of hydration. The technology is advanced and more efficient than traditional lab methodology and more reliable than conventional eye observation. It involves the acquisition of digital images of urine samples, followed by image processing for featuring extraction and implementation of the XGboost model. The automation of the identification of the hydration status of a patient will prove to be extremely helpful as health-care outcomes will exponentially improve and will be complemented with cost reduction. This automated technology can be utilized by doctors and even the general population as a convenient and economical method to keep track of electrolyte and hydration levels. This will allow patients to take pre-emptive measure to quickly replace lost body fluids. The implementation of this novel and advanced algorithm would radically change the state ambiguity surrounding the relationship between hydration status and diseases and catalyze to further study and understand dehydration and normal hydration.
292
©IJRASET: All Rights are Reserved
II. IMPLEMENTATIONOFXGBOOSTMODELFORSUPERVISEDLEARNING
A. Introduction to Ensemble Approach
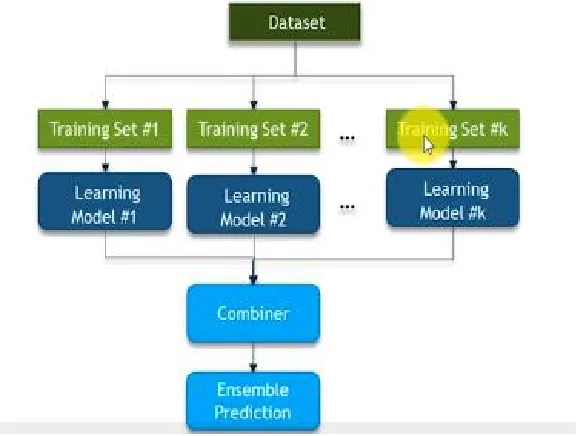
[image:2.612.170.458.165.383.2]The Ensemble approach combines several base models to produce one optimal predictive model rather than depending on the singular model built for prediction. In other words, Instead of building one model for the entire dataset, the Ensemble approach divides the dataset into an n Training set and build a model on each Training set, then it take an aggregate of the output of the individual models for decision.
Fig. 2 Ensemble Prediction.
There are two techniques in Ensemble
1) Bagging: The technique which works on Sampling with Replacement of dataset. Multiple Models such as decision trees are modeled based on multiple dataset generation via sampling with replacement. The concept can be understood from the below example
Fig. 3 Process of Bagging
[image:2.612.188.434.457.642.2]293
©IJRASET: All Rights are Reserved
[image:3.612.221.379.200.274.2]2) Boosting: Boosting is the process that uses a set of machine learning algorithms to combine weak learners to form strong learners to improve the accuracy of the Model. Unlike Bagging where the weak learners are trained sequentially, in boosting weak learners are trained in parallel and have weighted Samples. The Concept of boosting can be understood in below example of Ada Boost. Create First Bag of Data D1 randomly from Train Data. Model m1 is trained using D1. The variation from boosting is that then model is tested using all the data points from a train set, using this we discover points that didn't classify well using M1( highlighted in pink). This error points for the weighted dataset for next sequential model M2 which will be modeled on bag D2 having more likely variations of error data points. Then Entire Train Data is tested on both sequential models M1 and M2, in turn, find the next set of Incremented weights/Error points which will be used for next Bag and subsequent model. The process is repeated for desired m sequential weak learners.
Fig. 4 Process of Boosting
Summarizing Ada Boost
a) Step1: Each data point is weighted equally for the first Bag.
b) Step 2: Train Model, test entire Train dataset against the model and Misclassified data labeled with higher weights.
c) Step 3: New Bag is drawn by considering higher weight data points. Repeat step 2.
d) Step 4: The process of sequential model generation continues until all data points are classified correctly.
3) Gradient and XGBoost intuition : Gradient Boost is a Sequential ensemble model in which the base learner-generated sequentially is always better than the previous one. Difference between Gradient boost and Ada Boost is the Weights of Misclassified outcomes are not Incremented Instead it optimizes the loss function of the previous learner by adding a new Adaptive Model (Additive Model) that reduces the loss function. The aim is to Reduce Error/log function of the previous weak learner in improve performance. XGBoost was introduced as a variation of Gradient boosting as it is a bit slow due to many sequential operations. XGBoost is an advanced version of gradient boosting focused on Computational speed and efficiency. It uses Parallelization, Distributed computing and optimized cache utilization for better performance.For our application of urine analysis, we will use xgboost for implementation. xgboost as an Ensemble boosting algorithm works well for image processing problems because of the concept of multiple weak learners, each weak learner modeled for combinations of feature data points obtained from the image, will result in better throughput and also having better performance advantage over gradient boosting.
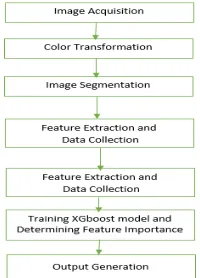
III.PROPOSEDMETHODOLOGY
The Methodology can be broadly explained in two steps- Image processing techniques for feature extraction and Implementing the Xgboost model. Python jupyter notebook is used as Prototype software. Skimage and Scipy packages are used for image processing because it represents images as Numpy arrays which makes image processing much more understandable and gives us the ability to do various powerful image processing operation on images as pixel data represented as n x m array.
[image:3.612.256.356.574.713.2]294
©IJRASET: All Rights are Reserved
A. Image Acquisition
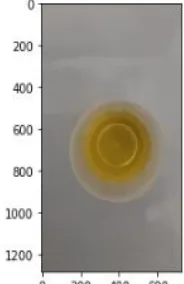
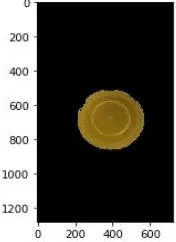
Images were acquired using a digital camera with at least five megapixels of resolution. Urine Sample of the patient is to be taken in a standard Urine test cylindrical container used in a diagnostic lab from top view. Although the algorithm is robust of any
background texture, luminesce, and shadows of Images of the Container but preferably to take sample images with a background of consistent color like shades of white or gray.
Fig. 6 Input image – Urine Sample
B. Color Transformation
[image:4.612.261.353.148.290.2]After the acquisition of the image, the RGB image is converted to various color spaces which will be the basis for further processing on the image. Few of the experimented transformation of various color spaces are depicted in the figure 8. As we can notice that In grayscale color there is a distinction between object and background but still has effects of shadow and background reflections. Enhanced color space is HSV is better but is not robust against background noise and sharp intensity changes. After Observing multiple color spaces, results conclude Individual extracted Saturation component from HSV is the best choice for the methodology. Saturation is similar to the concept of tint, except that full saturation produces no tint, while zero saturation produces white, a shade of gray, or black. This step will assist in image segmentation.
Fig. 7 Comparision of Various Color Transformation
C. Image Segmentation
295
©IJRASET: All Rights are Reserved
[image:5.612.156.254.73.226.2] [image:5.612.327.461.79.226.2]
Fig. 8 Segmentation using Ostu’s Algorithm Fig. 9 Morphological snakes –Chan Vese
[image:5.612.233.413.296.406.2]On the contrary, MorphACWE works well when the pixel values of the inside and the outside regions of the object to the segment have different averages. Unlike Chan vese, MorphACWE does not require that the contours of the object are well defined, and it works over the original image without any preceding processing.
Fig. 10 Morphological snakes –ACWE
Since the Methodology's primary focus is on performance and accuracy we chose Ostu's algorithm for preferred segmentation algorithm as it is way faster in performance as no Iterations required, unlike Morphological Snake.
[image:5.612.261.349.475.596.2]The segmented image will be used to extract ROI from RGB image, such that only the segmented region will retain original values and the background values will be zero, which make the process of Feature Extraction quite efficient, robust and accurate.
Fig. 11 Final Segmented Image using Ostu’s Algorithmn
D. Feature Extraction and Data collection
296
©IJRASET: All Rights are Reserved
Each Component of the above mentioned 11 colorspaces gives us 28 features and one target variable 0- Hydrated levels and 1- Dehydrated levels of urine sample. The same process is used for Data Generation and Collection. Urine Sample Images were collected from a diagnostic laboratory such that 15 images had the various level of normal hydration level and 15 images of dehydration level of affected patients and 4 Random images were excluded for validation. Methodology steps of 3.1,3.2,3.3 and 3.4 were repeated iteratively for all 30 images and generated features data values were stored in CSV format using the Pandas package in python.
1) Feature Scaling: This is an additional step in Methodology which is optional, we chose to include in the algorithm because few features such as R, G, B and CB, cr components have a higher scale than other component values. Feature scaling will avoid the bias of higher scale measure features for target prediction. MinMax scaler was used as an algorithm. Note if this optional step is included for implementation we need to perform scaling to test and validation dataset as well before prediction as the trained model will be trained based on scaled trainset.
E. Training XGboost Model and Determining Feature Importance
Prototype uses the Pandas package from python to create dataframe. Data frame is convenient way to handle dataset. Sklearn package is used for train_test_split for splitting data into train and test to 70% as train data and 30% as test data.
Fig. 12 train_test_split
[image:6.612.206.434.393.478.2]where X is the Features and Y are the corresponding targets having 0,1 representing hydrated and dehydrated level urine correspondingly. We then use the train set to build the Xgboost model using the Sklearn package. Variables in xgboost can be altered and changes can be observed for tuning models.
Fig. 13 XGboost Model
Y_pred/Prediction on x_test can be compared with actual values y_test to evaluate the metrics for the trained model Confusion matrics and accuracy can be to determine the model efficiency in prediction.
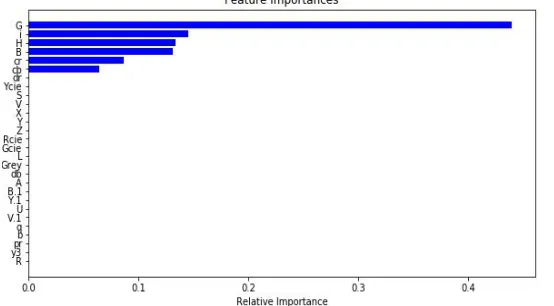
[image:6.612.166.443.561.714.2]1) Improvising XGboost model : XGboost has a fascinating feature of finding the feature importance which conveys which features contributed the most for predicting the Targets. On the scaled Dataset, Xgsboost says that the best contributing features for prediction are G, i, H, B,cr, and cb.
Fig. 14 Feature Importance on scaled Data from sklearn.model_selection
import train_test_split
x_train,x_test,y_train,y_test=train_test_split(X,Y,test_siz e=0.3)
#pip install xgboost import xgboost as xgb
xgbc=xgb.XGBClassifier(n_estimator=10,max_dept=5) xgbc.fit(x_train,y_train)
297
©IJRASET: All Rights are Reserved
2) Results after Feature Importance: After Feature importance insights Xgboost was trained with only G, i, H, B,cr and cb features as Figure 14. There was a very slight improvement in accuracy as the Xgboost ensemble boosting method because XGboost is already an efficient, optimized algorithm based on several weak learners to make a stronger prediction.
So Feature importance and Feature scaling is an optional step in the methodology.
IV.RESULTSANDDISCUSSIONS
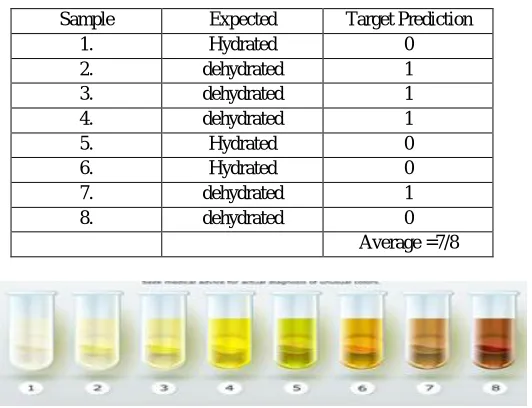
[image:7.612.180.446.204.408.2]The proposed system was validated using 8 Random samples as the validation set not used in training phase of model for unbiased validation. The Prototype correctly classified the images to correct targets as hydrated or dehydrated with a very high accuracy level as +97.5%.
Table I. Validation test
Sample Expected Target Prediction
1. Hydrated 0
2. dehydrated 1
3. dehydrated 1
4. dehydrated 1
5. Hydrated 0
6. Hydrated 0
7. dehydrated 1
8. dehydrated 0
Average =7/8
Fig. 15 Future scope of methodology
This Algorithm can be extended to the in-depth analysis of urine samples after researching further in Image processing and Feature Extraction. Instead of having two target classes as hydrated or dehydrated levels we can classify Urine images to many distinct classes signaling its corresponding medical interpretation and corresponding diagnosis as fig 15. Such as below additional classification targets
1) Pink or Red: It could be a warning sign of kidney disease, tumors, urinary tract infections, prostate problems or mercury poisoning. Another reason your urine could be reddish is if you’re deficient in iron or have problems metabolizing iron, according to a study published in the Journal of Current Surgery.
2) Orange: If you haven’t consumed food or drinks with orange dye, you may be dehydrated. In more severe situations, you could have a liver or bile duct condition.
Blue or green: In rare instances, blue or green urine can be the result of a genetic disorder called hypercalcemia or a specific form of urinary tract infection called a Proteus infection.
Thus this paper lays a good foundation of in-depth analysis and research of getting insights from urine color and composition.
REFERENCES
[1] Rikkert, Marcel G M Olde, et al. “Heat Waves and Dehydration in the Elderly.” BMJ: British Medical Journal, vol. 339, no. 7713, 2009, pp. 119–120. JSTOR, www.jstor.org/stable/25672092.https://academic.oup.com/nutritionreviews/article/73/suppl_2/97/1930742
[2] Mohammed Azam Sayeed & Shashikala G2, Sakshi Pandey,Ruhi Jain & Satish Kumar N," Estimation of Nitrogen in Rice Plant Using Image Processing and Artificial Neural Networks", Vol-2, Issue-8, 2016 ISSN: 2454-1362, http://www.onlinejournal.in,IJIR
[3] A Satish Kumar N, Sakshi Pandey, Ruhi Jain, Mohammed Azam Sayeed & Shashikala, “Detection of Weeds in a Crop Row Using Image Processing ”, Vol-2, Issue-8, 2016 ISSN: 2454-1362, http://www.onlinejournal.in, IJIR
[4] 3. F. Carté F. Dibos G. Koepfler "A morphological scheme for mean curvature motion and applications to anisotropic diffusion and motion of level sets" SIAM Journal on Numerical Analysis vol. 32 no. 6 pp. 1895-1909 1995.