I
A Graphical Browser for
Interaction Networks
by
Lip Chau THOO
Oct 1991
Supervised
by
Mr. Paul Ashton
ABSTRACT
TABLE OF CONTENTS
Abstract
1. Introduction
2. Interaction Networks 2.1 Concept
2.2 Implementation
3. Aims of Project
4. Study of Related Work 4.1 lPS-2
4.2 Xgrab 2.3
5. The IN-browser program 5.1 Tools Selection
5.1.1 Hardware 5.1.2. Software 5.2 Analysis of Xgrab 5.3 Data Structures
5.3.1 Interaction Networks 5.3.2 IN-browser
5.4 Functionalities of IN-browser
5.4.1 Loading an Interaction Network 5.4.2 Event Spacing
5.4.3 The Critical Path 5.4.4 Event Filters 5.4.5 Display Hierarchy 5.4.6 Event Information
5.4.7 Analysis of Interaction Networks 5.4.8 Other Features of IN-browser
1
3
6
7
9
6. Using IN-browser on a Real Interaction Network 21
7. Potential Extentions to IN-browser 24
8. Conclusions 25
References 26
Appendix - User guide for IN-browser 27
Chapter 1
Introduction
Loosely-coupled distributed systems [1], collections of computer systems connected only by communication networks, are becoming increasingly popular. Distributed services are provided by the resources on these systems, using only the network to coordinate their work and to transfer
information. Processors, memory and clocks are all local to each
computer, and the computers involved in such a distributed service are linked only by messages across the network.
Performance measurement and analysis of such systems presents new problems because of the greater concurrency involved, and the lack of global state information. Communication between the computers in such systems is of particular interest because the network is a potential bottleneck, and because remote requests are often considerably more expensive than local requests.
Interaction networks (INs) have been proposed as a way of representing the execution of an interaction on a loosely-coupled distributed system [2]. Command-line tools to prepare an IN for display on a general graphical browser, Xgrab [3], and to produce performance information from an IN have been written. The aim of this project is to develop a special-purpose graphical browser to display INs, with particular emphasis on the handling of large IN s, and to provide a graphical interface to the analysis tools.
This report recounts the work done on designing and implementing a graphical browser for INs on Sun workstations running SunOS 4.1, and in a broader sense, to use it to analyse performance data derived from INs. Chapter 2 gives a brief description of the concept of INs. In Chapter 3, the proposed features of the IN-browser program are outlined, and they are in turn linked to the aims of this project. Following that, a brief study of related work is presented in Chapter 4. Chapter 5 goes into the details of the data structures and the implementation of
IN-browser. Observations from an experiment carried out on an IN
representing the compilation and linking of a simple C program are
extensions to IN-browser, and in Chapter 8, conclusions are drawn for this project.
Chapter 2
Interaction Networks
In this chapter, a brief description of the concept of Interaction Networks
(INs) is given. It is by no means a complete discussion, and the reader is
referred to [2] for in-depth details.
2.1 Concept
An interaction is defined as a <user action, system reaction> pair, where the user action is a request or something similar initiated by the user of. a computer system, which triggers off a system reaction. A "task" consists of all the processing for the reaction, and is made up of one or more sub-tasks. A "sub-task" is some part of the task whose steps are carried out in a wholly sequential manner.
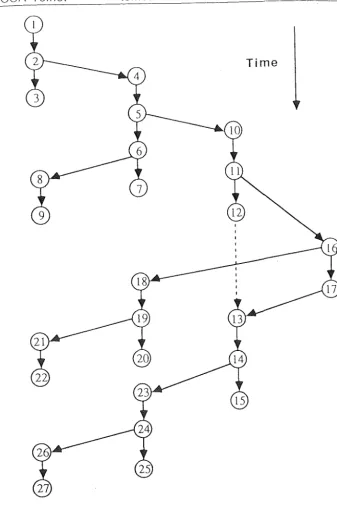
An IN is the representation of a single task in the form of a connected acyclic digraph [4] that depicts both the interrelationships of the sub-tasks, and the individual events within each sub-task. Each event is represented as a vertex in the IN and has associated with it, among other things, the time that the event occurred. Arcs connect successive events' vertices in each process and each message. For an event that generates a message, there will be an arc from that event's vertex to the first vertex of the message, in addition to the process-related arc to the next event in its process thread.
A task is usually carried out by several processes which may span several computers. Each computer is uniquely identified by its DARPA internet number, while each process is identified by its process ID (PID) and the machine on which it occurred, since PIDs are not usually unique across the constituent computers in a loosely-coupled system.
Fig 2.1 gives an illustration of an IN. There are four processes, namely NCSA Telnet, telnetd, csh and date. The task consists of all 27 events, which belong to 9 separate sub-tasks (1-2-3, 2-4-5-6-7, 6-8-9 etc.)
The main area of interest in the study of INs is response time. To
pursue this, the critical path (CP) [5] of an IN is identified. The CP
indicates the activities, the duration of at least one of which must be
NCSA Telnet telnetd csh date
[image:7.610.98.436.56.563.2]Time
Fig 2.1 Example of an interaction network
reduced, in order to reduce the response time of the interaction. There is always at least one CP in an IN because there always exists one or more paths which contain no "slacks", in this case the slacks being the blockings of sub-tasks while waiting for other sub-tasks. Although
(
) \.
2.2 Implementation !
I
I
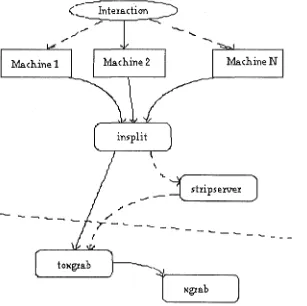
Software to record and analyse INs has been implemented on Sun workstations running SunOS 4.0. \. To collect information pertaining to recognized events, a set of event recorders have been installed in the
kernels of two Sun 3
I
50s. Each of the Suns writes event records to its ownlog file. An IN is formed from the log files of machines involved in the system reaction. The IN is then optionally fed into a program which removes events on a server (file server, for example), which had wronglyr ,
been included in the IN. Finally another program takes the (stripped)
n,.f
and produces layout information for Xgrab.
In addition to the above tools, there is also an analysis program,
analyse, which takes an IN and from it, produces up to 12 different sets of statistics, made up of three different levels (process, machine or overall), two event scopes (all the events on the IN or only those on the CP) and two event categories (process-related and message-related). Statistics computed include event counts, event state counts and state times, disc usage, and a summary of remote requests .
Machine 1
...-(_ Intexadion
[image:8.597.134.441.355.661.2]...
...
MachineN
insplit
'
_ _:
~
stxi psexve:tJ
.,.
.,,
---...._
J
Fig 2.2 How browser layout information is obtained from an interaction
Chapter 3
Aims of Project
As mentioned in Chapter 1, the main objectives of this project are to implement a program to display interaction networks (INs), to handle large INs, and to provide a direct interface with the analysis programs.
To satisfy the first objective, IN-browser will
include:-i) the loading of an IN specified at the command line or within IN-browser, and displaying it.
ii) the ability to lay out the graph from top to bottom in progression
with time.
iii) two options of event spacing:-a) time-dependent
- they-coordinate is linear to event time. b) partial ordering
- event vertices are equally spaced in the time (y) axis. Event ordering is preserved, that is, events related to each process and each message appear in the correct order.
To deal with large INs, IN-browser has the following
features:-i) filtering out events of little interest. The types of events to leave out can be chosen in one or more
ways:-a) machine level specifies computers that are to be left out. b) process level specifies processes that are to be left out c) sub-task level specifies sub-tasks that are to be left out
ii) displaying the digraph at several levels of abstraction. This enables
the user to have access to the relevant information, yet not being overwhelmed with excessive details. The hierarchy of display will include a machine level, a process level, a sub-task level and a primitive event level.
To provide an interface to some of the analysis tools, program features include:
-i) distinguishing the critical path (CP) by using a different brush type for arcs on it. The CP is calculated by calling one of the analysis tools.
ii) providing access to event information from within IN-browser.
iii) providing access to some of the analysis tools, such as
analyse,
aChapter 4
Study of Related Work
The first stage of the solution was to have a look at existing graphical browsers.
Most of the programs surveyed [6][7] are related to performance debugging of distributed or parallel systems. They are slightly different from program debugging in the sense that they are looking for mostly
network or synchronization problems rather than bugs. Two main
programs which resemble the proposed IN-browser program are briefly discussed here.
4.1 IPS-2
This is a performance. measurement system for distributed
"programs" [8]. It allows the user to view the statistics of a program's
execution at five levels of detail: i) program level
ii) machine level
iii) process level
iv) procedure level
v) primitive activity level
This method permits a user to focus on areas of interest. To perform critical path analysis (CPA), the authors construct a program activity graph (P AG) - rather like an interaction network, but they have not developed any software for the display of PAGs, rather PAGs are used internally for purposes like the computation of statistics.
4.2 Xgrab 2.3
Xgrab [3] is the X Window System version of GRAB Graph Layout
suitable for IN-browser, such as the data structure for the nodes and the edges of a digraph, zooming and panning the display area, changing the nodes' shapes, brushes and colours, automatic resizing of the display area,
and node and edge labelling. It can also handle node and edge addition,
Chapter 5
The IN-browser Program
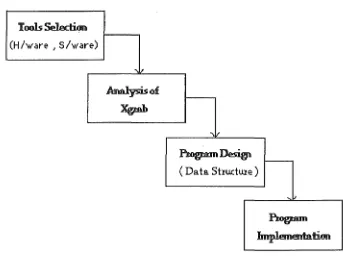
This chapter describes in detail the development and implementation of IN-browser. First, some preliminary decisions on hardware and software
selection are discussed, followed by a brief analysis of Xgrab [3]. It is
essential to look at Xgrab because IN-browser is going to be based on Xgrab. Then, the major data structures of IN-browser are outlined, followed by a detailed examination of the features of IN-browser.
Tools Selection
(H/ware , s/ware)
~~
( Data Shuctwe )
.... J
Fig 5.1 Major steps in the development of IN-browser
In order to clarify the terminology used in this chapter, here are some often-used terms
:-i) node
- this refers to a vertex on the digraph, and is not to be confused with a device on a network. In Ashton and Penny's article, they referred to this as a vertex.
[image:12.597.114.457.338.599.2]- this refers to a device (usually a computer) connected to a distributed system.
iii) arc/ edge
- these two terms will be used interchangably to refer to the connection between two nodes.
5.1 Tools selection
One of the first design level decisions was that of selecting a computer on which IN-browser would run on, and the software tools to be employed to develop it.
5.1.1 Hardware
The eventual choice of a Sun workstation was a completely natural one, since the performance monitoring tools have been written specifically for collecting events information on this machine. Moreover, several analysis programs have been implemented on it.
5.1.2 Software
The appeal of reusing parts of Xgrab's source proved to be decisive in this aspect. To start from scratch would have involved too much time and effort. The learning curve would have been too steep for me to get very far with the project. Hence, besides being able to reuse some existing code that has been tested, basing IN-browser on Xgrab also provides a second, and arguably more essential benefit, that of a working framework of a program that is in some ways similar to IN-browser. Therefore it was decided that IN-browser be written in both C++ and C (as in Xgrab) for SunOS 4+.
5.2 Analysis of Xgrab
Having decided that Xgrab was to form the basis of IN-browser, it was necessary to understand its workings and to remove irrelevant code.
The initial step was to learn C++ [9], an object-oriented extension of the C programming language. Fortunately, for the purpose of IN-browser, the finer details of C++ was not necessary.
Xgrab's source can be divided into two sections: user interface and internal processing. A large portion of the user interface section uses the InterViews 2.6 toolkit, which is written in C++. There are 10 user-defined
classes, largely based on InterViews's own classes, which perform
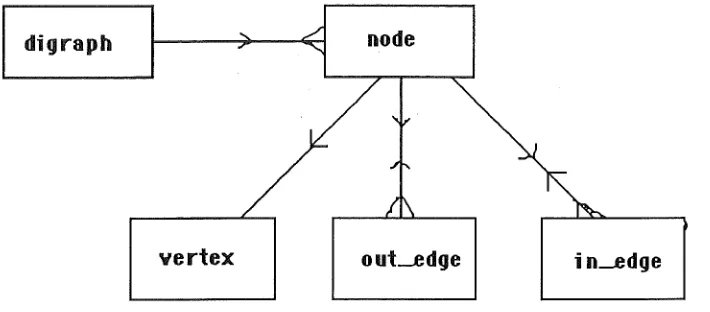
The other part of Xgrab is written in standard C, and includes most of the digraph-related data structures as well as other aspects not directly related to the interface, such as creating a digraph's nodes and edges.
digraph node
vertex out--edge in--edge
Fig 5.2 Main data structures of Xgrab.
The main data structures of Xgrab are shown in Fig 5.2. A digraph has one or more nodes, each of which is physically represented on the screen by a vertex (an Xgrab term, not to be confused with a vertex on an IN). Each node can have one or more out-going edges and one or more in-coming edges.
The next step was to identify irrelevant code and remove it. This turned out to be more difficult than anticipated, due to poor, sometimes non-existent, source level documentation. A small amount of code in Xgrab is never even called.
5.3 Data Structures
5.3.1 Interaction Networks
In the existing analysis programs, an interaction network (IN) is stored as an acyclic digraph. Each digraph node is represented by an
innode structure, which in turn, indexes a perf-record structure
containing the event information for the event associated with the
digraph node. The innode structure also contains pointers to other
related in nodes, such as the previous and the next process-related innodes.
It also records the DARPA internet number of the machine on which the
event took place.
[image:14.595.113.468.145.301.2]5.3.2 IN-browser
IN-browser will make use of all the digraph-related data structures
in Xgrab. These include digraph, node, vertex, in_edge and out_edge .
To link a node to the in node it is displaying, a pointer . has been
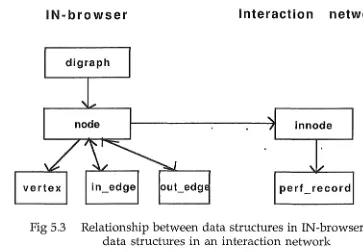
introduced to the former. The resulting interrelationships of the data structures in IN-browser are as follow:
IN-browser Interaction network
digraph
node in node
[image:15.597.78.441.196.448.2]vertex in_edge out_edg perf_record
Fig 5.3 Relationship between data structures in IN-browser and
data structures in an interaction network
Basically when the innodes are loaded into memory, a node is
created to represent each of them on the screen. Where there is an arc
linking two innode s, there will be an in_edge and an out_edge at the
correponding nodes.
5.4 Functionalities of IN-browser
In this section, every main feature of IN-browser is presented, as well as the reasons for its inclusion.
5.4.1 Loading an Interaction Network
IN-browser loads in an IN simply by calling the reading function in
one of the analysis programs. Only INs formed by insplit will be accepted.
It is not essential for them to be stripped of extraneous server events.
When the IN has been successfully read in, IN-browser creates a digraph
for it, with a node for each innode . The position of each node is then
calculated, using a few pre-defined parameters and the current ordering
flag (time-dependent or partial order, see next subsection). Edges are
the process, the sub-tasks, and the messages in the IN are identified. These information are required for some of the features of IN-browser discussed below.
5.4.2 Event Spacing
The digraph is laid out in columns of process-related nodes, each column representing a process in the system reaction. All events of a particular process will be displayed under that process's column. Message-related nodes are placed in an imaginary line joining the message's two end nodes. The y-coordinate of each node is determined in one of two
ways:-i) time-dependent
Using the time field of the corresponding
perf _record
structure, they-coordinate of a node is calculated as a linear function of the time
difference from the initial node. The first node is placed at the
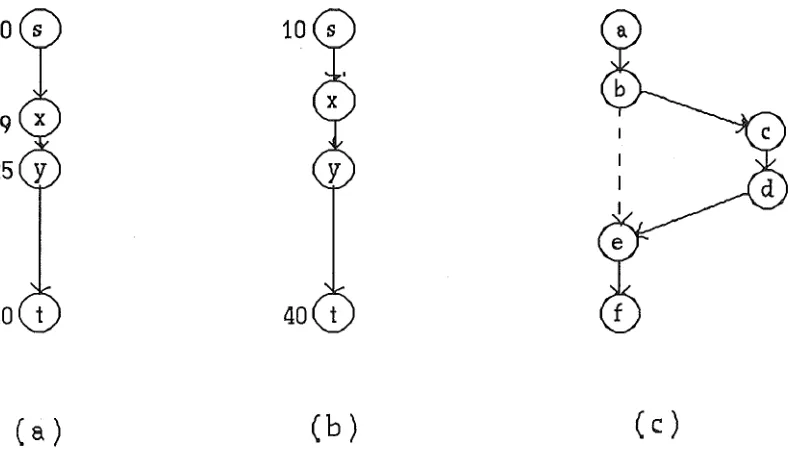
top of the display area, and the last node is at the bottom, giving a progression of time from top to bottom. This option has the effect of making the arc lengths directly proportional to the activity durations. See Fig 5.S(a). ·
ii) partial order
This option is introduced because events tend to occur in bursts, causing the nodes in the time-dependent method to be clustered.
The partial order approach spaces out events in a sub-task
uniformly, regardless of the actual durations of the activities. Most importantly, the partial order of the events is preserved. In Fig 5.S(b), we can tell that the event on node y occurred after the event on node x, but that is the extent of the information that we can extract. We cannot, as we could in the time-dependent layout,
estimate the actual duration of each event. The partial order option
also guarantees forward progression of time from top to bottom. It
will ensure that the first event of a sub-task is correctly placed
after
(a)
( b)
( c )
Fig 5.4 (a) time-dependent event spacing, (b) partial order event
spacing, (c) partial order with multiple sub-tasks
5.4.3 The Critical Path (CP)
The CP is perhaps the most important part of an IN. It represents
the shortest path from the start of the interaction to its completion. There is no slack in between any pair of consecutive events on the path. The term "slack" refers to the time period in a process caused by the fact that it has to wait for another process to finish what it (the second process) is doing, before it can continue. A slack is normally introduced when a process forks off a sub-task and cannot proceed until
the sub-task returns. An example of this is a request to a file server. The client will have to wait for the server to reply before it can go any further. Note that the time of the actual disk I/0 in the server process is part of the server's processing time, and does not represent a slack.
IN-browser provides an option to distinguish the CP by means of a different brush type for edges on it. All it does is to work out the CP and tag all nodes concerned. Then for an edge whose source node and
destination node are both tagged, its brush is changed. See Fig 5.5,
5.4.4 Event Filters
A main feature of IN-browser is the ability to filter out selected
events from the display. It hides all nodes whose events are selected (or
"filtered" out), and all the edges which originate or terminate at any of these nodes.
[image:17.597.92.486.68.296.2]i
i
·;-.,·-0···@----0---f]
,. .... <:7--·--s
: -,-.-fi·.·.·--,a
-~-..,-,O---e3
:·::.§.·.·.·,,,
----&---. ::: .... :::::
···,.-..:···,
----v .. .,,_. __~-=-::-~a~==== ~::::~;;;_:_:. q,.·:::~~:::: ~----{J.-n.·.•.,.
6
0
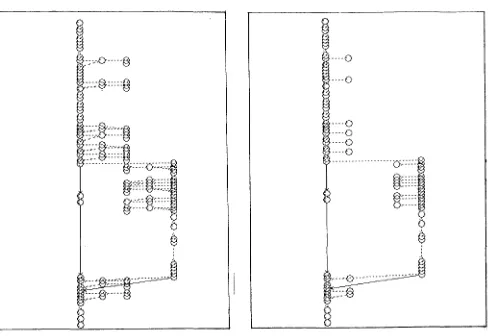
Fig 5.5 IN of "ls" with CP shown as dotted lines.
I
1:
····O~
::::g
····O 1}···1:.y::::~t:::::~
8
§~====6
0
j , .. , 0 - - , · · · · - ~
.~---. .,,....,.-';::)
§
Fig 5.6 IN of "ls" with all no weka events
usually appear as a group or not at all, such as those for recording keyboard
input <"kbd-input-begin", "kbd-input-end"> or for context switches
<"switch", "setrq", "resume">, only need one node each to indicate their presence. So we really only need, say, "kbd_input-begin" and "switch" events in each case. Secondly, we can hide events that are of little interest,
and analyse the IN as if these events do not exist.
There are three ways of selecting events that are to be left out:
i) machine filters allow the user to filter out one or more machines. This means that all the events belonging to these machines are left out.
ii) process filters correspond to filtering out all the even ts belonging to
one or more processes.
[image:18.597.52.540.123.459.2]If more than one type of filters are selected, they are "or-ed" together, meaning, all the events that fall into any one of the filters' scope will be left out. Fig 5.6 show the "ls" IN with all its events on weka filtered out, and with its CP not highlighted.
Although filters are useful if used correctly, selecting them in a haphazard manner without considering the semantics of the events may result in the displayed digraph being disconnected.
5.4.5 Display Hierarchy
A useful feature of IPS-2 is the ability to display tables of statistics on the execution of a distributed program at several levels of detail. This idea can be applied to the viewing of INs by allowing the user to observe their
behaviour at different levels of abstraction. For instance, we may be
interested in the number of inter-process communications (IPCs). Hence, we would only want to see messages between processes but not process-related events. Or we may want to observe the network traffic between machines, so only messages travelling between machines are of interest. This selective display approach allows a user to focus on areas of interest without being overwhelmed by the details of other unrelated events.
It was decided that IN-browser should provide four levels of display (in
order of increasing detail) :-i) machine level
Each machine has its own column in the new digraph, and edges are inserted in the correct positions where there are messages
between any pair of machines. In other words, only message-related events are retained.
ii) process level
This is quite similar to the machine level display, but rather than giving each machine its own column in digraph, we allocate columns to each process instead. As before, edges are inserted to signify messages.
iii) sub-task level
A lower level display, showing all interrelationshps between sub-tasks.
iv) event level
This is the primitive level, where all events are displayed as they occurred. Usually quite clustered, but it does present the most complete picture of the IN.
The following diagrams depict an interaction at each of these levels. In
this case, the user had pressed the return key after typing "ls" previously.
j
Fig 5.7 (a) Machine level view of the 11
ls11
IN
.--,
Pt22 (tui) L _ J
.--,
P151 (lui) L _ J
Fig 5.7 (b) Process level view of the "ls11
IN
.--,
P104 (we L _ J
[image:20.595.120.427.72.349.2] [image:20.595.118.423.445.719.2]Internally, one digraph structure is maintained for each level. Although this design may cause digraph update problems - need to update all four digraphs when a single change (adding/moving/ deleting a node or an edge) is made - the convenience of this method cannot be denied.
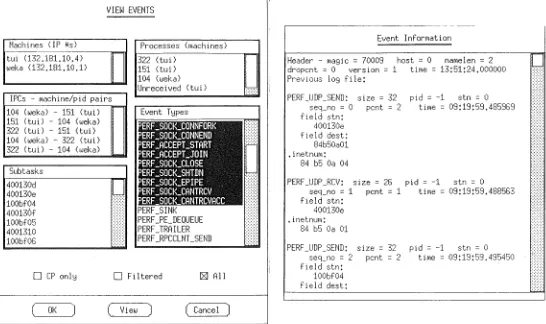
5.4.6 Event Information
Since the bulk of the details of an IN is in the events themselves, it is only natural for IN-browser to provide access to the information stored for each event.
There are two options for viewing event information. The user can request for event information associated with a particular node, or the user can request multiple-event information, in which case, event type(s), sub-task(s), processes(es) and/ or machine(s) of the events to be displayed are specified. The multiple-event option usually matches more than one event.
All event information is displayed in a separate text browser, see
Fig 5.8. The information is obtained from the
perf _record
field of thespecified innode (s).
5.4.7 Analysis of Interaction Networks
There already exists a program to analyse an IN and to produce some statistics - such as event type counts, state counts (run, ready, sleep,
etc), state times, disc usage and server requests. The analyse program can
produce two types of performance analysis, viz., process-related statistics and message-related statistics. The events to be included in the analysis can either be from the CP, from the filtered list, or from the entire digraph.
Note that previously, analyse did not provide for the filtered list option.
IN-browser provides a direct link to this program, enabling the user
to view the analysis results within IN-browser. By selecting the
machines(s), process(es) and/ or message(s) of interest, the user can look at statistics of all sorts of combinations of events.
5.4.8 Other features of IN-browser
VIEW EVENTS
~ - - - -- ~
-Processes (machines)
Machines (IP Us) Event Information
tui (132,181.10.4)
l,,eka (132,181.10.1) 322 151 (tui) ( tui) dropent = 0 Header - magie = 70009 version= 1 host= 0 tirne = 13:51:24.000000 namelen = 2 Previous log file:
104 (weka)
Unreceived (tui) :::«:
!PCs - r,,achine/pid pairs PERF_UDP_SEND: size= 32 pid = -1 stn = 0 104 (weka) - 151 (tui) Event T!:Jpes field stn: seq_no = 0 pent= 2 tirne = 09:19:59.485969 151 (tui) - 104 (weka) 400130e
322 (tui) - 151 (tui) field dest: 104 (weka) - 322 (tui) 84b50a01 322 (tui) - 104 (weka) .inetnurn:
Subtasks 400130d 400130e 100bf04 400136f 100bf05 4001310 100bf06 PERF _SINI< PERF_PE_DEQUEUE PERF_TRAILER PERF_RPCCLNT_SEND
84 b5 Oa 04
PERF_UDP_RCV: size= 26 pid = -1 stn = 0 seq_no = 1 pent= 1 tirne = 09:19:59.488563 field stn:
400130e • inetnuni:
:::4 b5 Oa 01
PERF_UDP_SEND: size= 32 pid = -1 stn = 0 seq_no = 2 pent = 2 ti roe = 0'.3: 19: 59 .495450 field stn:
O CP onl!:J O Filtered [ZJ All 100bf04
( OK
field dest: ( View ) ( Cancel )
Fig 5.8 The View-Event selectors and display
The display area can be zoomed in or out, and panned (scrolled) horizontally or vertically. There is also a function to fit the entire digraph into the display area, best utilised after zooming or panning when part of
the digraph is not visible anymore. This function is automatically
performed when an IN is first loaded.
Internally, the display area has four sets of <min-x, min-y, max-x, max-y) type values at any one time. Together they specify the absolute and the abstract drawing area and visible display area. One or more of these are recalculated every time one of the above functions are performed, or when the program window is resized.
[image:22.595.17.563.110.434.2]at creation time, the digraph has no way of knowing how many nodes it
will have, and therefore it cannot make allowance for size of the drawing
area.
Chapter 6
Using IN-browser on a Real Interaction Network
In order to see how well IN-browser copes with a "real" interaction network (IN), an experiment was carried out using an IN recorded during the compilation and linking of a simple C program.
The user who made the interaction had a shell process running on tui, one of the machines on our local distributed system. Some of the files required for the compilation of the program were on another machine, weka. Therefore, we would expect some communication between these two machines during the course of the system reaction .
.,.,.,.,.,,,.,r • . . . "./'
~=-:-~-=-=-:=-=~~~~!::-·.
~-::::::.
---.---.----_-_-_-.-:~..
·.,.,,...,,..,, ... _ .... ,,• • • • • n n u u n u n u . - . , n u . . . : : : : : : •.: : : :·.•. ·.:·.: : : •.: " . : : ; : : : : : : J.::'·//Z,./%~~~~-;-;
. ---- --- --- --- --- -- -- ---· -- ---- --- -· i::::::!!!!!!~:::!:::::::
.. ... : ···.:~~;::r .,,
·.·.;, _____ ~~-~~~::::
~- -• -- • - - - • - - - -- - - - -• -• - - - • - • - ••••••• -• - •• ,.. - -• - -• - : -.. ~ ----·.-.·.J
,,,,,,,,,,,,,,,,,,,,,,.r .. - - . . . -- - .. .
r.;,,, , , , , , .;.;;_,.,,. .,.,,. .;,-, , , , , , ,.,,,.,., ,.·.·.·.·.·.·
,,,,,,,,.,, .. ,.,,,.,,,,,. ,,, --.
L•.•.•.":,:: : : : : •.:: •. •• :-::.:.:;;;
::::":"":":":'(.,.<<~,::,::,::-"';•'/_':.'.'.'::-:..~-(.,:..~-:..~f-555555~~:=::::::::~- -. ::::::::::-::::::·.:·. ·.:: :-.-. :·---.--·{
: : : : : : : : : : : : : : : : : : : : : : -. : : -. :-. : : : -. : : : ·.::: •• 'J • -- : : ·.: •• :-. : :·. • -·. -. --. ---. .• _ -. ·.::::::: ·.: •. ·.·.-.·.--·.·J
___ ,
' : : : - : - : . : : . ~ · - - · - · · . - • • · - - - J
i~-:.:-:::::;-·--.-.-.-.-.-.1
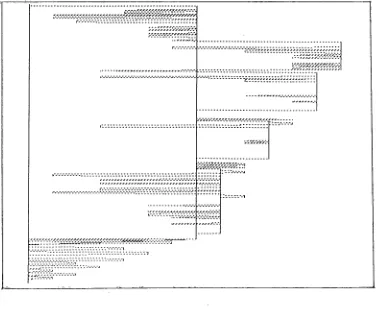
[image:24.595.90.469.397.711.2]Fig 6.1 shows the time-dependent event level display (i.e. the default display) of the IN. As expected from the compilation of a program, there are many events in the system reaction. Evidently, we learn very little about the nature of the compilation. All we can tell from Fig 6.1 at this point, is that the critical path (CP), shown here by the dotted lines,
appears to include most of the messages (the horizontal lines). This
agrees with the general belief that the communication network is the main bottleneck in most distributed systems.
II . II . II . II . II II II II 11· 11 11 11 11 11
1) <lui:G222 <)ui;G221 <)ui;G220 <)ui;G219 <)ui)!653 <)ui)H "°"hJO "°"h)9 "°"h)! (.~h)l "°"h)6 "°"h)S "°"k•)l <:,,
I
I I I I
11
I I
I
I I
I
I
I
l
l
I Q
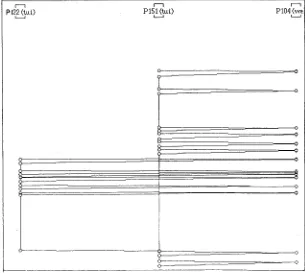
[image:25.595.149.446.229.713.2]Fig 6.2 depicts the process level view of the IN. This is definitely an improvement from Fig 6.1, in terms of the information value. Fig 6.2 still shows us the points in time where messages were transferred, and since we saw earlier that the critical parts of the interaction are the
messages, we have not lost much important details. In fact, without
having the process-related events in the way, we have been able to obtain a much clearer picture of the frequency and direction of the messages.
Looking closer at the Fig 6.2, we see that process 11653 on tui (its label partly obscured) was both the starting point and the ending point of the interaction, and we can surmise that it was the shell process where the interaction was made. This was later proved to be so by external means, that is, not directly from IN-browser.
From this example, it appears that IN-browser is able to provide a more concise view of the important areas. All the underlying events of the processes in the process level can be accessed by switching back to the event level display and using the multiple-event function's process
options. Hence, we have the assurance of access to the deepest details if we
Chapter
7
Potential Extensions to IN-browser
1. An additional user-defined level is desirable in our display
hierarchy. At this level, the user can group nodes,. and for each group, show all nodes within it, or just a "super-node" representing the group. Groups can be nested, and can be used in specifying filters. This will greatly enhance the flexibility of the display. Virtually every combination of digraph display will then be within reach.
2. Some simple modifications to the digraph should be catered for.
For example, we could like to know what effect it would have on the
length ·of the critical path (CP), · and thus the interaction response time, if
we remove a sub-task or decrease its duration. This canbe used to find out which activities to be improved on to reduce response time.
3. For convenience sake, it would be useful to be able to store all the current settings and options to be reused at a later date.
Chapter 8
Conclusions
The main aims of the project were to develop a graphical browser to display interaction networks (INs), to deal with the size and the complexity of large INs, and to provide access to existing analysis programs.
In this report, the IN-browser program was presented. IN-browser,
using Xgrab as a basis, can load and display an IN. It is also able to decrease
the amount of information on the display area to a certain degree, via event filters and its three higher level displays. A further aid to the enhancement of the appearance of a digraph comes in the form of the partial order event spacing method.
Nearly all the original command-line options for the analysis tools have been implemented in IN-browser. Where events are required as
input, such as the
analyse
program, I have included the option of passingin visible events only, in lieu with the event filters.
The critical path can be shown easily, indicating the area where performance improvement efforts should be concentrated on.
Overall, it has been shown that IN-browser has laid the foundation to a potentially sophisticated graphical browser and interface to the existing analysis programs.
References
[1] "Distributed Systems: Concept and Design"
George Coulouris and Jean Dollimore,
pp 2-5, Addison-Wesley, 1988
[2] "Decomposition of Interactive Response Times for Loosely-Coupled
Distributed Systems"
Paul Ashton and John Penny,
14th ACS Conference, Feb 1991
[3] "How to Use Xgrab (Version 2.3)"
Greg Barnes,
Tera Computer Co., Seattle, WA
[ 4] "Discrete Mathematics"
Norman Biggs,
pp 228-231, Oxford Univer~ity Press, 1985
[5] "Critical Path Analysis for the Execution of Parallel and Distributed
Programs"
C-Q Yang and Barton Miller,
8th International Conj on Distributed Comp Systems, June 1988
[6] "Debugging Concurrent Programs"
Charles McDowell and David Helmbold,
ACM Computing Surveys, Vol 21, No 4, Dec 1989
[7] "Integrating Tools for Debugging and Developing Multitasking
Programs"
William Appelbe and Charles McDowell,
Proc of W/shop on Parallel and Distr Debugging, Vol 24, No 1, Jan 1989
[8] "IPS-2: The Second Generation of a Parallel Program Measurement
System"
Barton Miller, Morgan Clark, Steven Kierstead, Sek-See Lim,
Comp Sc Tech Report #783, Uni of Wisconsin-Madison, Aug 1988
[9] "C++: A Guide for C Programmers"
Sharam Hekmatpour,
Prentice Hall, 1990
26
Appendix
User Guide for IN-browser
1. Starting IN-browser
The usage of IN-browser:
inbrowser [-e eventspace] [-p procspace] [-s scalefactor] [IN-name]
You can provide IN-browser with the initial IN to display when it is first
started. If IN-name stores a valid interaction network, it is loaded and
displayed on the screen. If IN-name exists but is not a valid IN file, then
you are given an error message. If no IN file is specified, IN-browser just drops you into an empty digraph.
The -e, -s and -p options concern node placement. -e specifies the vertical spacing between events in partial order mode (default 3). -p specifies the horizontal spacing between events in adjacent processes (default 25). -s is the scaler used for calculating Y-coordinates in time-based mode (default 2000). If-sis 0, then partial order is used.
2. Modes of operation
There are two modes of operation in IN-browser: browse mode and editmode. The current mode is indicated by an X in the box corresponding
to it in the "mode area" to the left of the Help button. You can switch
from one mode to another by clicking on the corresponding box. Initially the edit mode was meant for the user to make changes to the digraph being viewed, such as adding, moving or deleting a node or an edge, but because of time constraint, this was not implemented. In the browse mode, you can make "appearance" changes to the nodes, such as the shapes of the nodes, or the brush type of the edges.
3. Panning and Zooming
I ,
other two arrows let you zoom in or out of the digraph. Zooming is always centred on the centre of the display area, so if you want to zoom somewhere else, pan the display so that your area of interest is right under the display area, then apply zooming.
4. Flip buttons and Scrolled-lists
Two of the most common user interface widgets that you will find in IN-browser are the flipbutton and the scrolled-list. A flip button consists of a square on the left and a character string on the right. A flipbutton can be either on or off (or true or false if you like) at any time. If it is true, then there will be an X in the box. Flipbuttons are usually used for setting boolean flags. To "flip" the value of a flipbutton, click on the box or the string. To get back the original state, click it one more time.
A scrolled-list holds a list of values (normally too many to display at any one time) which you can choose one or more of. A scrolled-list has two main parts, the items on the left and the scrollbar on the right. The scrollbar lets you look and possibly select any of the items. By default if
you click on an item, that item will get selected, and all others will be unselected. For multiple selection, hold down the Shift key and click the mouse on the desired item. This method also used to unselect an item without unselected other items.
5. The File Menu
The functions under this menu are
:-i) Load Network - load an IN from within IN-browser. ii) Graph as PS - save the digraph in PostScript format.
iii) Screen as PS - save the screen (i.e. the visible part of the program) in Postscript format
iv) Quit - end IN-browser session.
6. The Analysis Menu
The functions under this menu are
These two lists contain machines and processes that appear at least once somewhere in the digraph. There are five types of information sections, i.e., one or more of the following: event counts, state times, disk usage, RPC summary and process validation. Any combination of these can be requested, simply by clicking on the corresponding
flipbuttons below the scrolled-lists. There is also a radiobox consisting of three flipbuttons for choosing the "types" of events to get their parameters included in the summary. "CP-only" passes in events on the critical path of the IN,
"Filtered" represents the events that are still being displayed after the event filters have been applied (see later section). "All", obviously means all events. Hit the "Apply" button to see the results, which are displayed on the text scroller on the right. "OK" quits this option, remembering all the options that have been set. "Cancel" quits, resetting all changes that have been made.
ii) Network Message Stats - more or less the same as in the Network
Process Stats option. Instead of choosing processes to include, you choose the inter-process communications that you are interested in. Only two information sections are provided by
analyse.
iii) Multiple-Event Info - this also blows up into two subwindows. There
are five lists of different event parameters for you to select the event(s) whose information you want to see, which is dumped into the window on the right.
iv) Single-Event Info - for fast access to one particular event. Simply choose this option and then click on the digraph node concerned, and you get the information of the associated event.
7. The Display Menu
The functions under this menu are
:-i) Filter Events - picking this option allows you to filter out, in other words to hide from the display, events based on their machines, their processes or their process types.
ii) Group Events - a sub-window comprising a radiobox of four options
pops up when chosen. You can now choose the level of digraph abstraction that you prefer on the display, by
iii) Focus on (Named) Node - let you base the display on a node that you specify. The specified node will end up in the middle of the display area. You can pick a node by clicking on it (Focus On Node) or by providing its name.
iv) Focus on (Named) Edge - similar to the above, with an edge as the point of reference.
v) "Set"-type functions - let you set the values of several program parameters.
8. The Options Menu
The functions under this menu are all on/ off type parameters of the program. Each of them indicates its value by the presence or absence of an asterisk next to its entry in the pull-down menu. An asterisk means it is ON.
i) Arc <==> Delay - this switches the method used for calculating the
y-coordinates of nodes. If it is true, the time-based method is
used, otherwise partial order is assumed. Default is ON.
ii) Show Critical Path - if ON, this show the edges on the CP with a
different brush. Default is ON.
iii) Print Node/Edge Labels - each node and each edge has a label or a
name associated with it. It has nothing to do with the IN,
rather it is just a method of reference used by the digraph. If
either of these options is ON, the resulting display may be quite messy, especially if there are many nodes in the digraph.
iv) Draw Arrow - each edge is directed. By default, arrows are drawn to show which directions edges are going, to avoid confusion.