ORIGINAL RESEARCH
Prediction of the Jugular Venous Waveform Using
a Model of CSF Dynamics
J. Kim N.A. Thacker P.A. Bromiley A. Jackson
BACKGROUND AND PURPOSE: We have previously reported a model of cerebral hydrodynamics in the form of an equivalent electrical circuit. The aim of this work was to demonstrate that the model could predict venous flow patterns seen in the superior sagittal sinus (SSS), straight sinus (STS), and jugular vein (JV) in normal volunteers.
MATERIALS AND METHODS: An electrical equivalence model of CSF and cerebral blood flow was fitted to measured arterial and CSF data from 16 healthy volunteers. Predictions of the venous outflow waveform derived from the model were compared with measured venous flows in the SSS, STS, and JV.
RESULTS: The model accurately predicted the measured jugular waveform. The measured waveforms from SSS and STS showed a less pronounced and delayed systolic peak compared with the predicted outflow. The fitted bulk model parameters provided relative values that correspond approximately to the impedance of arterial capillaries (1.0), cerebral aqueduct (⬇0), venous capillaries (⬇0), and arteries (0.01) and for the elastic capacitance of the ventricles (4.11), capillaries (⬇0), and veins (271). The elastic capacitance of the major cerebral arteries was large and could not be accurately determined.
CONCLUSIONS:We have confirmed the ability of the model to predict the venous waveforms in healthy persons. The absence of any statistically significant component of the venous waveform not described by the model implies that measurements of venous flow could be used to constrain further the model-fitting process.
T
he Monro-Kellie hypothesis states that the sum of the brain, CSF, and intracranial blood volumes is constant if the skull is intact.1Electrocardiogram (ECG) gated MR phase imaging allows quantitative, high temporal-resolution imag-ing of CSF and blood flow within the skull durimag-ing a simag-ingle cardiac cycle. MR-based studies of these flows show that the constraints of the Monro-Kellie hypothesis result in a complex homeostatic hydrodynamic mechanism that compensates for the transient increases in cerebral blood volume and arterial blood pressure occurring during systole.2,3We refer to this as Monro-Kellie homeostasis to distinguish it from the mecha-nisms responsible for the maintenance of mean cerebral blood flow. Breakdown of Monro-Kellie homeostasis has been im-plicated in a number of disease processes.2-10Almost all previous MR imaging studies rely on phenom-enologic observations, such as flow volume measurements or delay in the arteriovenous passage of the systolic pulse wave, or first-order derived variables describing more physiologic pa-rameters, notably vascular compliance within the vascular tree feeding specific venous drainage territories.2Unfortunately, the complexity of the homeostatic mechanism, common vari-ations in vascular anatomy,2,11,12variation in measurements and interpretation methods recommended by different groups,3,5,6,13-15and the limitations on the number of mea-surements available from MR imaging flow techniques com-bine to make these approaches increasingly unsatisfactory.
There is a clear need for a quantitative physiologic model to act as a substrate for principled analysis of this type of data to support direct comparison between studies and, more impor-tantly, to allow estimation of hydrodynamic parameters that cannot be measured directly with existing techniques.
We have recently reported a model that describes, using an electrical circuit analogy, the inter-relationships between arte-rial, capillary, and venous blood flow and movements of CSF between the cerebral ventricles, subarachnoid, and spinal CSF spaces.16,17When fitted to arterial and foramen magnum flow measurements, it allows direct proportional (but not abso-lute) estimation of 7 parameters that cannot be derived by direct measurement, corresponding approximately to arterial, brain, ventricular and venous compliances, and arterial, brain, and cerebral aqueduct impedances. The identification of ad-ditional localized, measurable inputs that can be used to drive the fitting process could provide more anatomic specificity. Fortunately, the existing model provides the ideal method to investigate the validity of such additional measurements be-cause observed values can be directly compared with model-based predictions. The objective of this study is therefore to demonstrate that the model can predict venous flow patterns seen in the superior sagittal sinus (SSS), straight sinus (STS), and jugular vein (JV) in normal volunteers.
Materials and Methods
Electrical Equivalence Model
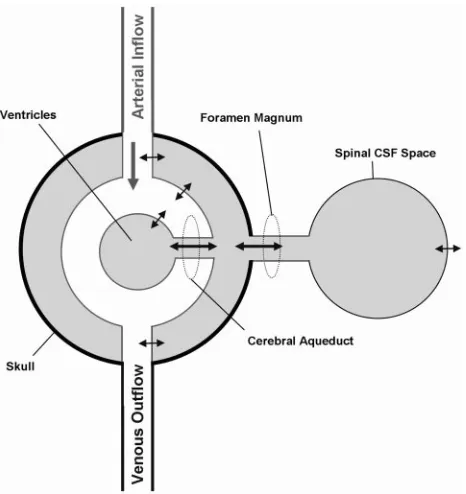
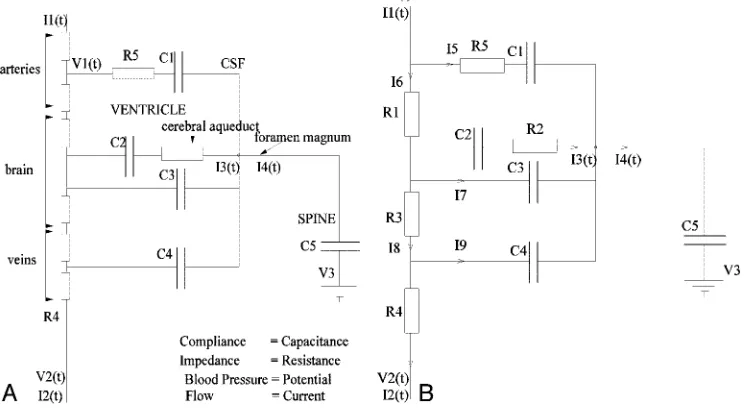
The electrical equivalence model has been presented previously.16,17 In brief, it is based on the simplified anatomic construct illustrated in Fig 1. This idealized system is modeled, treating the impedance of flow paths as resistances, the compliance of thin boundaries as capaci-tances, pressure differences as voltages, and flows as currents. This results in the electrical equivalence model shown in Fig 2A. Analysis of this model illustrates redundancy of some components, supporting
Received June 9, 2006; accepted after revision August 21.
From the Division of Imaging Sciences and Biomedical Engineering, University of Manches-ter, ManchesManches-ter, UK.
Part of this work was supported by the Medical Images and Signals IRC under Engineering and Physical Sciences Research Council Grant GR/N14248/01 and UK Medical Research Council Grant D2025/31.
Address correspondence to Dr. Neil A Thacker, Imaging Science and Biomedical Engineer-ing, The University of Manchester, Manchester, M13 9PT, UK; e-mail: neil.thacker@ manchester.ac.uk
HEAD
&
NECK
ORIGINAL
simplification to the final circuit demonstrated in Fig 2B. A series of functions that can be fitted using standard minimization approaches can then be derived (Appendix 1).
Subjects and MR Image Acquisition
MR image volumes were acquired from 16 control subjects (14 men and 2 women; age, 32⫾10 years) with no known abnormality. Writ-ten informed consent was obtained from all subjects and the local NHS (National Health Service) and University ethical committees approved the study. All subjects were scanned using a 3T whole-body imager (Acheiva, Philips Medical Systems, Best, the Netherlands). Sagittal T1-weighted images and phase-contrast (PC) angiography scout images were acquired to allow prescription of imaging planes perpendicular to the principal direction of flow (Fig 3). Velocity en-coded PC-cine MR images were then obtained at 7 points: CSF flow at the cerebral aqueduct (AQ); CSF flow at the foramen magnum (FM); arterial blood flow in the basilar artery (BA) at the level of the midcli-vus; arterial blood flow in the internal carotid arteries (CA) immedi-ately below the foramen lacerum; venous blood flow from the SSS 2–3 cm above the confluence of the sinuses; venous blood flow from the midpoint of the STS; venous blood flow from the JVs immediately below the base of skull. Two of the JV images exhibited motion arti-facts, which prevented accurate location of the vessel, and so only 14 JV images were used in the subsequent analysis. Retrospective vector electrocardiographic gating was used to generate 16 pairs of images spanning the cardiac cycle for each subject. The first image was a flow modulus image showing the anatomic location of flow and the second a velocity-encoded image in which the intensity is linearly propor-tional to flow velocity (Fig 3). The imaging parameters were: flip angle, 10 –15°; section thickness, 5–7 mm; repetition time, 8.82–22.13 ms; and echo time, 8.14 –14.39 ms; velocity encoding (Venc) was set at 10 cm/s for the AQ and FM, 90 cm/s for the BA and CA, and 60 cm/s for SSS, STS, and JV. Scan time was usually 2– 4 minutes for each region depending on heart rate; total scanning time was 15–30 minutes.
Image Processing
To obtain a reliable estimation of the AQ flow, an approximate loca-tion for the center of the aqueduct was provided manually, and a quadratic function was fitted over the 9 voxels in a 3⫻3 region around it at each time point in the cardiac cycle. The area under this curve was then integrated for all positive values of the function. The BA, CA, FM, SSS, STS, and JV flows were estimated from the sum of flow values within the region of the vessels, defined by thresholding the modulus images to find the region of interest (ROI) as shown in Fig 3.
Data Analysis
Measured values from CA and BA were combined to produce an arterial input function (carotid and basilar artery [CAB]). The flow values from CAB, FM, and AQ were then used to fit the model allow-ing prediction of venous outflow currents correspondallow-ing to I8, I9, and I2 in Fig 2B. Measured flow values from SSS and STS were summed to derive an estimated total supratentorial venous output function (Ven). Measured values of flow in SSS, STS, Ven, and JV were compared with predicted values for venous outflow from the model (I2). Waveforms were compared using Wald-Wolfowitz runs test for mean values and Mann-Whitney test for comparison of group data at each individual heart phase. Pulsatility indices were calculated for SSS, ST, JV, I8, I9, and I2 by subtracting the end diastolic flow rate from the peak systolic flow rate and dividing by the average value.4 Pulsatility indices were compared using the Mann-Whitney test.
Results
Table 1 shows the range of measured values of flow in the CAB, SSS, STS, and JV and model-based predictions of I2, I8, and I9 for all 16 subjects. The measured SSS flow showed consider-able variation from 34% to 75% of the combined CAB flows, reflecting the anatomic variation in prosencephalic venous drainage described by previous authors.12The total STS flow also showed significant but smaller variation from 11% to 21% of CAB, whereas the combined SSS and STS measurements accounted for between 46% and 92% of measured CAB. The combined JV measurements were also extremely variable, ac-counting for 48%–104% of the measured CAB in keeping with the observations of previous authors.12The presence of Ven flows equivalent to CAB presumably reflects the use of a BA measurement point distal to the inferior cerebellar and other inferior arterial branches within the infratentorial compart-ment. Likewise, the observation of JV flows in excess of the CAB presumably reflects the combination of this factor and contributions of the extracerebral circulation to jugular ve-nous drainage.
Comparison of the pulsatility indices of the observed and measured parameters (Table 1) showed that the measured val-ues of SSS, STS, and Ven were significantly lower (0.33⫾ 0.057,P⬍.05; 0.28⫾0.068,P⬍.01; 0.31⫾0.041,P⬍.05, respectively) than the predicted value for I2 (0.45⫾0.16). The pulsatility index of JV (0.51⫾0.045) was not significantly different from I2.
Figure 4 shows the time course curves from a single cardiac cycle for mean values of CAB, I2, SSS, and Ven. These repre-sent the interactions occurring within the supratentorial com-partment. It can be seen that SSS and Ven have identical curve shapes and represent approximately 70% of the predicted value of I2. In addition, there is a significant delay of approx-Fig 1.The simplified anatomic model on which the electrical equivalence model is based.
[image:2.585.54.287.41.288.2]imately 12% of a cardiac cycle between the systolic peak of the CAB and I2 curves and the measured data from SSS and Ven. Figure 5Ashows the time course of I2 and Ven (scaled to I2 [ie, equivalent bulk flow]), together with the calculated differ-ence, and Fig 5Bshows the same plot for comparison of I2 and the scaled measurements of JV. Figure 5Ashows a clear large
systolic peak in the difference graph, indicating poor conform-ance between the predicted and measured venous flows, whereas Fig 5Bshows relatively good conformance.
Figure 6 also compares the pulsatility profiles of the pre-dicted venous outflow I2 and the scaled measures of supra-tentorial flow (Ven). The curves are significantly different Fig 2.A, The electrical equivalence model derived for the anatomic model shown in Fig 1.
B, The simplified equivalent circuit after removal of redundant components.
[image:3.585.108.480.50.254.2] [image:3.585.51.536.287.624.2](P⬍.05, Wald-Wolfowitz test) with intergroup differences (P⬍.05, Mann-Whitney test) at 5 of the 16 time points. Figure 7 shows the equivalent comparison between I2 and the scaled measurement of JV. There is a smaller delay be-tween the peak of I2 and JV of approximately 6% of a car-diac cycle. A significant difference (P⬍.05, Mann-Whitney test) between the individual measurements is seen at only one time point.
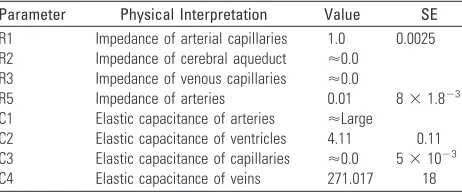
Table 2 shows the calculated values of the 7 relative vari-ables derived from the model. A measurement of pressure at some point within the cerebral vasculature would be required to set the scaling of the model and provide absolute values of the parameters. However, a pressure measurement could not be obtained noninvasively; therefore, the parameters are given as relative values, normalized to R1. As expected, the imped-ance values of the aqueduct, venous capillaries, and major ar-teries are very low, whereas the arterial capillaries (including the pial resistance arterioles) are high. Elastic capacitance in the cerebral arteries is extremely high and cannot be accurately estimated from the model because it tends to infinity, whereas the elastic capacitance of the ventricles and of the cerebral capillary bed is very low (consistent with 0). The capacitance of the draining veins is intermediate in value, approximately 50
times higher than the ventricles but far lower than the major arteries.
Discussion
In healthy subjects, systolic expansion of the basal cerebral arteries produces a pressure wave within the subarachnoid CSF (which causes an outflow of CSF through the foramen magnum into the compliant spinal CSF space) equivalent to approximately 50% of the increase in intracerebral blood vol-ume.3,4The pressure wave is also transmitted to the major dural venous sinuses by systolic expansion of the arachnoid granulations.9,18,19The effect of this is that the systolic pres-sure wave is dissipated into the formation of CSF and venous pulsatility and largely bypasses the cerebral circulation. In ad-dition, elastic artery walls absorb part of the energy of the systolic pulse wave, which is then released during diastole, further flattening the arteriolar pressure profile to which the intracerebral circulation is exposed: this is known as the Windkessel effect. Constancy of cerebral perfusion pressure is also maintained by transient systolic increases in venous back-pressure within the brain as a result of direct compression of cortical surface veins by the systolic pulse wave in the sub-arachnoid CSF space. This combination of processes main-tains a constant perfusion pressure and flow in the cerebral capillary bed despite the major pressure changes seen between systole and diastole. Abnormalities of the mechanism have been described in a number of disease states, including com-municating hydrocephalus,3 normal pressure hydrocepha-lus,2,6idiopathic intracranial hypertension,5,20secondary in-tracranial hypertension,5 ischemic white matter change (leukoariaosis),4neurodegenerative and mixed dementias, ce-rebral atrophy, and vascular depression7,21(ie, geriatric de-pression associated with cerebrovascular disease). It is now believed that, in some of these disease states, abnormalities of this homeostatic mechanism form the major mechanism of injury, whereas in others, it is unclear whether abnormalities simply reflect secondary effects.
One of the main problems associated with MR flow studies of Monro-Kelly homeostasis is the diversity of methodology used to analyze the data; there are few examples of coherent analysis approaches even in consecutive studies from single research groups. This variance largely reflects continuing con-fusion concerning the actual mechanism and its modes of fail-ure and the need to tailor analyses to specific disease states. Previous workers have described theoretic electrical equiva-lence models of intracranial hydrodynamics and have tested them with simulated datasets.22,23 However, our previous study and the work presented here represent the first attempt to validate such a model with real data.
We have shown previously that the model describes the statistical variations observed in arterial and CSF waveforms in healthy persons.17In this study, we have demonstrated that the model is capable of predicting the venous outflow wave-form in the jugular vein with an acceptable level of accuracy, confirming the assumptions implicit in the simplified ana-tomic model (Fig 1) on which it is based. Nonetheless, a review of the literature indicates that it is likely to be overly simplistic for use in pathologic conditions.18First, there is a clear func-tional dichotomy between the superficial and deep cerebral venous drainage territories, which are not represented sepa-Table 1: The measured flow volumes and pulsatility indices (PI)
from the superior sagittal sinus (SSS), straight sinus (STS), combined venous outflow (SSSⴙSTSⴝVen), jugular vein (JV), and arterial inflow (carotidⴙbasilar arteriesⴝCAB), the predicted flow volume for I2 (overall venous outflow in the model), and the predicted indices for I2, I8, and I9
Volume (ml/min)
PI (mean⫾SD)
SSS 305.79⫾53.59 0.33⫾0.057
STS 87.23⫾16.61 0.28⫾0.068
Ven 392⫾61.4 0.31⫾0.041
JV 312⫾138 0.51⫾0.045
CAB 536.21⫾73.61 0.81⫾0.21
I2 536.21⫾71.14 0.45⫾0.16
I8 0.0037⫾0.0013
I9 1.91⫾0.53
[image:4.585.52.284.106.422.2]rately in the model, in the way that they respond in different disease states.2,6 Second, there is a need to understand the distribution of systolic pulse wave energy within the superfi-cial venous system and major dural venous sinuses. Third, the variations in CSF flow in the supratentorial and infratentorial compartments may require explicit modeling. In this study, we showed that the major dural venous sinuses in the supra-tentorial compartment have a later and less pronounced sys-tolic waveform than those predicted by the model and ob-served in the jugular venous outflow. This supports the observations of previous workers that the infratentorial CSF dynamics are characterized by an early outflow of CSF from the fourth ventricle.11
Alperin et al24have identified a temporal discrepancy be-tween the fluid inflow (arterial) and outflow (venous plus CSF), which indicates the existence of small temporal fluctu-ations in intracranial volume. They attribute these changes to inherent elastance in the brain substance and use the known relationships between pressure and flow to derive noninvasive
estimates of intracranial pressure. We have also observed this discrepancy, which can be expressed as the difference between the scaled measurements of jugular venous outflow and the estimate (I2) provided by the model (Fig 5B). The shape and timing of this waveform are identical to that described by Al-perin et al24(Fig 5), though the measured peak-to-peak values in this study are slightly larger than the values they described in Fig 5.A, Comparison of the predicted venous outflow (I2) and the combined STS and SSS venous outflow (Ven). The venous outflow has been scaled to have the same integral as I2. The lower curve shows the difference in the waveforms. Note the prominent systolic peak in the difference.
B, Comparison of the predicted venous outflow (I2) and the jugular venous outflow (JV). The venous outflow has been scaled to have the same integral as I2. The lower curve shows the difference in the waveforms.
Fig 6.Mean and 95% confidence intervals for flow at each of 16 heart phases for the predicted venous outflow (I2) and the combined STS and SSS venous outflow (Ven). Asterisks indicate significant differences (ⴱ,P⬍.05;ⴱⴱ,P⬍.01).
[image:5.585.56.533.44.222.2]Fig 7.Mean and 95% confidence intervals for flow at each of 16 heart phases for the predicted venous outflow (I2) and the jugular venous outflow. Asterisks indicate significant differences (ⴱ,P⬍.05).
Table 2: The estimated relative values for parameters R1–R5 and C1–C4 (Fig. 2) together with their approximate physiologic characteristics
Parameter Physical Interpretation Value SE
R1 Impedance of arterial capillaries 1.0 0.0025
R2 Impedance of cerebral aqueduct ⬇0.0
R3 Impedance of venous capillaries ⬇0.0
R5 Impedance of arteries 0.01 8⫻1.8⫺3
C1 Elastic capacitance of arteries ⬇Large
C2 Elastic capacitance of ventricles 4.11 0.11
C3 Elastic capacitance of capillaries ⬇0.0 5⫻10⫺3
[image:5.585.299.534.277.463.2] [image:5.585.53.286.277.464.2] [image:5.585.302.533.543.639.2]8 volunteers (3.8 mL/heartbeat change in intercranial volume versus 0.3–1.3 mL/heartbeat).
One potential shortcoming of the current study was the decision to measure flow patterns in the hindbrain circulation from the midportion of the basilar artery. This was done to ensure that the measured waveform was truly characteristic of the intracranial arterial tree, which may differ from that seen in the vertebral arteries. It was expected to lead to a systematic underestimation of the arterial blood flow volume, which was indeed evident in the comparisons of prosencephalic arterial and venous flow volume, where CAB was almost equivalent to Ven in some subjects. It may also underlie the minor differ-ences in intracranial volume change described above. In prac-tice, this can easily be corrected using the volume measure-ments from the vertebral arteries to scale the waveform from the basilar artery for use in the model.
Although the current study represents a validation of a sim-plified model in healthy subjects, it is clearly appropriate for the study of diseases in which the principal abnormalities lie in the arterial inflow waveform (such as hypertension, elevated pulse pressure), the arterial tree (such as arterial stenosis, vas-cular depression, vasvas-cular dementia, primary (idiopathic) in-tercranial hypertension [IICH]), or the compliance of the brain itself. The application of the model to these and similar disorders is likely to improve our understanding of the patho-logic mechanisms involved through its ability to support sta-tistical intergroup comparisons of physiologic variables that are currently not measurable (arterial compliance, brain com-pliance, ventricular comcom-pliance, overall venous comcom-pliance, arterial impedance, brain impedance, and the impedance of the cerebral aqueduct). However, although the model could be applied to the characterization and study of other disorders, such as venoocclusive diseases, it is unlikely to provide the desirable level of granularity to explore the underlying ana-tomic and physiologic mechanisms involved. There is there-fore a need for further extension of the model to support such studies. Explicit modeling of the contributions of the supra-tentorial and infrasupra-tentorial compartments is likely to be rela-tively straightforward as variations in the waveforms of the major supratentorial dural venous sinuses are directly mea-surable. The addition of a measurement of CSF flux through the incisura is straightforward, though the fourth ventricular outflow may have multiple outflow pathways. More impor-tantly, it is possible to measure pulsatile venous flow at other sites in the venous system, including the straight sinus, sig-moid, and transverse sinuses, extracerebral jugular vein and major superficial cortical veins such as the Great Vein of Labbe, which represent the principal collateral venous flow mechanism from the prosencephalic cortex. The use of these measurements may support extension of the model to allow differentiation of the pressure effects on deep cerebral, super-ficial cortical, and dural veins, which have been proposed as etiologic factors in various disorders.2,4-7
Conclusion
We have described a simplified anatomic model of Monro-Kellie homeostasis and presented an electrical equivalence model that allows derivation of values corresponding approx-imately to arterial, brain, ventricular, and venous compliance
and arterial, brain, and cerebral aqueduct impedance. We have validated the model by showing its ability to predict jugular venous waveform in healthy subjects and have identified a number of potential applications in which the use of the model can be expected to improve our ability to understand the mode of failure of the homeostatic mechanism.
Appendix
This section describes the derivation of a minimal descriptive model for the circuit shown in Fig 2Band the fitting approach used to estimate individual parameters. The application of the Kirchoff laws leads to
Vertex Currents
1) I1⫽I5⫹I6
2) I8⫽I9⫹I2
3) I6⫽I3⫹I7⫹I8
4) I4⫽I5⫹I3⫹I7⫹I9
Voltage Loops
5) I5R5⫹I5jC11 ⫺I3R2⫺I3jC21 ⫺I6R1⫽0
6) I7 1
jC3⫺ I9 1
jC4⫺
I8R3⫽0
7) I3jC21 ⫹I3R2⫺I7jC31 ⫽0
Point-to-Point Voltages
8) V2⫺V1⫽I6R1⫹I8R3⫹I2R4
9) V3⫺V1⫽I6R1⫹I3 1
jC2⫹
I3R2⫹I4 1 jC5
In these equations,is frequency and j is⫺1. We have intro-duced 5 new current variables (I5toI9), and we have 9 equa-tions, leaving 6 degrees of freedom. The point-to-point volt-ages require the equivalent of pressure measurements in the biologic system.
After eliminating unwanted variables, and by using the no-tational conventionDn⫽1/jCn, we have obtained 3 impor-tant equations to note: the Monro-Kellie Principle (eq. 10), which is simply a statement of volume preservation; the con-straint equation (eq. 11) relating currents, which does not containI1,C5, orR4; and eq. 12, which scales the variables using mean potentials.
The Monro-Kellie Principle:
10) I1⫽I2⫹I4
Constraint equation relating currents (flows):
11)
Using mean potentials (pressures) to scale variables:
12) ⬍V3⬎ ⫺ ⬍V1⬎ ⫽ ⬍I1⬎R1
Parameter Estimation
A likelihood-based approach was adopted to estimate the pa-rameters of the model. We can build a suitable likelihood function from eq. 11. Substituting eq. 10 and reorganizing terms, we obtain an equation of the form
13) ␥I3⫺␣I1⫹I4⫽0
We can now make corrections to the flow variables⌬In to enforce the constraint equations, in a way that minimizes the change in the measurements consistent with the measurement errors
14) 2⫽
冘
⌬I*I⌬I1/1 2⫹⌬
I*3⌬I3/32⫹⌬I*4⌬I4/42.
Acknowledgments
We thank Dr. Marietta Scott for helpful comments and Barry Whitnall for his role in scanning and collecting MR data.
References
1. Cushing H.The third circulation in studies in intracranial physiology and surgery. London: Oxford University Press; 1926:1–51
2. Bateman GA.Vascular compliance in normal pressure hydrocephalus.AJNR Am J Neuroradiol2000;21:1574 – 85
3. Greitz D.Radiological assessment of hydrocephalus: new theories and impli-cations for therapy.Neurosurg Rev2004;27:145– 65
4. Bateman GA.Pulse-wave encephalopathy: a comparative study of the hydro-dynamics of leukoaraiosis and normal-pressure hydrocephalus. Neuroradiol-ogy2002;44:740 – 48
5. Bateman GA.Vascular hydraulics associated with idiopathic and secondary intracranial hypertension.AJNR Am J Neuroradiol2002;23:1180 – 86 6. Bateman GA.The reversibility of reduced cortical vein compliance in
normal-pressure hydrocephalus following shunt insertion. Neuroradiology
2003;45:65–70
7. Bateman GA.Pulse wave encephalopathy: a spectrum hypothesis incorporat-ing Alzheimer’s disease, vascular dementia and normal pressure hydroceph-alus.Med Hypotheses2004;62:182– 87
8. Bennett DA, McDermott MP.Cerebrospinal fluid shunting for Alzheimer’s disease?Neurology2002;59:1126 –27
9. Greitz D, Greitz T, Hindmarsh T.A new view on the CSF-circulation with the potential for pharmacological treatment of childhood hydrocephalus.Acta Paediatr1997;86:125–32
10. Greitz D, Hannerz J, Rahn T, et al.MR imaging of cerebrospinal fluid dynamics in health and disease. On the vascular pathogenesis of communicating hydro-cephalus and benign intracranial hypertension.Acta Radiol1994;35:204 –11 11. Baledent O, Henry-Feugeas MC, Idy-Peretti I.Cerebrospinal fluid dynamics
and relation with blood flow: a magnetic resonance study with semiauto-mated cerebrospinal fluid segmentation.Invest Radiol2001;36:368 –77 12. Beards SC, Yule S, Kassner A, et al.Anatomical variation of cerebral venous
drainage: the theoretical effect on jugular bulb blood samples.Anaesthesia
1998;53:627–33
13. Miyati T, Mase M, Banno T, et al.Frequency analyses of CSF flow on cine MRI in normal pressure hydrocephalus.Eur Radiol2003;13:1019 –24
14. Joseph VB, Raghuram L, Korah IP, et al.MR ventriculography for the study of CSF flow.AJNR Am J Neuroradiol2003;24:373– 81
15. Strik C, Klose U, Erb M, et al.Intracranial oscillations of cerebrospinal fluid and blood flows: analysis with magnetic resonance imaging.J Magn Reson Imaging2002;15:251–58
16. Kim J, Bromiley PA, Thacker NA.A complexity analysis for normal cerebral blood and CSF flow.In:Medical Image Understanding and Analysis.Bristol, UK: British Machine Vision Association; 2005
17. Kim J, Thacker NA, Bromiley PA, et al.An electrical equivalence model for CSF pulsatility. In:BIOSIGNAL 2004.Brno, Czech Republic: Vitium Press; 2004. 18. Gideon P, Thomsen C, Gjerris F, et al.Measurement of blood flow in the
supe-rior sagittal sinus in healthy volunteers, and in patients with normal pressure hydrocephalus and idiopathic intracranial hypertension with phase-contrast cine MR imaging.Acta Radiol1996;37:171–76
19. Stolz E, Kaps M, Kern A, et al.Transcranial color-coded duplex sonography of intracranial veins and sinuses in adults. Reference data from 130 volunteers.
Stroke1999;30:1070 –75
20. Mathew NT, Meyer JS, Ott EO.Increased cerebral blood volume in benign intracranial hypertension.Neurology1975;25:646 – 49
21. Naish JH, Baldwin RC, Patankar T, et al.Abnormalities of CSF flow patterns in the cerebral aqueduct in treatment-resistant late-life depression: a potential biomarker of microvascular angiopathy.Magn Reson Med2006;56:509 –16. 22. Ursino M, Lodi CA.A simple mathematical model of the interaction between
intracranial pressure and cerebral hemodynamics. J Appl Physiol
1997;82:1256 – 69