ORIGINAL RESEARCH
Reversed Discrepancy between CT and
Diffusion-Weighted MR Imaging in Acute Ischemic Stroke
E.Y. Kim J.W. Ryoo H.G. Roh K.H. Lee S.S. Kim I.C. Song K.-H. Chang D.G. Na
PURPOSE:We sought to determine whether an early CT ischemic lesion showing parenchymal hypoattenuation might be undetectable on diffusion-weighted imaging (DWI) in acute cerebral ischemia.
MATERIALS AND METHODS: We retrospectively evaluated CT and MR images of 70 consecutive patients with acute middle cerebral artery (MCA) infarction. All patients underwent CT and MR imaging within 6 hours of symptom onset. We determined the presence of reversed discrepancy (RD), defined as an early ischemic lesion showing parenchymal hypoattenuation on CT but no hyperintensity on DWI. CT Hounsfield units (HU), apparent diffusion coefficients (ADCs), and perfusion parameters were calculated for RD lesions.
RESULTS: RD was found in 9 (12.9%) patients and at basal ganglia (89%). The mean HU of RD lesion was lower than that of normal tissue (⌬HU,2.33⫾0.74,P⬍.001). RD lesions showed no significant decrease of ADC (ADC ratio, 0.97⫾0.07,P⫽.059) and cerebral blood flow (relative CBF, 0.87⫾0.20, P⬎0.05). Delayed DWI hyperintensity occurred in 8 (88.8%) RD lesions, and all lesions progressed to infarction. In 6 (66%) of 9 patients with RD, Alberto Stroke Program Early CT scores of ischemic lesions were lower on CT than those on DWI.
CONCLUSION:RD was uncommonly found mainly in basal ganglia, and all RD lesions progressed to infarction at follow-up. Early CT ischemic lesion showing parenchymal hypoattenuation may be undetectable on DWI, and DWI may underestimate extent of severe ischemic tissue in patients with acute MCA infarction.
I
n patients with acute ischemic stroke, early ischemic changes on CT include parenchymal hypoattenuation, loss of gray-white matter distinction, and brain swelling with sul-cal effacement.1-4Although the significance of early ischemic changes remains controversial within 3 hours after symptom onset,4,5patients showing large parenchymal hypoattenuation have a high risk of symptomatic hemorrhage after tissue plas-minogen activator (tPA) treatment.3An early CT ischemic lesion showing hypoattenuation indicates severe ischemic edema, critical hypoperfusion, and irreversible ischemic injury.6,7Recent MR imaging studies8-11have suggested that MR im-aging has the potential to be the first imim-aging method for mak-ing a decision of thrombolytic therapy in acute ischemic stroke. Diffusion-weighted imaging (DWI)– hyperintense le-sions, though rarely permanently reversible, usually represent ischemic tissue that will progress to infarction.12-14In most cases of acute cerebral ischemia, the size of a hyperintense lesion on DWI is similar to or larger than that on CT, and there is a correlation of lesion size between CT and DWI.15,16 How-ever, little documentation is available on a finding of reversed discrepancy (RD) between CT and DWI in acute cerebral ischemia.16,17
This study was performed to determine whether an early CT ischemic change of parenchymal hypoattenuation may be undetectable on DWI, and to determine whether the extent of
severe ischemic tissue may be underestimated on DWI in pa-tients with untreated acute middle cerebral artery (MCA) infarction.
Materials and Methods
Patients
Between May 1997 and June 2004, 215 consecutive patients who pre-sented with acute MCA infarct and a National Institutes of Health Stroke Scale (NIHSS) score of more than 3 underwent CT within 6 hours of symptom onset. MR imaging was performed after CT on the same day in 210 patients. Of these 210, we retrospectively included 70 patients (40 men and 30 women; mean age, 70 years) who underwent MR imaging within 6 hours of symptom onset and who did not un-dergo thrombolytic therapy.
CT and MR Imaging
All CT scans were obtained using a helical CT scanner or multidector CT (Hi-Speed Advantage or LightSpeed Ultra; GE Medical Systems, Milwaukee, Wis). The scanning parameters of the unenhanced CT were 120 kV and 240 or 300 mAs with a 512⫻512 image matrix, 23-or 24-cm field of view, and a 5-mm section thickness. Maximal inten-sity projection CT angiography (CTA) was obtained from enhanced CT source data obtained according to a protocol of multiphasic per-fusion CT.16
MR imaging was performed using a 1.5T unit (GE Medical Sys-tems) with echo-planar imaging (EPI) sequences, including diffu-sion- and perfudiffu-sion-weighted imaging (DWI/PWI). The typical stroke MR imaging protocol consisted of DWI, PWI, T2* gradient-echo, gadolinium-enhanced T1-weighted imaging, and 3D time-of-flight MR angiography (MRA). Imaging parameters of DWI were as follows: repetition time (TR), 6500 –10,000 ms; echo time (TE), 71.7– 96.8 ms; matrix, 128⫻128; 3 directions; field of view (FOV), 24 or 28 cm; section thickness, 5 mm; and intersection gap, 2 mm. DWI was
Received September 26, 2005; accepted after revision January 19, 2006.
From the Departments of Radiology (E.Y.K., J.W.R., H.G.R., S.S.K.) and Neurology (K.H.L.), Samsung Medical Center, Sungkyunkwan University School of Medicine, Seoul, Korea; Department of Radiology (I.C.S., K.-H.C., D.G.N.), Seoul National University College of Medicine, Seoul, Korea; and Department of Radiology (E.Y.K.), Research Institute of Radiologic Science, Yonsei University College of Medicine, Seoul, Korea.
obtained withbvalues of 0 and 1000 s/mm2. PWI was performed with gradient-echo, echo-planar sequences with following parameters: TR, 2000 ms; TE, 60 ms; flip angle, 90°; matrix, 128⫻128, FOV, 24 cm; section thickness, 5 mm; and intersection gap, 2 mm. A series of images (8 –10 sections, 40 –50 images per section) was obtained be-fore, during, and after administration of the contrast agent. Perfusion maps of relative cerebral blood volume (rCBV), time-to-peak (TTP), and relative cerebral blood flow (rCBF) were generated after eliminat-ing the recirculation of contrast agent by␥-variate curve fitting. The rCBF map was obtained via the singular value decomposition decon-volution method.18,19
Determination of Reversed Discrepancy, Extent of Ischemic Lesion and Arterial Occlusion
In a retrospective manner, 2 neuroradiologists (D.G.N. and E.Y.K.) independently reviewed CT and DWI and determined the presence of RD. Disagreements were decided by consensus. The interpreters were unaware of initial MRAs, follow-up images, and clinical information except for information of affected hemisphere. The lesion exhibiting RD was defined as an early ischemic lesion that showed parenchymal hypoattenuation or loss of gray and white matter distinction on CT but no obvious hyperintensity on DWI. RD was determined when the extent of the RD was equivalent to an Alberta Stroke Program Early CT Score (ASPECTS)20of at least 1 in the affected MCA territory. In all patients with RD, the extent of ischemic lesion was assessed using ASPECTS by parenchymal hypoattenuation on CT and by parenchy-mal hyperintensity on DWI. For determining ASPECTS, CT or DWI was reviewed independently of each image at a separate session. The 2 interpreters evaluated initial CTAs, initial MRAs, and follow-up (day 1) MRAs by consensus to determine arterial occlusion and presence of arterial recanalization, and recanalization rate of arterial occlusions at day 1 was compared between the patients with and without RD.
Quantitative Measurement of Reversed Discrepancy Lesions
In all patients with RD, initial and follow-up MR imaging, including DWI, PWI, and MRA, were successfully obtained 1 day after the initial MR imaging except for 1 patient (patient 4) in whom the initial PWI was not optimally obtained because of poor contrast enhancement. The PWI data from the patient 4 was not used in the analysis.
CT Hounsfield units (HU), ADC, DWI signal intensity, T2 signal intensity, TTP, rCBV, and rCBF values were measured by the final 3 regions of interest (ROIs) of RD lesion (only CT positive), DWI lesion 1 (both CT and DWI positive), and DWI lesion 2 (only DWI positive). All DWI and PWI images were spatially coregistered to the first volume of CT scans or EPI T2-weighted images (DWIb⫽0) to superimpose the ROIs delineated on CT images using SPM2 (Well-come Department of Cognitive Neuroscience). The 2 neuroradiolig-sts manually drew ROIs by consensus along the margins of the hy-poattenuated lesions on CT and then drew ROIs along the margins of the hyperintense lesions on DWI in all patients with RD (Fig 1). Each ROI made on CT was superimposed on the same DWI images, which allowed us to make an ROI only for a lesion with RD (ROIRD) and ROIs for the whole DWI lesions (ROIDW), DWI lesion 1 (ROIDW1), and DWI lesion 2 (ROIDW2). The final 3 ROIs of RD lesion (ROIRD), DWI lesion 1(ROIDW1), and DWI lesion 2 (ROIDW2) were transferred to the corresponding coregistered images of the initial CT, DWI, and PWI maps including TTP, rCBV, and rCBF. For comparison, mirror ROIs were drawn on the contralateral hemisphere. The size of ROI ranged from 1.2 to 30.4 cm2. The ADC values were thresholded at
1200⫻10⫺6mm2/s to minimize partial volume effect with CSF. The same quantitative measurements using ROIs were performed for fol-low-up MR imaging obtained at day 1 in patients with RD.
Clinical Data Analysis
A stroke neurologist assessed baseline, acute (days 1 and 7), and chronic (day 90) clinical data using the modified Rankin Score (mRS), and then compared for patients with and without RD. The incidence of spontaneous rapid clinical improvement (NIHSS score more than 3) within a few hours after stroke was assessed and com-pared for 2 subgroup patients. Time duration from onset to CT or MR imaging and the time interval between CT and MR imaging were compared between the 2 groups. The incidence of RD was compared between the patients who underwent MR imaging within 3 hours after symptom onset and those who underwent imaging at 3 to 6 hours. Hemorrhagic transformation was determined on T2* gradi-ent-echo images at day 1.
Statistical Analysis
Statistical analysis was performed using commercial software (SPSS-PC, version 10.0; SPSS, Chicago, Ill). Comparisons of mean values for CT attenuation, ADC, DWI signal intensity, TTP, CBV, and CBF between lesions and contralateral hemispheres, and mean values for CT attenuation, ADC, ADC ratio, DWI signal intensity ratio, TTP delay, rCBV, and rCBF between lesions with RD and DWI lesions were compared with the use of a pairedttest. When variables were non-normally distributed, comparisons were performed with the use of the Wilcoxon signed-rank test. Comparisons of clinical scores be-tween the 2 subgroup patients with and without RD were performed with the use of the Studentttest. The2test or Fisher exact test was used to compare recanalization rates of arterial occlusions at day 1 and the incidence of rapid clinical improvement between patients with and without RD. APvalue of⬍0.05 was considered statistically significant. Two observers independently determined ASPECT scores on both CT and DWI. Each observer determined the presence of RD when the case showed discrepancy in the areas of ASPECT score be-tween CT and DWI. For the presence or absence of RD, interobserver agreement was evaluated withagreement index.
Results
Demographic Data of Patients with Reversed Discrepancy
RD was found in 9 (12.9%) of 70 patients and located at basal ganglia in 8 (88.8%) of 9 patients with RD. Thevalue for the presence of RD was 0.97. In all patients with RD, DWI hyper-intense lesions were also present. Table 1 shows the demo-graphic data of 9 patients (5 men and 4 women; mean age, 72⫾12 years). The mean time to CT and MR imaging was 2.5⫾1.3 and 4.1⫾1.4 hours, respectively, after symptom onset, and mean time interval between initial CT and MR imaging was 1.6⫾0.9 hours. A second follow-up CT or MR imaging was performed in 8 patients within 8 days (mean, 5.5⫾2.4 days). No second follow-up imaging was performed in 1 patient (patient 4). In 4 patients, additional follow-up CT or MR images were obtained 3 to 11 months after the initial CT.
Extent of Ischemic Lesion and Arterial Occlusion
In 6 (66%) of the 9 patients with RD, ASPECTS of early isch-emic lesion showing hypoattenuation on CT were lower than
BRAIN
ORIGINAL
those on DWI, and mean ASPECTS of 9 patients with RD was significantly lower on CT than those assessed on DWI (4.6⫾ 2.5 and 6.0⫾2.1, respectively,P⫽.023). CTA was obtained in 8 of 9 patients with RD. CTA showed occlusion of M1 in only 3 patients and patent M1 segment in the other 4 of the 7 pa-tients who had RD in basal ganglia. In 1 patient with RD in the frontal cortex, there was no arterial occlusion at CTA.
In 5 (56%) patients with RD, initial MRA vascular territory on the affected side was smaller than that of CT ischemic lesion (ie, mismatch). Follow-up MRA 1 day after the initial MRA demonstrated recanalization of arterial occlusions in 4 (50%) of 8 patients with RD who had arterial occlusions on the initial MRA. In 29 patients without RD who underwent both initial and follow-up MRA at day 1 and had arterial occlusions on the initial MRA, recanalization was observed in 7 patients on MRA at day 1. The recanalization rate of arterial occlusions at
day 1 was higher in the patients with RD than in those without RD, but without significance (50% and 24%, respectively,P⬎ .05).
Quantitative Measurement of Lesions Showing Reversed Discrepancy
Table 2 demonstrates mean values of CT HU, DWI, and PWI in lesions with RD on initial CT and MR imaging. The CT HU and TTP of RD lesion was significant different from contralat-eral control values (P⬍.001, respectively), but ADC and other MR imaging parameters of RD lesions were not different from control values. The mean CT HU of RD lesion was not signif-icantly different from those of DWI lesion 1 (P⬎.05), but it was lower than that of DWI lesion 2 (P⬍.001). The mean ADC, ADC ratio, and DW signal intensity ratios of RD lesions were significantly different from those of DWI lesion 1 or 2 Fig 1.Patient 7.A, ROIs for parenchymal hypoattenuation and DWI hyperintensity were placed manually on unenhanced CT and DWI (TR, 10,000 ms; TE, 71.7 ms). The 2 ROIs for CT lesion and DWI hyperintensity provide an ROI for the lesion with reversed discrepancy showing CT parenchymal hypoattenuation and no obvious DWI hyperintensity.
B, Initial unenhanced CT shows subtle hypoattenuation of lentiform nucleus, caudate, and insula in the left MCA territory (white arrows). A hyperattenuated artery sign of the left inferior M2 branch (black arrow) is also seen. Maximum intensity projection CT angiography (CTA) shows occlusion of the left inferior M2 (arrow). DWI shows hyperintense lesions in the left temporal lobe and posterior insula, but DWI hyperintensity seems very subtle and not obvious in basal ganglia and is not seen in most areas of insula. ADC map shows cytotoxic edema in the left temporal lobe. Perfusion maps show an increased TTP delay and decreased rCBF only in the left temporal lobe, and no obvious perfusion abnormality is seen in the left basal ganglia. Initial MRA shows occlusion of the left inferior M2 (arrow).
C, Follow-up MR images at day 1 show delayed DWI hyperintensity and decreased ADC in the left basal ganglia (arrow). Perfusion maps and MRA demonstrate reperfusion in the left MCA territory and recanalization of the left M2 occlusion.
[image:3.585.53.536.42.398.2](P⬍.001). The mean TTP and rCBF values of RD lesions were less delayed and higher than those of DWI lesion 1 or 2 (P⬍ 0.001, respectively). The mean rCBV value between RD lesion and DWI lesion 1 or 2 was not significantly different (P⬎.05). Table 2 shows changes in mean ADC, DWI signal intensity, and T2 signal intensity values observed at the day-1 follow-up. For RD or DWI lesions, mean ADC values were significantly lower at follow-up than those at the initial DWI (P⬍.001), and DWI and T2 signal intensities were higher than those at the initial DWI (P⬍.001). T2 signal intensities of RD lesions were significantly lower than those of DWI lesion (P⬍0.001) at the day-1 follow-up. The mean ADC value and DWI signal intensity of RD lesions were significantly different from those of DWI lesion (P⫽.037 andP⬍.001, respectively) at follow-up. The day 1 follow-up DWI demonstrated delayed
hyperin-tensity of RD lesions in 8 (88.8%) of the 9 patients. In these 8 patients (except for 1 patient without a second follow-up im-age), all RD lesions progressed to overt infarctions at second follow-up. In 1 patient who had no delayed DWI hyperinten-sity at RD lesion at day 1, RD lesion progressed to infarction at the second follow-up. RD lesions converted to atrophy (n⫽2) (Fig 1) or pan-necrosis (n⫽2) (Fig 2) in 4 patients who un-derwent long-term follow-up CT or MR. The total area of CT hypoattenuation lesions and area of RD lesions was 500.25 and 128.47 cm2, respectively. The area of RD lesion was present in 25.7% of total area of CT ischemic lesion in 9 patients with RD.
Clinical Data Analysis
[image:4.585.55.538.46.309.2]No significant difference was observed in the baseline NIHSS scores (15.4⫾4.5 and 13.6⫾5.4), 24-hour NIHSS scores Table 1: Clinical data of 9 patients with reversed discrepancy (RD)
Patient No./ Age (y)/Sex
Time to CT (h)
Time to MRA (h)
Arterior Occlusion on Initial MRA
ASPECTS
Location of RD
MR Findings at Day 1 Follow-up NIHSS
mRS at Day 90 CT DWI
Recanalization on MRA
Delayed DWI Hyperintensity
of RD lesion Initial Day 1
1/F/75 2.1 4.3 ICA 3 5 Left BG Absent Present 21 22 4 2/M/86 4.0 5.8 ICA 3 5 Right BG Absent Present 14 15 4 3/M/64 5.3 5.8 ICA 8 8 Left BG Absent Present 6 6 1 4/M/76 1.7 4.3 M1 4 3 Right BG Present Present 15 17 6 5/F/84 0.9 2.3 M1 1 5 Right BG Absent Absent 12 11 4 6/F/80 1.8 2.5 M2 7 9 Right BG Present Present 8 13 5 7/F/60 2.3 3.3 M2 7 7 Left BG Present Present 9 9 2 8/M/74 2.5 5.3 MCA distal branch, A2 6 8 Left insula,
frontal lobe
Present Present 18 16 3
9/M/50 2.2 4.0 * 2 4 Right BG No occlusion Present 13 8 2
Note:—CT indicates computed tomography; MRA, magnetic resonance angiography; DWI, diffusion-weighted MR imaging; ASPECTS, Alberta Stroke Program early CT score; mRS, modified Rankin Scale; ICA, internal carotid artery; MCA, middle cerebral artery; BG, basal ganglia.
* Site of arterial occlusion was not accurately determined due to poor image quality of MRA.
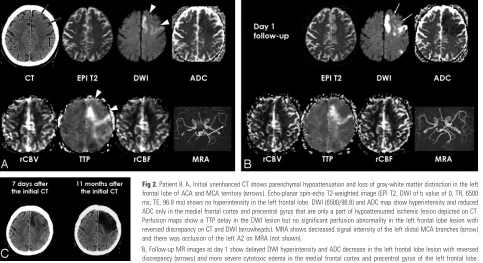
Fig 2.Patient 8.A, Initial unenhanced CT shows parenchymal hypoattenuation and loss of gray-white matter distinction in the left frontal lobe of ACA and MCA territory (arrows). Echo-planar spin-echo T2-weighted image (EPI T2, DWI ofbvalue of 0, TR, 6500 ms; TE, 96.8 ms) shows no hyperintensity in the left frontal lobe. DWI (6500/96.8) and ADC map show hyperintensity and reduced ADC only in the medial frontal cortex and precentral gyrus that are only a part of hypoattenuated ischemic lesion depicted on CT. Perfusion maps show a TTP delay in the DWI lesion but no significant perfusion abnormality in the left frontal lobe lesion with reversed discrepancy on CT and DWI (arrowheads). MRA shows decreased signal intensity of the left distal MCA branches (arrow) and there was occlusion of the left A2 on MRA (not shown).
B, Follow-up MR images at day 1 show delayed DWI hyperintensity and ADC decrease in the left frontal lobe lesion with reversed discrepancy (arrows) and more severe cytotoxic edema in the medial frontal cortex and precentral gyrus of the left frontal lobe. Follow-up MRA shows recanalization of distal MCA branches but persistent perfusion abnormality in the ischemic lesion found on the initial DWI.
[image:4.585.52.539.356.518.2](13.7⫾5.4 and 10.1⫾6.2), or the chronic mRS (3.4⫾1.6 and 2.8⫾1.7) between those with and without RD on initial CT and DWI (P⬎.05). Spontaneous rapid clinical improvement was found in 3 (30%) patients with RD and 2 (3%) of patients without RD (P⫽.013). No significant difference was observed in terms of duration from symptom onset to CT and MR im-aging (2.5⫾1.3 versus 2.4⫾1.2 and 4.1⫾1.4 versus 3.8⫾ 1.3,P⬎.05) or in terms of the time interval between CT and MR imaging (1.6⫾0.9 and 1.4⫾0.8,P⬎.05). No difference in the incidence of RD was found according to the time be-tween onset and MR imaging, ie, 3 hours (13.0%, 3 of 23) and 3 to 6 hours after symptom onset (12.8%, 6 of 47) (P⬎.05). In 1 of 9 patients with RD, hemorrhagic transformation was ob-served in an RD lesion on T2* gradient-echo images at day-1 follow-up.
Discussion
Our study demonstrates that the early CT sign of parenchymal hypoattenuation may be undetectable on DWI in patients with acute cerebral ischemia. In 12.9% of patients with acute stroke who did not undergo thrombolytic therapy, portions of acutely ischemic brain tissue showed hypoattenuation on CT but appeared normal on DWI images obtained immediately afterward.
CT attenuation is linearly proportional to tissue water con-tent,21and an early CT sign of parenchymal hypoattenuation develops under the severe CBF decrease because early isch-emic edema accompanying uptake of tissue water develops under CBF less than 10 –15 mL/g/min.22Meanwhile, the CBF threshold for an ADC decrease is higher than that of CT, and an ADC decrease occurs before CBF declines at the critical threshold for energy failure.23,24The presence of RD between CT and DWI contradicts the general concept of higher sensi-tivity of DWI for early ischemic tissue and the natures of the correlations between CT attenuation and ADC or CBF.25,26
What, then, is the pathophysiology of RD? The results of the present study suggest that RD may be related to early spon-taneous reperfusion, which is supported by the mismatch be-tween the site of arterial occlusion and vascular territory for an RD lesion, very mildly reduced to normal CBF in an RD lesion, and higher incidence of rapid clinical improvement. However, it is unclear why a hypoattenuated RD lesion has a normal ADC. The normal ADC of RD lesion might be explained by the
transient normalization of ADC because of reperfusion, as has been reported in previous studies.14,27-29 Pseudonormaliza-tion of ADC has been shown with previous animal and human studies after early reperfusion.13,27-29A number of theories attempt to explain this phenomenon, but the exact cause is unknown. As for the explanation of early ADC renormaliza-tion, transient recovery from histologic cellular change by early ischemia or water influx by reperfusion seems less likely because ADC renormalization is not associated with a reversal of astrocytic swelling or neuronal shrinkage, and more severe ischemic tissue resulting in blood-brain barrier breakdown has no ADC reversibility according to animal studies.27,28The finding of RD might give us a message similar to that of an animal study,28which showed a discrepancy between histo-logic finding of persistent cytotoxic edema and reperfusion-induced ADC renormalization. A theory of transient recovery of energy metabolism suggested for explaining transient ADC normalization29might be also a possible explanation for RD that CT hypoattenuation as a result of continuation of isch-emic edema may coexist with transient normalization of ADC after early reperfusion. Nevertheless, it remains to be deter-mined whether transient energy metabolism recovery can oc-cur in ischemic tissue showing hypoattenuation on CT.
Although ADC decrease of ischemic tissue is related to cy-totoxic edema and energy failure,27,30the exact mechanism of ADC decrease remains unclear.27,31However, the finding of RD evidently indicates that a decrease of CT attenuation has a pathophysiology different from that of an ADC decrease in acute cerebral ischemia The mechanism of CT hypoattenua-tion in early ischemic tissue may be complex. It may be due to a combination of increase in tissue water and low CBV.32 However, our data do not support the concept that low CBV is a direct major cause of CT signs of parenchymal hypoattenu-ation because our data showed lack of CBV decrease in RD lesion and presence of CT hypoattenuation without a con-comitant arterial occlusion in some cases.
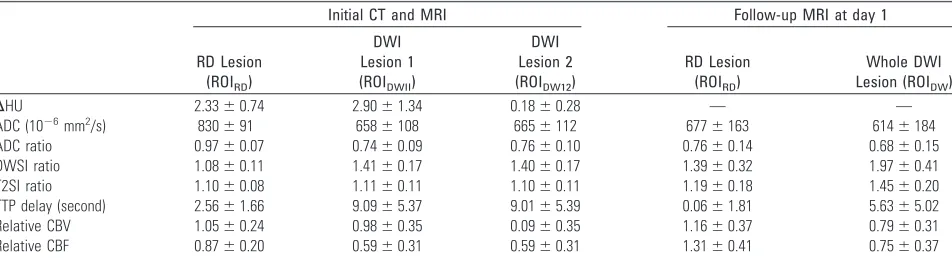
[image:5.585.56.532.57.186.2]Although patients with RD showed higher incidence of rapid clinical improvement, there was no significant associa-tion with a better clinical outcome or significantly higher in-cidence of spontaneous arterial recanalization than those without RD. Further study is required to determine whether early reperfusion may reduce the degree of tissue damage or Table 2: Mean values of computed tomographic (CT) attenuation, apparent diffusion coefficient (ADC), diffusion-weighted MR imaging (DWI)*
Initial CT and MRI Follow-up MRI at day 1
RD Lesion (ROIRD)
DWI Lesion 1 (ROIDWII)
DWI Lesion 2 (ROIDW12)
RD Lesion (ROIRD)
Whole DWI Lesion (ROIDW)
⌬HU 2.33⫾0.74 2.90⫾1.34 0.18⫾0.28 — —
ADC (10⫺6mm2/s) 830⫾91 658⫾108 665⫾112 677⫾163 614⫾184
ADC ratio 0.97⫾0.07 0.74⫾0.09 0.76⫾0.10 0.76⫾0.14 0.68⫾0.15 DWSI ratio 1.08⫾0.11 1.41⫾0.17 1.40⫾0.17 1.39⫾0.32 1.97⫾0.41 T2SI ratio 1.10⫾0.08 1.11⫾0.11 1.10⫾0.11 1.19⫾0.18 1.45⫾0.20 TTP delay (second) 2.56⫾1.66 9.09⫾5.37 9.01⫾5.39 0.06⫾1.81 5.63⫾5.02 Relative CBV 1.05⫾0.24 0.98⫾0.35 0.09⫾0.35 1.16⫾0.37 0.79⫾0.31 Relative CBF 0.87⫾0.20 0.59⫾0.31 0.59⫾0.31 1.31⫾0.41 0.75⫾0.37
Note:—Values are expressed as mean⫾SD. ROI indicates region of interest;⌬HU indicates the difference between the Hounsfield unit of the lesion and the control; relative cerebral blood volume (CBV) or cerebral blood flow (CBF) indicates the ratio of lesion value to that of contralateral hemisphere; DWSI, signal intensity on diffusion-weighted MR image; T2SI, signal intensity on T2-weighted image.
functional injury in ischemic tissue showing CT hypoattenuation.
Our study demonstrates that severe ischemic tissue show-ing CT hypoattenuation could be missed in patients with un-treated hyperacute ischemic stroke even within 3 hours of on-set. Although DWI is usually more accurate, reliable, and sensitive for early ischemic tissue than CT, it may be less sen-sitive for depicting severe ischemic tissue than CT in some patients if spontaneous early reperfusion occured within the severe ischemic tissue. If one obtains only MR imaging in acute stroke patients, ischemic lesions that are not visualized on DWI but are destined to infarct may be present. Therefore, although the utility of DWI for decision-making for thrombo-lytic therapy is probably widely accepted, it should be recog-nized that the evaluation of the extent of severe ischemic tissue can be inaccurate by DWI, and caution should be exercised when determining eligibility for thrombolytic therapy based on the extent of ischemic tissue on DWI.
In conclusion, a finding of RD was uncommonly found in untreated patients with acute MCA infarction and its patho-physiology may be related to pseudonormalization of ADC by spontaneous early reperfusion in severe ischemic tissue. Se-vere ischemic tissue showing an early CT sign of parenchymal hypoattenuation may be undetectable on DWI and DWI may underestimate its extent in patients with untreated acute MCA infarction.
References
1. Hacke W, Kaste M, Fieschi C, et al.Intravenous thrombolysis with recombi-nant tissue plasminogen activator for acute hemispheric stroke. The Euro-pean Cooperative Acute Stroke Study (ECASS).JAMA1995;274:1017–25 2. Hacke W, Kaste M, Fieschi C, et al.Randomised double-blind
placebo-con-trolled trial of thrombolytic therapy with intravenous alteplase in acute isch-aemic stroke (ECASS II). Second European-Australasian Acute Stroke Study Investigators.Lancet1998;352:1245–51
3. von Kummer R, Allen KL, Holle R, et al.Acute stroke: usefulness of early CT findings before thrombolytic therapy.Radiology1997;205:327–33 4. Patel SC, Levine SR, Tilley BC, et al.Lack of clinical significance of early
isch-emic changes on computed tomography in acute stroke.JAMA2001;286: 2830 –38
5. Tanne D, Kasner SE, Demchuk AM, et al.Markers of increased risk of intrace-rebral hemorrhage after intravenous recombinant tissue plasminogen activa-tor therapy for acute ischemic stroke in clinical practice: the Multicenter rt-PA Stroke Survey.Circulation2002;105:1679 – 85
6. von Kummer R, Bourquain H, Bastianello S, et al.Early prediction of irrevers-ible brain damage after ischemic stroke at CT.Radiology2001;219:95–100 7. Grond M, von Kummer R, Sobesky J, et al.Early x-ray hypoattenuation of
brain parenchyma indicates extended critical hypoperfusion in acute stroke.
Stroke2000;31:133–39
8. Parsons MW, Barber PA, Chalk J, et al.Diffusion- and perfusion-weighted MRI response to thrombolysis in stroke.Ann Neurol2002;51:28 –37 9. Rother J, Schellinger PD, Gass A, et al.Effect of intravenous thrombolysis on
MRI parameters and functional outcome in acute stroke<6 hours.Stroke
2002;33:2438 – 45
10. Schellinger PD, Fiebach JB, Hacke W.Imaging-based decision making in
thrombolytic therapy for ischemic stroke: present status.Stroke2003;34: 575– 83
11. Fiebach JB, Schellinger PD, Jansen O, et al.CT and diffusion-weighted MR imaging in randomized order: diffusion-weighted imaging results in higher accuracy and lower interrater variability in the diagnosis of hyperacute isch-emic stroke.Stroke2002;33:2206 –10
12. Fiehler J, Foth M, Kucinski T, et al.Severe ADC decreases do not predict irre-versible tissue damage in humans.Stroke2002;33:79 – 86
13. Kidwell CS, Saver JL, Mattiello J, et al.Thrombolytic reversal of acute human cerebral ischemic injury shown by diffusion/perfusion magnetic resonance imaging.Ann Neurol2000;47:462– 69
14. Kidwell CS, Saver JL, Starkman S, et al.Late secondary ischemic injury in pa-tients receiving intraarterial thrombolysis.Ann Neurol2002;52:698 –703 15. Lansberg MG, Albers GW, Beaulieu C, et al.Comparison of diffusion-weighted
MRI and CT in acute stroke.Neurology2000;54:1557– 61
16. Na DG, Ryoo JW, Lee KH, et al.Multiphasic perfusion computed tomography in hyperacute ischemic stroke: comparison with diffusion and perfusion mag-netic resonance imaging.J Comput Assist Tomogr2003;27:194 –206 17. Jaillard A, Hommel M, Baird AE, et al.Significance of early CT signs in acute
stroke. A CT scan-diffusion MRI study.Cerebrovasc Dis2002;13:47–56 18. Ostergaard L, Weisskoff RM, Chesler DA, et al.High resolution measurement
of cerebral blood flow using intravascular tracer bolus passages. Part I: Math-ematical approach and statistical analysis.Magn Reson Med1996;36:715–25 19. Ostergaard L, Sorensen AG, Kwong KK, et al.High resolution measurement of
cerebral blood flow using intravascular tracer bolus passages. Part II: Exper-imental comparison and preliminary results.Magn Reson Med 1996;36: 726 –36
20. Barber PA, Demchuk AM, Zhang J, et al.Validity and reliability of a quantita-tive computed tomography score in predicting outcome of hyperacute stroke before thrombolytic therapy. ASPECTS Study Group. Alberta Stroke Pro-gramme Early CT Score.Lancet2000;355:1670 –74
21. Rieth KG, Fujiwara K, Di Chiro G, et al.Serial measurements of CT attenuation and specific gravity in experimental cerebral edema.Radiology1980;135: 343– 48
22. Schuier FJ, Hossmann KA.Experimental brain infarcts in cats. II. Ischemic brain edema.Stroke1980;11:593– 601
23. Kohno K, Hoehn-Berlage M, Mies G, et al.Relationship between diffusion-weighted MR images, cerebral blood flow, and energy state in experimental brain infarction.Magn Reson Imaging1995;13:73– 80
24. Lin W, Lee JM, Lee YZ, et al.Temporal relationship between apparent diffu-sion coefficient and absolute measurements of cerebral blood flow in acute stroke patients.Stroke2003;34:64 –70
25. Kucinski T, Vaterlein O, Glauche V, et al.Correlation of apparent diffusion coefficient and computed tomography density in acute ischemic stroke.Stroke
2002;33:1786 –91
26. Kucinski T, Majumder A, Knab R, et al.Cerebral perfusion impairment corre-lates with the decrease of CT density in acute ischaemic stroke.Neuroradiology
2004;46:716 –22
27. Neumann-Haefelin T, Kastrup A, de Crespigny A, et al.Serial MRI after tran-sient focal cerebral ischemia in rats: dynamics of tissue injury, blood-brain barrier damage, and edema formation.Stroke2000;31:1965–72; discussion 1972– 63
28. Li F, Liu KF, Silva MD, et al.Acute postischemic renormalization of the appar-ent diffusion coefficiappar-ent of water is not associated with reversal of astrocytic swelling and neuronal shrinkage in rats.AJNR Am J Neuroradiol2002;23: 180 – 88
29. Olah L, Wecker S, Hoehn M.Relation of apparent diffusion coefficient changes and metabolic disturbances after 1 hour of focal cerebral ischemia and at different reperfusion phases in rats.J Cereb Blood Flow Metab2001;21: 430 –39
30. Moseley ME, Cohen Y, Mintorovitch J, et al.Early detection of regional cere-bral ischemia in cats: comparison of diffusion- and T2-weighted MRI and spectroscopy.Magn Reson Med1990;14:330 – 46
31. Duong TQ, Sehy JV, Yablonskiy DA, et al.Extracellular apparent diffusion in rat brain.Magn Reson Med2001;45:801–10