Rotated Word Vector Representations and their Interpretability
Sungjoon Park and JinYeong Bak and Alice Oh Department of Computing, KAIST, Republic of Korea
{sungjoon.park, jy.bak}@kaist.ac.kr, [email protected]
Abstract
Vector representation of words improves performance in various NLP tasks, but the high-dimensional word vectors are very difficult to interpret. We apply several ro-tation algorithms to the vector representa-tion of words to improve the interpretabil-ity. Unlike previous approaches that duce sparsity, the rotated vectors are in-terpretable while preserving the expressive performance of the original vectors. Fur-thermore, any pre-built word vector repre-sentation can be rotated for improved in-terpretability. We apply rotation to skip-grams and glove and compare the expres-sive power and interpretability with the original vectors and the sparse overcom-plete vectors. The results show that the ro-tated vectors outperform the original and the sparse overcomplete vectors for inter-pretability and expressiveness tasks. 1 Introduction
Vector representations of words contain rich se-mantic and syntactic information and thus improve the performance of numerous natural language processing tasks. The vectors also play a basic role as an embedding layer in deep learning models for NLP, affecting the expressive performance of the model (Iyyer et al., 2014; Tai et al., 2015; Yang et al.,2016). However, the many dimensions com-prising the vector representation are not amenable to interpretation.
Previous research on vector representation of words has proposed improving interpretability while keeping the expressive performance by in-ducing sparsity in word vector dimensions ( Mur-phy et al., 2012; Fyshe et al., 2014). Recent re-search has proposed to build sparse vector
repre-sentations from a large corpus and added the non-negativity constraint using improved projected gradient (Luo et al.,2015), while (Sun et al.,2016) learns l1-regularised vectors. But, these models cannot be learned over pre-trained word vectors based on skip-gram (Mikolov et al.,2013) or glove (Pennington et al.,2014) which are widely used.
Faruqui et al.proposes an alternative approach to stand-alone models by forming sparse representa-tions based on the pre-trained models. To do this, they use overcomplete vectors, which are much higher in dimensionality than the original vectors. Unlike these sparsity-inducing approaches, we construct an interpretable word vector representa-tion by using the pre-trained word vectors as in-put and using a basis rotation algorithm from the Exploratory Factor Analysis (EFA) literature used in developing psychological scales (Osborne and Costello, 2009). Like the word vector representa-tion, every single item in the scale is represented as a numeric vector in the latent factor space. The set of item vectors are represented in a factor loading matrix, and the matrix is rotated such that the fac-tors (i.e., dimensions) become interpretable. The rotation achieves a Simple Structure (Thurstone,
1947) through minimizing the row and the column complexity of the matrix (Crawford and Ferguson,
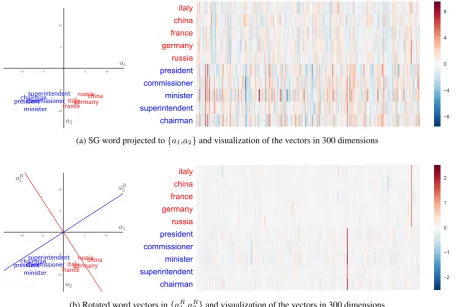
1970). We elaborate on this process in the next section. As in EFA, we rotate the word vector rep-resentation matrix to obtain dimension-wise inter-pretability while retaining the number of dimen-sions the same. For example, Figure1shows the rotated skip-gram vectors for two groups of words. These words are top five words of two dimensions from rotated Word2Vec.
Our main contribution is applying the matrix rotation algorithm from psychometric analysis to word vector representation models to improve the interpretability of the vector. This approach gives an answer to the question why and how word
−10 −5 5 10
−10 −5 5 10
a1
a2
italy china francegermany
russia
presidentcommissioner minister
superintendent chairman
FKDLUPDQ VXSHULQWHQGHQW PLQLVWHU FRPPLVVLRQHU SUHVLGHQW
UXVVLD JHUPDQ\ IUDQFH FKLQD LWDO\
(a) SG word projected to{a1,a2}and visualization of the vectors in 300 dimensions
−10 −5 5 10
−10 −5 5 10
italy china francegermany
russia presidentcommissioner
minister superintendent chairman
a1
a2
aR
1
aR
2
FKDLUPDQ VXSHULQWHQGHQW PLQLVWHU FRPPLVVLRQHU SUHVLGHQW
UXVVLD JHUPDQ\ IUDQFH FKLQD LWDO\
(b) Rotated word vectors in{aR
[image:2.595.71.530.65.372.2]1,aR2}and visualization of the vectors in 300 dimensions
Figure 1: Overview of rotating word vectors dimensions. We plot (a) unrotated and (b) rotated skip-gram word vectors in 2-D projected embedding space using PCA (left), and visualization of the vectors in original 300 dimensional space (right). Colors of words indicates the meaning of countries (Red) and positions (Blue). As in (b), after the dimensions are rotated, interpretability for each dimensions is improved having meaning of countries and positions.
tor representations work well by revealing a hid-den structure of the original word vectors. That is, it is meaningful to transform the hard-to-interpret dimensions of the pre-built word vectors, which are widely used, to more interpretable vectors. We also show that the rotated vectors retain their effec-tiveness with respect to downstream tasks without re-building the vector representations.
Our method can be applied to any type of word vectors as a post-processing method such that it does not require a large corpus to be trained. In addition, it does not require additional number of dimensions so it does not increase the complexity of the model. Furthermore, we explore the charac-teristics of the rotated word vectors.
2 Factor Rotation
We take the rotation algorithm from the ex-ploratory factor analysis (EFA) conducted to ver-ify the construct validity of the psychological scale in development. For example, when validating a
scale measuring respondents’ latent factors, such as “Engineering problem solving” and “Interest in engineering”, items should be similar within a fac-tor, and distinguished between factors. As shown in Table1, EFA projects every item into the latent factor space as an unrotated factor loading matrix. However, since it is unclear what the factor means, factor rotation is applied to the matrix that pro-duces the rotated factor loading matrix which en-hances the interpretability of the dimensions ( Os-borne,2015).
2.1 Rotating Factors
The rotation algorithm transforms factor loading matrix to thesimple structurewhich is much eas-ier to interpret (Thurstone,1947). It involves post-multiplication of a p×m input matrix A by an
m×m square matrix T, to compute the rotated matrixΛ,
Latent
Factors Items
Unrotated
Factor Matrix Factor MatrixRotated Factor 1 Factor 2 Factor 1 Factor 2 Engineering
Problem Solving
How well did you feel prepared for:
(1) Defining what the problem really is .759 -.389 .830 .153 (2) Thinking up potential solutions to the problem .784 -.392 .861 .157 (3) Detailing how to implement the solution to the problem .798 -.416 .888 .146 Interest in
Engineering
(1) I find many topics in engineering to be interesting .630 .521 .194 .793 (2) Solving engineering problems is interesting to me .660 .630 .149 .901
[image:3.595.76.524.62.164.2](3) Engineering fascinates me .669 .627 .158 .906
Table 1: An example of the factor rotation process to verify the construct validity of the psychological scale and its intended latent factor (left) in development. Items and loadings are from (Osborne,2015).
which minimizes the cost function f(Λ), also known as the rotation criterion. The function min-imizes the complexityof the matrix, to make the rotated matrix have a few large values in a row or a column.
Minimizing the complexity allows non-binary values in the vector, and thus a more complex so-lution that the perfect simple structure. This is a more realistic solution since a solution with binary vectors may be misleading in representing the fac-tor of interest (Yates,1988;Browne,2001). More details are described in the next subsection.
The intuition behind this approach is that induc-ing interpretability by factor rotation reforms the word embedding matrix to have a simple struc-tureby linear transformation. It encourages each word vector (row) and dimension (column) to have a few large values, leading to more interpretable dimensions as shown in Fig1.
2.2 Crawford-Ferguson Rotation Family
The rotation criterion introduced inCrawford and Ferguson is a family of complexity functions as follows:
f(Λ) = (1−κ) Σpi=1Σmj=1Σml6=j,l=1λ2ijλ2il
+κΣmj=1Σpi=1Σlm6=i,l=1λ2ijλ2lj (2)
whereλij is an element ofΛ. The first term
rep-resents the row (item) complexity, and the sec-ond term represents the column (factor) complex-ity. The ratio between the two is adjusted by the parameter κ (0 ≤ k ≤ 1). The criterion is a generalized version of the widely used criteria, the orthomax family (Harman, 1960) which in-cludes quartimax (Carroll,1953;Ferguson,1954;
Neuhaus and Wrigley, 1954), varimax (Kaiser,
1958), and direct quartimin (Carroll, 1960). It effectively reflects the simple structure as well (Browne, 2001). In this work, we apply the
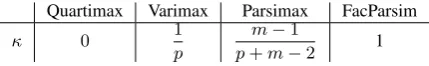
fol-Quartimax Varimax Parsimax FacParsim
κ 0 1
p
m−1
p+m−2 1
Table 2: Representative κ values used. As (Sass and Schmitt, 2010), we use 4 criterion referred to as CF-Quartimax, CF-Varimax, CF-Parsimax, CF-FacParsim. We omit ’CF-’ for simplicity and do not separate the name of the kappa condition whether it is orthogonal or oblique. FacParsim stands for factor parsimony.
lowing representativeκvalues in Table2(Sass and Schmitt,2010).
In addition, the constraints for the rotation ma-trixT can be applied in general. We can catego-rize the rotation as orthogonal and oblique based on the constraint. Orthogonal rotation assumes the correlation between the rotated dimensions is zero. Hence, the matrix should be an orthogonal matrix that withm(m−1)/2constraints, satisfies:
T0T =I (3)
Oblique rotations allow the correlation between dimension to be non-zero, resulting in m con-straints satisfying:
diag(T−1T−10) =I (4)
The solution for the input matrix is computed by using the gradient projection algorithm (Jennrich,
2001,2002). The algorithm minimizes equation2
while satisfying the constraints of the rotation ma-trix.
3 Experimental Settings
We choose the Wikipedia English articles1to train
the word vector models. The corpus contains 5.3M articles, 83M sentences and 1,676M tokens. For
[image:3.595.309.524.219.252.2]preprocessing, we leave only the alphanumeric to-kens and apply lowercase to all words. Then we remove the words with frequency less than 50, and the size of the remaining vocabulary is 306,491.
We train skip-gram2(Mikolov et al.,2013) and
glove3(Pennington et al.,2014) based on the
cor-pus by using existing implementations. We set the window size to 5 for both skip-gram and glove. We set the number of negative samples to 5 and the number of dimensions to 300. We use the default values for the other hyperparameters. The size of the resulting word vector matrix is (306,491, 300). We compare our model with two baseline mod-els: sparse overcomplete vector representations (SOV) and the non-negative version of the SOV. We set the hyperparameters of these models as
λ = .5, τ = 10−5, K = 3000 for SG, and
λ = 1.0, τ = 10−5, K = 3000 for Glove
(Faruqui et al., 2015). We excluded methods as baselines that construct interpretable word vectors using huge training corpora because our method works with pre-trained vectors.
We apply four rotation algorithms for each or-thogonal and oblique rotation, listed in Table 2. Since we have two original word vector represen-tations, we have 16 (4 x 2 x 2) rotated vectors in total. We implement the algorithm through Tensor-Flow (Abadi et al.,2016), and it is publicly avail-able on GitHub4.
4 Interpretability
In this section, we show how the rotation of word vectors results in improved dimension-wise inter-pretability using the word intrusion task. (Murphy et al.,2012;Faruqui et al.,2015;Sun et al.,2016).
4.1 Word Intrusion
Word intrusion task seeks to measure the semantic coherence of a set of words. For example, consider a set of words consists of (‘daughter’, ‘wife’, ‘sis-ter’, ‘mother’, ‘son’) and add an ‘intruder’ word (‘bigram’) to the set. Since the words except in-truder has similar meanings to each other, we can easily pick out the intruder to conclude that the five words are sharing coherent meanings.
We apply this task to measure interpretability of every word vector dimensions. If we choose the words with the highest embedding values for
2https://radimrehurek.com/gensim 3https://nlp.stanford.edu/projects/glove
4https://github.com/SungjoonPark/factor rotation
each of the dimensions (top words for that dimen-sion) and add an random (intruder) word and see whether the intruder can be easily identified, then we can conclude the dimension is semantically co-herent. In this way, we can measure the extent of interpretability of a dimension in vector represen-tations by this task. Note that we pick top words for a dimension by looking only for the value of that dimension, ignoring values in the other di-mensions.
Specifically, we first choose the top five words in each dimension, and then we choose an intruder word based on two criteria: 1) it is in the lower half of that dimension, and 2) it is in the top 10% in some other dimension. Also, we follow the set-tings of the measure (k = 5, top 10%) from pre-vious works. We see similar results when we run experiments with larger k. (Murphy et al., 2012;
Sun et al.,2016)
In the standard word intrusion task, human eval-uators pick out the intruder words, and the results report the accuracy of the evaluators (Chang et al.,
2009). But this approach would be impractical to use for all experimental conditions with 300 di-mensions and the baselines, so we use the follow-ing distance ratio (DR) metric as an alternative ap-proach in (Sun et al., 2016) with slight modifica-tions. Another advantage of our metric is that it can be used to quantify the distance between the intruder and the non-intruder words. We define the overall metric as the average of the ratio between
Da
inter andDintraa overddimensions as
DRoverall = 1dΣ
d
a=1Dainter
Σd
a=1Dintraa
(5)
whereDa
intrais the average distance of every pair
among the topkwords in dimensiona
Da
intra = ΣwiΣwk(kjdist(w−1)i, wj), (6)
andDa
inter is the average distance between the
in-truder word and each of the topkwords in dimen-siona
Dainter = Σwidist(wi, wintruder)
k . (7)
We definedist(wj, wk)as the cosine distance
be-tween wj andwk. We set k = 5 and repeat this
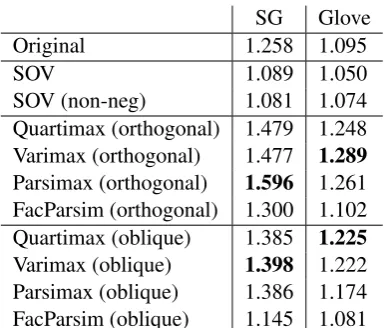
SG Glove Original 1.258 1.095
SOV 1.089 1.050
SOV (non-neg) 1.081 1.074 Quartimax (orthogonal) 1.479 1.248 Varimax (orthogonal) 1.477 1.289
Parsimax (orthogonal) 1.596 1.261 FacParsim (orthogonal) 1.300 1.102 Quartimax (oblique) 1.385 1.225
Varimax (oblique) 1.398 1.222 Parsimax (oblique) 1.386 1.174 FacParsim (oblique) 1.145 1.081 Table 3: Overall distance ratio (DRoverall) of
the original, sparse overcomplete vectors, and the rotated (orthogonal and oblique) vector repre-sentations. Rotated vectors show improved inter-pretability over SOV and the original.
4.2 Results
Table 3 shows the results of word intrusion in terms of the distance ratio metric. Overall, the re-sults of the rotated vector representations show improvements over SOV and the original word vector representations. For skip-grams, orthogonal parsimax shows the best result while for Glove, or-thogonal varimax outperforms the others. Among oblique rotation, varimax and quartimax show bet-ter performance than factor parsimony.
In general, interpretability varies with different values of κ. It increases when κ is close to zero and decreases whenκis close to one, putting more weight on the column complexity. Also, orthogo-nal rotation shows better performance than oblique rotation whenκis controlled.
4.3 Qualitative Examples
We present the top words of five dimensions for skip-gram and rotated skip-gram (parsimax-orthogonal) in Table4. The dimensions shown are randomly selected for both conditions.
Overall, the top words in each dimension of skip-gram do not clearly show a common topic among them. Only a few dimensions out of 300 are interpretable, such as the second row in the ta-ble which is related to numbers. The overall dis-tance ratio of the original vectors is slightly higher than one.
For the rotated word vectors, the top words show clear semantic coherence. The first row shows words about social network services, the
Model Topwords
SG
householder, asked, indicted, there, ethnic score, two, best, three, four
mining, footballer, population, laps, settled density, census, fourier, editor, photos money, toured, season, announced, banned
Rot. SG
[image:5.595.85.281.60.224.2]twitter, facebook, youtube, myspace, internet receptors, receptor, neurons, apoptosis, neuronal pennsylvania,ohio,maryland,philadelphia,illinois paintings, portraits, painting, drawings, painter that, which, when, where, but
Table 4: 5 top words for the original and the ro-tated skip-gram word representations. The roro-tated vectors show common semantic or syntactic co-herence while the original vectors do not.
second row is about biology, the third row is about geographical locations in the US, and the fourth is about paintings. As the last row shows, some of these dimensions represent syntactic features. 5 Expressive Performance
We evaluate the expressive power of word vec-tor representations on the following tasks and re-port Spearman’s correlation coefficient for the first task, and accuracy for the other tasks. Table 5
shows the results.
5.1 Evaluation
We briefly describe the seven benchmark tasks: word similarity and semantic/syntactic analogy, and four classification tasks. For the classification tasks, we average the word vectors in each training sentence or phrase to use them as features. SVM and random forest classifier are trained to predict the target values, and hyperparameters are tuned on the validation set.
Word Similarity (Simil.) SimLex-999 (Hill
et al., 2016) presented to evaluate the similarity of word pairs, rather than relatedness. We compute the cosine similarity between the given word pairs, and report the Spearman’s correlation coefficient as a measure of consistency between the similar-ity and human ratings.
Semantic and Syntactic Analogies (Analg.
sem, syn). The second and third tasks are word
analogy tasks proposed by (Mikolov et al.,2013). The semantic task includes 8,869 questions (sem) and the syntactic task includes 10,675 questions (syn).
Sentiment Analysis (Sent.)The first
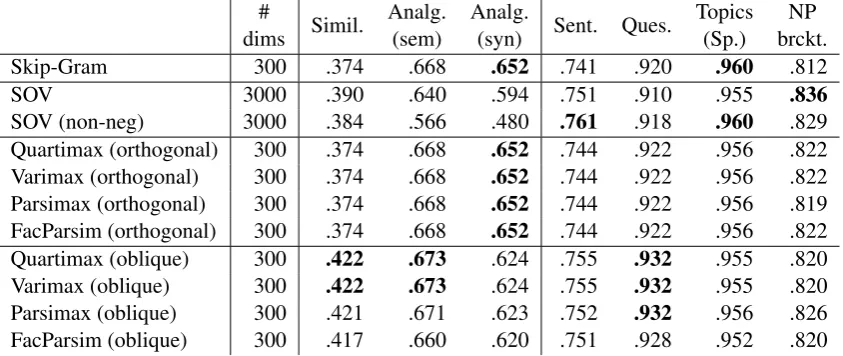
[image:5.595.308.534.61.174.2]#
dims Simil. Analg.(sem) Analg.(syn) Sent. Ques. Topics(Sp.) brckt.NP Skip-Gram 300 .374 .668 .652 .741 .920 .960 .812
SOV 3000 .390 .640 .594 .751 .910 .955 .836
[image:6.595.89.511.63.241.2]SOV (non-neg) 3000 .384 .566 .480 .761 .918 .960 .829 Quartimax (orthogonal) 300 .374 .668 .652 .744 .922 .956 .822 Varimax (orthogonal) 300 .374 .668 .652 .744 .922 .956 .822 Parsimax (orthogonal) 300 .374 .668 .652 .744 .922 .956 .819 FacParsim (orthogonal) 300 .374 .668 .652 .744 .922 .956 .822 Quartimax (oblique) 300 .422 .673 .624 .755 .932 .955 .820 Varimax (oblique) 300 .422 .673 .624 .755 .932 .955 .820 Parsimax (oblique) 300 .421 .671 .623 .752 .932 .956 .826 FacParsim (oblique) 300 .417 .660 .620 .751 .928 .952 .820 Table 5: Evaluation results of the original skip-gram, sparse overcomplete vectors (SOV), and the rotated (orthogonal and oblique) word vectors on various tasks. The left three columns show tasks based on cosine similarity, and the right four columns show classification tasks using average word vectors as features. Overall, the rotated word vectors show higher or comparable performance to that of the SOV and the original. We observe a similar pattern in Glove as well.
6,920, 872, 1,821 sentences for training, develop-ment, and test, respectively. The goal of this task is to predict positive or negative sentiment of the reviews.
Question Classification (Ques.) Next, we use
TREC dataset to classify categories of the ques-tions (Faruqui et al.,2015). We divide the dataset into 4,952, 500, 500 for training, development, and test. The dataset has six types of questions includ-ing about person, location, etc.
Topic Classification (Topics: Sp.)Next, we
ob-tain the 20 newsgroup dataset to classify Sports (baseball vs. hockey) topics (Yogatama and Smith,
2014;Faruqui et al.,2015). The dataset consists of 958, 239, 796 for training, development, and test.
NP bracketing (NP brckt.) The final task is
classifying noun phrases in terms of bracketing (Lazaridou et al.,2013;Faruqui et al.,2015). Each phrase consists of three words, and the task is to predict the correct bracketing to match the similar words. We compute the average of NPs and per-form ten-fold cross-validation over 2,227 phrases. The classifiers are trained and the hyperparameters are tuned for every fold.
5.2 Results
Word Similarity and AnalogiesWe observe
im-proved performance of oblique rotation of word vectors compared to the original and the SOV in word similarity and semantic analogy tasks. In the syntactic analogy, orthogonal rotation shows the
same performance as the original. Note that the orthogonal rotations preserve the cosine-based ex-pressive performances because the cosine similar-ity between any two vectors does not change after the orthogonal rotation.
Classification Tasks The SOV models show
slightly higher performance except the question classification task. However, we can observe the rotated word vectors have improved performance over the original vectors. We observe a similar pat-tern in Glove as well. In conclusion, the rotated representations preserve the expressive power of the original word vectors, and it is quite close to that of the sparse representation with 10 times larger dimensionality.
6 Understanding Rotated Word Vectors
In this section, we perform several experiments to understand the characteristics of the rotated word vector representations.
6.1 Directionality
(A) (B) (C) (D) (E) (F) (G) Desc
[image:7.595.74.527.62.213.2](Hi) (Lo)Asc (Hi, Lo)Cor (abs,CorDR) (abs, intra)Cor (abs, inter)Cor (abs)DR Quartimax (orthogonal) 1.479 1.507 -.452*** .843*** -.835*** .204*** 2.045 Varimax (orthogonal) 1.477 1.478 -.431*** .847*** -.840*** .205*** 2.004 Parsimax (orthogonal) 1.596 1.499 -.729*** .845*** -.836*** .216*** 2.442 FacParsim (orthogonal) 1.300 1.309 -.114* .536*** -.549*** .056 1.384 Quartimax (oblique) 1.385 1.464 -.692*** .879*** -.880*** .276*** 1.997 Varimax (oblique) 1.398 1.465 -.684*** .879*** -.878*** .204*** 2.022 Parsimax (oblique) 1.386 1.463 -.696*** .886*** -.883*** .279*** 1.993 FacParsim (oblique) 1.145 1.152 .006 .382*** -.369*** .037 1.171 Table 6: Overall distance ratio based on the top words extracted from the values in word vectors sorted by descending order (Hi) and ascending order (Lo). Cor(Hi, Lo) is correlation between two distance ratios based on both directions. Next three columns present correlation between the absolute word vector values of the top words and distance ratios. The last columns shows selective distance ratio measure. The results implies generally both direction is interpretable, one direction is more interpretable than the other within a dimension, and larger absolute value in a dimension means higher interpretability. (*p < .05,
**p< .01, ***p< .001)
Overall Interpretability of both directions
The first two columns (A) and (B) in table6show the overall distance ratio computed over the top words extracted by descending order and ascend-ing order, respectively. In other words, (A) refers to the top words having the highest positive values in each dimension, while (B) uses the lowest neg-ative values. Note that we used descending order in word intrusion task in the previous section.
Interestingly, the overall distance ratios in both directions are comparable to each other. On av-erage, both sides of a dimension are more inter-pretable than the unrotated vector representations except the oblique factor parsimony rotation.
Interpretability of both directions within a
dimensionNext, we compare the interpretability
of both directions within a dimension. We first de-fine the distance ratio of an individual dimension
aas follows:
DRa= Dainter
Da
intra (8)
We compute the ratio by using top words ex-tracted from positive and negative directions for every dimension, and compute Spearman’s corre-lation of the distance ratio pairs. Table 6column (C) shows the results. All of the rotation condi-tions except the oblique factor parsimony shows significant (p < .05) negative correlation, mean-ing that both directions are hard to be highly inter-pretable within a dimension simultaneously.
Dir. Topwords
+ depends, depend, rely, focused, focuses - on, upon, onto, again, until
+ years, month, weeks, days, decades - many, several, ago, numerous, various + that, which, when, where, but
- consists, includes, provides, contains, serves + criticizes, excelled, tended, much, criticized
- october, july, april, september, june + were, hoc, recently, their, had
- largest, oldest, longest, biggest, tallest
Table 7: Examples of top words in both directions. The words are extracted from a part of the orthog-onal parsimax rotated skip-gram word vectors.
Case Study We present the top words in both
directions for some dimensions of orthogonal par-simax rotated word vectors. As shown in table7, some dimensions show a relationship between the opposite directions that they consist of consecu-tively used words, such as ”rely on”, ”depends upon”, ”which includes”, ”that contains”, ”many years”, ”weeks ago”. However, other dimensions show that one direction is relatively more inter-pretable than the other direction.
6.2 Selecting the Direction
[image:7.595.315.518.336.448.2]Relation to distance ratioTable6column (D) presents Spearman’s correlation between individ-ual distance ratio and the mean absolute vector value of top words for that dimension. The fifth column (E) also shows the correlation between the intra-distance among the top words and the mean absolute value, and the sixth column (F) is the rela-tionship of the inter-distance among the top words and the intruder and the mean absolute value.
Correlation coefficients show that the larger mean absolute value means higher interpretability for that dimension. In detail, there exists tenden-cies that larger mean absolute value of dimension reduces the intra-distances among the top words while increasing the inter-distances among the top words and the intruder.
Overall, we summarize our findings as follows: 1) generally both directions are somewhat pretable, 2) one direction is usually more inter-pretable than the other within a dimension, and 3) a larger absolute value in a dimension means higher interpretability of the dimension.
Selective Distance RatioWe can select a more
interpretable direction for each dimension through inspecting the mean absolute value of the top words in both directions. If we choose a direction that has a larger mean absolute value among the top words, each dimension should be easier to in-terpret.
Table6column (G) presents this distance ratio computed on the rotated vectors, resulting in in-creased distance ratio values. We name this ratio as the overall selective distance ratio. This mea-sure could be effectively used when vector repre-sentation is interpretable in both directions.
6.3 Effect ofκ
We explore the effect on performance of the ratio between the row and the column complexity of the rotation criteria. As shown in section4, choosing an appropriateκis important for interpretability.
We set the κ value from zero to one and the numbers divided on a log scale. We run the word similarity task and the word intrusion to evaluate the performance. We present Spearman’s correla-tion and the selective overall distance ratio.
Figure2shows that the performance of the sim-ilarity task tends not to change regardless of κ, however, the selective distance ratio starts to de-crease when κ > .01. Considering the ratio be-tween the number of rows and columns of the
1.997 2.046 2.046 1.997 1.997 1.996 2.006 1.810
1.251 1.171 0.422 0.422 0.422 0.422 0.422 0.422 0.422 0.419 0.418 0.417
0 1E-15 1E-12 1E-10 1E-08 1E-06 1E-04 0.01 0.1 1
Complexity Weight (Kappa) Word Intrusion Similarity
(a) Skip-Gram (oblique rotated vector representations)
1.442
1.379 1.379 1.442 1.442 1.441 1.434
1.104 1.097 1.091 0.403 0.403 0.403 0.403 0.403 0.403 0.404 0.405 0.405 0.405
0 1E-15 1E-12 1E-10 1E-08 1E-06 1E-04 0.01 0.1 1
Complexity Weight (Kappa) Word Intrusion Similarity
[image:8.595.310.529.63.180.2](b) Glove (oblique rotated vector representations) Figure 2: Spearman’s correlation of the word simi-larity and the selective distance ratio of word intru-sion changes over κs, computed over oblique ro-tated (a) skip-gram and (b) glove vectors. Dashed line is original performance for each task. Word similarity does not change regardless ofκs, while the distance ratio falls whenκis larger than 1e-4.
word vector matrix, giving too much weight to the column complexity results in degraded inter-pretability.
In our experiments,κ values of the quartimax, varimax, and parsimax rotation are computed as 0, 3e-06, 1e-04 respectively. Based on the results, our selection of kappas have shown interpretabil-ity improvement effectively, compared to factor parsimony (κ = 1). We observe these tendencies in orthogonal rotations as well.
6.4 Effect of the Number of Dimensions
To investigate the effect of the number of di-mensions to interpretability of didi-mensions, we also measure the overall distance ratio (DRoverall)
on 50, 100 and 200 dimensions of unrotated skip-gram and parsimax (orthogonal) and varimax (oblique) rotated word vectors.
Figure3shows the results. For all settings, the rotated vectors orthogonal (parsimax) and oblique (varimax) show higher DRoverall score than the
[image:8.595.309.529.206.317.2]0 0.5 1 1.5 2
50 100 200 300
Ov
er
all
Dis
tan
ce
R
at
io
Vector Dimensions
[image:9.595.78.284.65.194.2]Skip-Gram Oblique Orthogonal
Figure 3: Overall distance ratio (DRoverall) over
word vector dimensions. The rotated vectors (parsimax-orthogonal and varimax-oblique) show higherDRoverallscore than the original skip-gram
vectors.
7 Related Work
Since distributed representations play an impor-tant role in various NLP tasks, they are applied to semantics (Herbelot and Vecchi,2015;Qiu et al.,
2015; Woodsend and Lapata, 2015), with incor-porating external information to them (Tian et al.,
2016;Nguyen et al.,2016). In addition, finding in-terpretable regularities from the representations is often conducted through non-negative and sparse coding (Murphy et al.,2012;Faruqui et al.,2015;
Luo et al.,2015;Kober et al.,2016), and regular-ization (Sun et al.,2016). Instead, our approach is using rotation, showing better results in terms of interpretability.
Meanwhile, various rotation methods are pro-posed such as CF-family (Crawford and Fergu-son, 1970), Infomax (McKeon, 1968), Minimum Entropy (Jennrich, 2006), Geomin (Yates,1988), procrustues (Hurley and Cattell, 1962), and pro-max rotation criteria. (Hendrickson and White,
1964). Incorporating prior knowledge about ro-tated matrix is possible through target rotations (Harman, 1960; Browne, 1972a,b) are proposed as well. There are various ways to rotated dimen-sions, we select a CF-family that covers frequently used rotation methods in practice.
8 Conclusion and Discussions
In this paper, we applied the rotation algorithm to improve interpretability of distributed represen-tation of words. We applied quartimax, varimax, parsimax and factor parsimony rotation by using the Crawford-Ferguson rotation criteria, then we constructed the rotated word vector
representa-tions. We evaluated the expressive performance and interpretability for the rotated word vectors by word similarity, analogy, classification, and word intrusion task. The results show that the ro-tated word vector representations are highly inter-pretable with preserving expressive performance.
In addition, we explored the characteristics of the rotated word vectors: we observed 1) increased interpretability in both directions and 2) the posi-tive relation between absolute value of the dimen-sion and interpretability. Based on these observa-tions, we proposed the selective distance ratio to measure and maximize the interpretability when the vector representation has interpretable mean-ing in both directions. We expect that the rotation algorithm can be easily applied to other word vec-tor representations.
Our results imply that a rotated word vector can be used to understand what the word vectors are comprised of. Since a lexicon can be decomposed into morphemes, a word can have multiple mean-ing as a polysemy, contain information of syntac-tic structure in its meaning (Carpenter et al.,1995;
MacDonald et al.,1994;Trueswell et al.,1994), or it can be divided into a variety of sub-components. Hence, we can investigate the lexical semantics of words by exploring the dimensions for which a word has higher values.
In addition, there are practical implications of interpreting the dimensions as well. Based on the meanings, we can remove irrelevant dimensions for a specific task of interest, in order to secure more efficient storage of the vectors and decrease the complexity of downstream NLP models. We will examine the issues in future work.
We plan to explore following issues. First, we apply target rotation (Harman, 1960; Browne,
1972a,b) to incorporate prior knowledge when constructing the rotated word vector representa-tions. Second, we will investigate the interpretabil-ity of hidden structures of neural networks for NLP tasks such as (Yang et al., 2016; Li et al.,
2016), when the rotated word vectors are used as an embedding layer.
Acknowledgments
References
Mart´ın Abadi, Paul Barham, Jianmin Chen, Zhifeng Chen, Andy Davis, Jeffrey Dean, Matthieu Devin, Sanjay Ghemawat, Geoffrey Irving, Michael Isard, et al. 2016. Tensorflow: A system for large-scale
machine learning. InProceedings of OSDI.
Michael W Browne. 2001. An overview of analytic
rotation in exploratory factor analysis. Multivariate
Behavioral Research, 36(1):111–150.
MW Browne. 1972a. Oblique rotation to a partially
specified target. British Journal of Mathematical
and Statistical Psychology, 25(2):207–212.
MW Browne. 1972b. Orthogonal rotation to a partially
specified target. British Journal of Mathematical
and Statistical Psychology, 25(1):115–120.
Patricia A Carpenter, Akira Miyake, and Marcel Adam Just. 1995. Language comprehension: Sentence and
discourse processing. Annual review of psychology,
46(1):91–120.
JB Carroll. 1960. Ibm 704 program for generalized
an-alytic rotation solution in factor analysis.
Unpub-lished manuscript, Harvard University, 9:324. John B Carroll. 1953. An analytical solution for
ap-proximating simple structure in factor analysis.
Psy-chometrika, 18(1):23–38.
Jonathan Chang, Sean Gerrish, Chong Wang, Jordan L. Boyd-graber, and David M. Blei. 2009. Reading tea
leaves: How humans interpret topic models. In
Pro-ceedings of NIPS, pages 288–296.
Charles B Crawford and George A Ferguson. 1970. A general rotation criterion and its use in orthogonal
rotation. Psychometrika, 35(3):321–332.
Manaal Faruqui, Yulia Tsvetkov, Dani Yogatama, Chris Dyer, and Noah Smith. 2015. Sparse overcomplete
word vector representations. InProceedings of ACL.
George A Ferguson. 1954. The concept of parsimony
in factor analysis.Psychometrika, 19(4):281–290.
Alona Fyshe, Partha P Talukdar, Brian Murphy, and Tom M Mitchell. 2014. Interpretable semantic vec-tors from a joint model of brain-and text-based
meaning. InProceedings of ACL.
Harry H Harman. 1960. Modern factor analysis.
Uni-versity of Chicago Press.
Alan E Hendrickson and Paul Owen White. 1964. Pro-max: A quick method for rotation to oblique simple
structure. British journal of statistical psychology,
17(1):65–70.
Aur´elie Herbelot and Eva Maria Vecchi. 2015. Build-ing a shared world: mappBuild-ing distributional to
model-theoretic semantic spaces. In Proceedings of
EMNLP.
Felix Hill, Roi Reichart, and Anna Korhonen. 2016. Simlex-999: Evaluating semantic models with
(gen-uine) similarity estimation. Computational
Linguis-tics.
John R Hurley and Raymond B Cattell. 1962. The pro-crustes program: Producing direct rotation to test a
hypothesized factor structure. Systems Research and
Behavioral Science, 7(2):258–262.
Mohit Iyyer, Peter Enns, Jordan Boyd-Graber, and Philip Resnik. 2014. Political ideology detection
using recursive neural networks. InProceedings of
ACL.
Robert I Jennrich. 2001. A simple general procedure
for orthogonal rotation. Psychometrika, 66(2):289–
306.
Robert I Jennrich. 2002. A simple general method for
oblique rotation.Psychometrika, 67(1):7–19.
Robert I Jennrich. 2006. Rotation to simple loadings using component loss functions: The oblique case. Psychometrika, 71(1):173–191.
Henry F Kaiser. 1958. The varimax criterion for
an-alytic rotation in factor analysis. Psychometrika,
23(3):187–200.
Thomas Kober, Julie Weeds, Jeremy Reffin, and David Weir. 2016. Improving sparse word representations with distributional inference for semantic
composi-tion. InProceedings of EMNLP.
Angeliki Lazaridou, Eva Maria Vecchi, and Marco Ba-roni. 2013. Fish transporters and miracle homes: How compositional distributional semantics can
help np parsing. InProceedings of EMNLP.
Shaohua Li, Tat-Seng Chua, Jun Zhu, and Chunyan Miao. 2016. Generative topic embedding: a
contin-uous representation of documents. InProceedings
of ACL.
Hongyin Luo, Zhiyuan Liu, Huan-Bo Luan, and
Maosong Sun. 2015. Online learning of
inter-pretable word embeddings. In Proceedings of
EMNLP.
Maryellen C MacDonald, Neal J Pearlmutter, and Mark S Seidenberg. 1994. The lexical nature of
syn-tactic ambiguity resolution. Psychological review,
101(4):676.
JJ McKeon. 1968. Rotation for maximum association
between factors and tests. Unpublished manuscript,
Biometric Laboratory, George Washington Univer-sity.
Tomas Mikolov, Ilya Sutskever, Kai Chen, Greg S Cor-rado, and Jeff Dean. 2013. Distributed representa-tions of words and phrases and their
Brian Murphy, Partha Pratim Talukdar, and Tom Mitchell. 2012. Learning effective and interpretable semantic models using non-negative sparse
embed-ding. InProceddings of COLING.
Jack O Neuhaus and Charles Wrigley. 1954. The
quar-timax method. British Journal of Statistical
Psy-chology, 7(2):81–91.
Kim Anh Nguyen, Sabine Schulte im Walde, and Ngoc Thang Vu. 2016. Integrating distributional lexical contrast into word embeddings for
antonym-synonym distinction. InProceedings of ACL.
Jason W Osborne. 2015. What is rotating in
ex-ploratory factor analysis. Practical Assessment,
Re-search & Evaluation, 20(2):2.
Jason W Osborne and Anna B Costello. 2009. Best practices in exploratory factor analysis: Four recom-mendations for getting the most from your analysis. Pan-Pacific Management Review, 12(2):131–146.
Jeffrey Pennington, Richard Socher, and Christopher D Manning. 2014. Glove: Global vectors for word
rep-resentation. InProceedings of EMNLP.
Likun Qiu, Yue Zhang, and Yanan Lu. 2015. Syntactic dependencies and distributed word representations
for chinese analogy detection and mining. In
Pro-ceedings of EMNLP.
Daniel A Sass and Thomas A Schmitt. 2010. A com-parative investigation of rotation criteria within
ex-ploratory factor analysis. Multivariate Behavioral
Research, 45(1):73–103.
Richard Socher, Alex Perelygin, Jean Y Wu, Jason Chuang, Christopher D Manning, Andrew Y Ng, Christopher Potts, et al. 2013. Recursive deep mod-els for semantic compositionality over a sentiment
treebank. InProceedings of EMNLP.
Fei Sun, Jiafeng Guo, Yanyan Lan, Jun Xu, and Xueqi Cheng. 2016. Sparse word embeddings using l1
reg-ularized online learning. InProceedings of IJCAI.
Kai Sheng Tai, Richard Socher, and Christopher D Manning. 2015. Improved semantic representations from tree-structured long short-term memory
net-works. InProceedings of ACL.
Louis Leon Thurstone. 1947. Multiple factor analysis.
University of Chicago Press.
Ran Tian, Naoaki Okazaki, and Kentaro Inui. 2016. Learning semantically and additively compositional
distributional representations. In Proceedings of
ACL.
John C Trueswell, Michael K Tanenhaus, and Susan M Garnsey. 1994. Semantic influences on parsing: Use of thematic role information in syntactic
ambigu-ity resolution. Journal of memory and language,
33(3):285.
Kristian Woodsend and Mirella Lapata. 2015. Dis-tributed representations for unsupervised semantic
role labeling. InProceedings of EMNLP.
Zichao Yang, Diyi Yang, Chris Dyer, Xiaodong He, Alex Smola, and Eduard Hovy. 2016. Hierarchical attention networks for document classification. In Proceedings of NAACL-HLT.
Allen Yates. 1988.Multivariate exploratory data
anal-ysis: A perspective on exploratory factor analysis. Suny Press.
Dani Yogatama and Noah A Smith. 2014. Linguistic
structured sparsity in text categorization. In