The Study on Road Accidents Forecasting
Model Based on Multi-level Recursive
Method
YU Ren-de ZHANG Hong-bin LIU Fang SHI Peng
Abstract—In view of the characteristic that the traffic system is a dynamic and time-varying parameter system, the multi-level recursive forecasting method is proposed, and the multi-level recursive forecasting model of road accidents is established in this thesis. In this method, the forecasting of road accidents is divided into two parts: the forecasting of time-varying parameters and the future forecasting of road accidents based on the forecasting of time-varying parameters. By the precise forecasting of time-varying parameter, forecasting of road accidents is carried out .Forecasting results indicate the multi-level recursive forecasting model is suitable for the forecasting of road accidents and can improve the forecasting precision.
Keywords—road traffic, accident, multi-level recursive, time-varying parameter , forecasting
Ⅰ Introduction
The traditional statistical forecast method can have
a good fitting effect when it is used to fit historical
series, but in practical forecast it has certain fault
which mainly reflects that in the forecasting of road
traffic accidents, the road traffic dynamic system is
regarded as a non-time varying parameter system.
When the model with non-time dependence parameter
is used to forecast the state diversification of road
traffic dynamic system, the forecast error increases as
forecasting time prolonging[1][2][3][4].
Multi-level Recursive Forecast is a new-style
Manuscript received October 9, 2007
YU Ren-de is with Shandong University of Technology, School of Transport and Vehicle Engineering, Zibo 255049,China ( Tel: 86-0533-2782618; Fax: 86-0533-2786837; e-mail: [email protected])
ZHANG Hong-bin, Jr., is with Dezhou University, Dezhou 253023, China(e-mail:[email protected]).
LIU Fang is with Shandong University of Technology, School of Transport and Vehicle Engineering (e-mail: [email protected])
SHI Peng is with Shandong University of Technology, School of Transport and Vehicle Engineering (e-mail:
statistical forecast model of dynamic system based on
modern control theory “system identification”, its
basic idea is to split the forecast of dynamic system
into two parts—identification to time varying
parameter and the forecast to future state of the
dynamic system on this basis. The forecast precision
of system future state is improved by the exact
forecast to time varying parameter[5].
Multi-level Recursive method regards the dynamic
system as a one-dimensional or multidimensional time
series, sets about the exterior character of system,
builds the relation between input and output. By
carrying out time series data multi-level analysis, the
information quantity applied in modeling process of
forecast model is greatly increased, the model can
reflect system historical evolvement rule well, then the
model adaptation to long-term forecast enhances; on
the other hand, by time series multi-level analysis,
certain nonlinear model may also be avoided, thereby
the forecast error from it is avoided [6][7][8].
Based on these merits, this paper introduces the
forecast method of time varying system, applies the
multi-level recursive forecasting method to road traffic
accidents forecast, builds road traffic accidents
multi-level recursive forecasting model, splits the
forecast of road accidents into the forecast to time
varying parameter and the forecast to road accidents
future states on this basis, enhances accident forecast
precision by exactly forecasting time varying
parameter.
Ⅱ The basic model of Multi-level Recursive
Forecasting
The mathematical model of dynamic system is:
)
(
]
),
(
,
,
[
)
(
k
f
Y
1U
k
k
v
k
Where
y
(
k
)
is n-dimensional outputs,u
(
k
)
isp-dimensional inputs,
θ
(
k
)
is m-dimensionalparameters with time varying,
v
(
k
)
is n-dimensionalrandom yawp, k is discrete floating time. And that
}
{
(
0
),
(
1
),
(
2
),
,
(
1
)
1
=
−
−
y
y
y
y
k
Y
kL
L
}
{
u
(
0
),
u
(
1
),
u
(
2
),
,
u
(
k
)
U
k=
L
L
According to recursive method, the track formula
about time varying parameter
θ
can be educed as follow:}
),
1
(
ˆ
,
,
[
)
(
)]{
1
(
ˆ
,
[
)
(
)
1
(
ˆ
)
(
ˆ
1 ) 1 ( ˆ 1k
k
U
Y
f
k
y
k
k
f
k
A
k
k
k k k−
−
−
∇
+
−
=
− − −θ
θ
δ
θ
θ
θ (2)Where
θ
ˆ
(
k
)
is the Kth estimation ofθ
, and that) 1 ( ˆ 1 ) 1 ( ˆ
]
),
(
,
,
[
)]
1
(
ˆ
,
[
− = − −∂
∂
=
−
∇
k k k kk
k
U
Y
f
k
k
f
θ θ θθ
θ
θ
)
(
1
)
(
k rk kB
B
k
A
ϕ
α
+
=
T kk
f
k
k
f
k
k
k
B
(
)
=
∇
θˆ( −1)[
,
θ
ˆ
(
−
1
)]
∇
θˆ( −1)[
,
θ
ˆ
(
−
1
)]
Specially, when the model expressed by formula (1)
is single output, time varying parameter track formula
(2) may be described as:
}
),
1
(
ˆ
,
,
[
)
(
{
)]
1
(
ˆ
,
[
)]
1
(
ˆ
,
[
)
1
(
ˆ
)
(
ˆ
1 ) 1 ( ˆ 2 ) 1 ( ˆk
k
U
Y
f
k
y
k
k
f
k
k
f
k
k
k k k k−
−
×
−
∇
−
∇
+
−
=
− − −θ
θ
θ
δ
θ
θ
θ θ (3)where
δ
—positive number be selected properly. Ⅲ Establishment of road accidents multi-levelrecursive forecasting model
A. The choice of impact factor and the corresponding
measure in model
The identification of traffic safety impact factor
index is the precondition of establishing road traffic
accidents macroscopically forecasting model and the
insurance of its forecast effect[9].
According to the analysis of traffic safety impact
factor and identification fundamental of the factor
index, corresponding indexes are identified for the
population, road, motor vehicle and social
environmental general factor that impact macroscopic
road traffic safety.
(1) The population factor index, this index introduces
population density.
(2) The road factor index, this index introduces road
net density.
(3) The motor vehicle factor index, this index
introduces motor vehicle density, including civil
motorcar and motorcycle.
(4) The social environmental factor index, this paper
introduces the economic index of a country or district
to delegate the general impact index that brought by
social environment to road traffic safety, adopting two
indexes---GDP and the GDP annual increasing rate.
Population density、road net density、motor vehicle
density, average GDP and GDP increase rate are
regarded as road traffic safety effect indexes, which
has comparability and assimilability for different
countries and districts.
B. Road accidents Multi-level Recursive forecasting
model
The road traffic system is a nonlinear time-varying
parameter system. Road traffic accidents nonlinear
multi-level recursive forecasting model theoretically
should be set up to forecast future road traffic accidents.
But general multi-output system model can be
decomposed to several generalized single output system
model by separability theorem, and in a sense nonlinear
system can also be replaced by a group of equivalent
linear system[10] , so when general dynamic system forecast problem is processed, it’s ok that only the
linear simple output system is considered. Linear single
output system forecasting model is the most basic and
most common model in multi-level method, in general,
road traffic accidents linear simple output forecasting
model is built as:
)
(
)
(
)
(
)
(
)
(
22
k
u
k
+
+
nk
u
mk
+
e
k
+
β
L
β
)
(
)
(
)
(
)
(
)
(
1 1k
e
k
u
k
i
k
y
k
j m j j n ii
−
+
+
=
∑
∑
= =
β
α
(4)where
y
(
k
)
— one-dimensional outputs, i.e. roadaccidents forecast value in future time k;
)
(
,
),
(
),
(
21
k
u
k
u
k
u
L
m —mone-dimensional inputs, i.e. road accidents
impact measures;
)
(
),
(
),
(
),
(
),
(
),
(
2 1 2 1k
k
k
k
k
k
m nβ
β
β
α
α
α
L
L
—
n
+
m
forecasting time varying parameters;
)
(
k
e
—one-dimensional white noise;
k
—time;n
—autoregression rank of model.The first item in the right of this equation is called
autoregression item which reflects historical
development rule of road traffic itself; the second is
called environmental factor which reflects the impact
of exterior environment to the road accidents. When
building the road accidents forecast model in detailed,
if the evolvement rule of road traffic is obvious, the
accident itself reflects the impacts of several factors to
it, and has self-rule. Road traffic accidents multi-level
auto-recursive forecast model only with auto
regression item can be set up. Let:
T m
k
u
k
u
k
u
n
k
y
k
y
k
y
k
)]
(
),
(
),
(
),
(
,
),
2
(
),
1
(
[
)
(
2 1L
L
−
−
−
=
ϕ
T n nk
k
k
k
k
k
k
)]
(
),
(
),
(
),
(
),
(
),
(
[
)
(
2 1 2 1β
β
β
α
α
α
θ
L
L
=
then formula (4) model can be written as:
)
(
)
(
)
(
)
(
k
k
k
e
k
y
=
ϕ
Tθ
+
(5)when
y
(
k
),
ϕ
(
k
),
θ
ˆ
(
k
−
1
)
is given, the recursivetrack formula of time varying parameter
θ
ˆ
(
k
)
can be obtained,)}
1
(
ˆ
)
(
)
(
){
(
)
(
1
)
1
(
ˆ
)
(
ˆ
2−
−
+
−
=
k
k
k
y
k
k
k
k
Tθ
ϕ
ϕ
ϕ
θ
θ
(6)It satisfies the constraint condition
)
(
)
(
)
(
k
k
k
y
=
ϕ
Tθ
, and minimize indexparameter 2
)
1
(
ˆ
)
(
ˆ
−
−
=
k
k
J
θ
θ
. According todifferent characteristic of parameter forecast series
)}
(
{
θ
ik
, by choosing different parameterforecasting method, each time varying parameter’s
next step forecast value
θ
ˆ
∗(
N
+
1
)
can be obtained. In the basis of parameter forecasting, usingnext step forecast formula of
y
(
k
)
:
)
1
(
ˆ
)
1
(
)
1
(
ˆ
N
+
N
=
N
+
∗N
+
y
ϕ
Tθ
(7)Then forecast value system state can be obtained.
Where
y
ˆ
(
N
+
1
N
)
is next step forecast valueof
y
(
N
)
.Ⅳ Application of model
This paper selects road accidents statistic index data
some areas in china, processes road accidents
multi-level recursive forecasting and preliminarily test
the validity of model. There, data of 1995 to 2001 is
used to build road accidents forecasting model, the
statistic data of 2002 to 2004 is used to detect forecast
precision of multi-level recursive forecasting model.
The forecasting model is set up based on the accidents
death, which is one of the accidents statistic indices.
The basic data shows as table 1 to table 5.
A. Identification of model ranks
When identifies model ranks, this paper takes final
error rule[11]—one of identifying and establishing model
rules, simply marks with FPE rule. There,
FPE
defined as: 2 1ˆ
)
1
1
(
)
1
1
(
)
(
=
+
+
×
−
+
−σ
εk
k
n
k
k
FPE
(8)model(in auto-regressive model
k
equals to model rankp
);n
—numbers of sample;2
ˆ
εσ
—model residual error standarddeviation .
For auto-regressive model
AR
(
p
)
,σ
ˆ
ε2is defined as:2 1
1
2
(
ˆ
)
1
1
ˆ
t jp
j j n
p t
t
y
y
n
=∑
+∑
= −−
−
=
φ
σ
ε (9)Fitting by least square method,
FPE
can be gotten. The optimal rank can be chosen as:{
u}
k
FPE
k
p
p
min
1
,
2
,
,
)(
=
=
L
=
,wherep
uis the upperbound of
p
.In applying least square method it should beassured that
1
2
⎥⎦
−
⎤
⎢⎣
⎡
≤
n
p
u .According to methods and rules of identifying
model optimalrank above, it can be ensured that the
optimalrank of identifying road accidents forecasting
model is 2 rank.
B. Establishment of forecasting model
According to identified road impact factors index and
model optimal rank result, road accidents multi-level
recursive forecasting model is established as follow:
)
(
)
(
)
2
(
)
(
)
1
(
)
(
)
(
6
1
2 1
k
u
k
k
y
k
k
y
k
k
y
j j
j
∑
=
+
−
+
−
=
β
α
α
(10)
where
y
(
k
)
—road traffic accidents in thek
th year;)
(
,
),
(
),
(
),
(
),
(
2 1 2 61
k
α
k
β
k
β
k
β
k
α
L
—forecast of time varying parameter
)
(
,
),
(
),
(
2 61
k
u
k
u
k
u
L
—identified roadtraffic safety impact index, i.e. population
density, road net density, civil automobile
density, motorcycle density, per-capita GDP and
the GDP increasing rate.
C. The selection of model parameter initial value
Model above is regarded as multivariate linear
regression model. First , model parameter is fitted by
the least square method and SPSS tool;
second ,regressive coefficient is calculated; third, these
regressive coefficient values obtained is treated as
initial value of relative parameter. Initial value of time
varying parameter shows as table 6 to table 7.
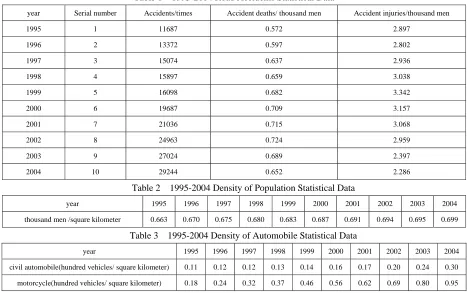
Table 1 1995-2004 Road Accidents Statistical Data
year Serial number Accidents/times Accident deaths/ thousand men Accident injuries/thousand men 1995 1 11687 0.572 2.897 1996 2 13372 0.597 2.802 1997 3 15074 0.637 2.936 1998 4 15897 0.659 3.038 1999 5 16098 0.682 3.342 2000 6 19687 0.709 3.157 2001 7 21036 0.715 3.068 2002 8 24963 0.724 2.959 2003 9 27024 0.689 2.397 2004 10 29244 0.652 2.286
Table 2 1995-2004 Density of Population Statistical Data
year 1995 1996 1997 1998 1999 2000 2001 2002 2003 2004 thousand men /square kilometer 0.663 0.670 0.675 0.680 0.683 0.687 0.691 0.694 0.695 0.699
Table 3 1995-2004 Density of Automobile Statistical Data
[image:4.612.72.539.442.735.2]
Table 4 1995-2004 Density of Road Network Statistical Data
year 1995 1996 1997 1998 1999 2000 2001 2002 2003 2004 kilometer/ square kilometer 0.443 0.463 0.481 0.495 0.508 0.524 0.535 0.524 0.614 0.715
Table 5 1995-2004 Per Capita GDP And GDP Growth Rate Statistical Data
year 1995 1996 1997 1998 1999 2000 2001 2002 2003 2004 Per-capita GDP(ten thousand yuan RMB) 1.027 1.151 1.244 1.328 1.400 1.574 1.710 1.893 2.430 2.966 GDP increasing rate(%) 12.6 12.02 8.2 11.3 11.2 11.4 11.5 13.0 16.6 17.1
D. Estimation of model time varying parameter
According to system time varying parameter recursive
estimation formula of expression (8) and the initial value
of time varying parameter, a series of estimation of time
varying parameter can be obtained as table 6 to 7.
E. Forecast of time varying parameter
By time varying parameter track estimation series in
table 6, establish auto-recursive model of time varying
parameters and forecast time varying parameters.
According to
FPE
rule, respectively build models asfollow:
α
ˆ
1(
k
)
:AR
(
3
)
model;α
ˆ
2(
k
)
:AR
(
4
)
model;)
(
ˆ
1
k
β
:AR
(
4
)
model;β
ˆ
2(
k
)
:AR
(
3
)
model;β
ˆ
3(
k
)
:)
4
(
AR
model;β
ˆ
4(
k
)
:AR
(
4
)
model;β
ˆ
5(
k
)
:AR
(
2
)
model. Following forecast method above, respectively
process parameter forecasting when k equals 8,9,10, table
8 is parameter forecast result.
F. Road accidents forecasting
Based on time varying parameter forecast result in
table 8 and formulation of
y
(
k
)
nexth
step, theforecast of road traffic accidents is carried through. Table
9 shows the forecast of accidents.
From the forecast result of road traffic accidents
multi-level recursive forecasting method, it can be seen
that the road traffic accidents forecast in 2002、2003 and
2004 respectively is 749、707 and 629 men, real value
respectively is 724、 689 and 652 men, relative error
respectively is 3.453%、 2.612% and 3.528%, average
relative erroris 3.198%, so the forecast result is good. It
can be proved that dynamic system multi-level recursive
method can be used to forecast road accidents.
To compare the forecast precision, this paper build a 2
rank auto- regressive forecast model according to road
accidents statistic data of the same years, table 9 shows
the forecast result. On the basis of forecast data, because
of applying time varying parameter, the forecast
accuracy of road accidents multi-level recursive forecast
model is higher thanauto- regressive forecasting model,
and its average relative error is less. Ⅴ Conclusions
Limited by the imperfection of road accidents statistic
data of our country at present and the lack of effective
and perfect statistic of road traffic relative information,
the statistic value’s time extent of road accidents and
variousforecast factors in this paper is short, this makes
the excellence of road accidents multi-level recursive
forecasting model can’t be represented better. If more
consummate statistic system of road accidents and its
causing factors are set up, better contained statistic data
of road accidents and its causing factors can be chosen to
build road accidents multi-level recursive forecasting
model more adapting to the trait of road traffic system.
The forecast of time varying parameter is the key of
road accidents multi-level recursive forecasting method.
The key of improving the forecast precise using
multi-level recursive forecasting method lies in the exact
forecast to time varying parameter, and that multi-level
analysis to time varying parameter will greatly increase
the difficulty of parameter’s forecast. In practical forecast,
it is hard to ensure that each parameter of each level can
be forecasted precisely, some error is likely to induce
large output error, which may make multi-level recursive
lose its superiority. So, generally, we only analyze the
second time series of system, and respectively forecast
the parameter using proper series forecast method, finally
process road accidents multi-level recursive forecast.
The exact forecast of road accidents is helpful to know
the knowledge of current and state of accidents in the
future and adopt corresponding measures early, so the
[image:5.612.68.539.67.169.2]
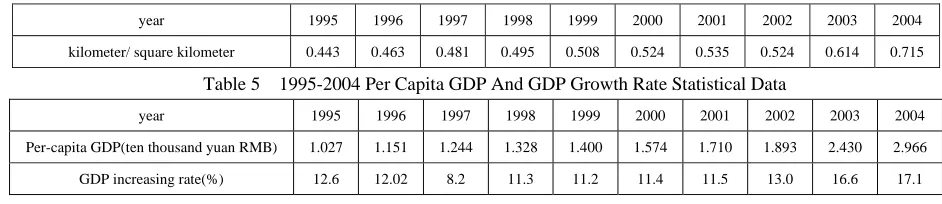
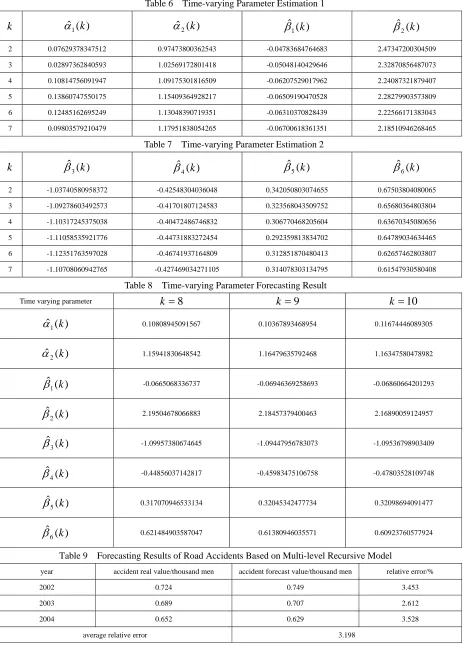
Table 6 Time-varying Parameter Estimation 1
k
α
ˆ
1(
k
)
α
ˆ
2(
k
)
β
ˆ
1(
k
)
β
ˆ
2(
k
)
2 0.07629378347512 0.97473800362543 -0.04783684764683 2.47347200304509 3 0.02897362840593 1.02569172801418 -0.05048140429646 2.32870856487073 4 0.10814756091947 1.09175301816509 -0.06207529017962 2.24087321879407 5 0.13860747550175 1.15409364928217 -0.06509190470528 2.28279903573809 6 0.12485162695249 1.13048390719351 -0.06310370828439 2.22566171383043 7 0.09803579210479 1.17951838054265 -0.06700618361351 2.18510946268465
Table 7 Time-varying Parameter Estimation 2
k
β
ˆ
3(
k
)
β
ˆ
4(
k
)
β
ˆ
5(
k
)
β
ˆ
6(
k
)
2 -1.03740580958372 -0.42548304036048 0.342050803074655 0.67503804080065 3 -1.09278603492573 -0.41701807124583 0.323568043509752 0.65680364803804 4 -1.10317245375038 -0.40472486746832 0.306770468205604 0.63670345080656 5 -1.11058535921776 -0.44731883272454 0.292359813834702 0.64789034634465 6 -1.12351763597028 -0.46741937164809 0.312851870480413 0.62657462803807 7 -1.10708060942765 -0.427469034271105 0.314078303134795 0.61547930580408
Table 8 Time-varying Parameter Forecasting Result
Time varying parameter
k
=
8
k
=
9
k
=
10
)
(
ˆ
1k
α
0.10808945091567 0.10367893468954 0.11674446089305)
(
ˆ
2k
α
1.15941830648542 1.16479635792468 1.16347580478982)
(
ˆ
1
k
β
-0.0665068336737 -0.06946369258693 -0.06860664201293)
(
ˆ
2
k
β
2.19504678066883 2.18457379400463 2.16890059124957)
(
ˆ
3
k
β
-1.09957380674645 -1.09447956783073 -1.09536798903409)
(
ˆ
4
k
β
-0.44856037142817 -0.45983475106758 -0.47803528109748)
(
ˆ
5
k
β
0.317070946533134 0.32045342477734 0.32098694091477)
(
ˆ
6
k
β
0.621484903587047 0.61380946035571 0.60923760577924Table 9 Forecasting Results of Road Accidents Based on Multi-level Recursive Model
year accident real value/thousand men accident forecast value/thousand men relative error/%
2002 0.724 0.749 3.453
2003 0.689 0.707 2.612
2004 0.652 0.629 3.528
[image:6.612.76.540.58.707.2]
References
[1]WANG Feng-lan; WEN Bang-chun, A Study on Synthetic Time Series Forecast of Stock Price Fluctuation[J]. Economic Survey .2005, (2): 64-65 [2] WANG Fu-jian; LI Tie-qiang; YU Chuan-zheng,Grey Verhulst Forecastive Model of Road Traffic Accidents[J]. Journal of Traffic and Transportation Engineering,2006,116(11):122-126
[3YAN Qiu; DU Wen,Application of the Fuzzy Model Identification in the Selection of Traffic Volume Forecast Models[J]. Journal of Traffic and Transportation Engineering,2006,4(1):41-44
[4] Ali P. Akgüngör; Osman Yıldız,Sensitivity analysis of an accident forecast model by the fractional factorial method[J]. Accident Analysis and Prevention,2007,39(1):63–68
[5] LI Xiang-yong;TIAN Peng; ZHANG Nan; LONG Jun-ren,
Multi-level Recursive Forecasting Method for Road Accidents[J].Journal of Southwest Jiaotong University ,2006,41(1):107-110
[6]HAN Bing;TANG You-hua; GUO Zi-zheng,Study on the Multi-level Recursive Method for Traffic Accident[J]. Communications Standardization,2005,11:89-91
[7]Ou ChangBao;Yu YaNan,Multi-Store Progressive Step Method of Short Time Traffic Flow Forecast[J]. Urban Roads Bridges & Flood Control,2004,5:21-23
[8] GUO Fei;ZHU Xue yu; WU Jian feng, Multilevel Recursive Nonstationary Time Series Model for Forecasting Mine Discharge[J].Journal of Nanjing University (Natural Sciences), 2000,36(3):300-304
[9]Florence Conche ; Miles Tight,Use of CCTV to determine road accident factors in urban areas [J].Accident Analysis & Prevention,2006,38(6):1197-1207
[10]Li Bang-xian,Dynamic System Forecasting Based on Multi-level Recursive Method [M].BeiJing: China Meteorology Press,1996,1-64