Abstract— Due to increasing incidents of cyber attacks, building effective intrusion detection systems are essential for protecting information systems security. It is an important issue for the security of network to detect new intrusion attack and also to increase the detection rates and reduce false positive rates in this area. Lacking a distinctive boundary definition among normal and abnormal datasets, discriminating the normal and abnormal behaviors seems too much complex. In this paper introduces the intrusion detection system based on Adaptive Resonance Theory (ART) and Rough Set for recognizing intrusion detection in computer network. Adaptive Resonance Theory (ART) is used to initially create raw clusters and then these clusters are refined using Rough Set. The theoretical background of the ART model consists of a body nonlinear mathematics to describe the constantly changing, nonlinear behavior of psychological and psychophysiological phenomena. We propose Rough set in the second stage for refinement mean of overcoming these complexities is proposed. Our approach allows us to recognize not only known attacks but also to detect suspicious activity that may be the result of a new, unknown attack. The experimental results on Knowledge Discovery and Data Mining-(KDD Cup 1999).
Index Terms—Network Security, ART, Rough Set
I. INTRODUCTION
Intrusion Detection Systems (IDS) are amongst the main tools for providing security in computer systems and network environment. A network intrusion attack encompasses a wide range of activities. It concludes attempting to destabilize the networks, gaining unauthorized access to files with privileges, or mishandling and misusing of software. As defined in [1], intrusion detection is “the process of monitoring the events occurring in a computer system or network and analyzing them for signs of intrusions. It is also defined as attempts to compromise the confidentiality, integrity, availability, or to bypass the security mechanisms of a computer or network”.
IDSs are categorized [2] into misuse detection and anomaly detection systems. Misuse detection systems detect known attacks using priori defined attack patterns and signatures. Anomaly detection systems detection attacks by observing deviations from normal behavior of the system, Manuscript received January 20, 2009. This work was supported in part by Nakhorn ratchasima College under Grant NMC00002 .
Kanok Prothives is with Dean of Faculty of Information Science, Nakhorn Ratchasima College, Nakhorn Ratchasima Province, 30000 THAILAND. (corresponding author to provide phone: 664-446-6111; fax: 664-446-5668; e-mail: kanok@ nmc.ac.th).
Surat Srinoy, was with Suan Dusit Rajabhat University, Bangkok, 10300 THAILAND. He is now with the Department of Computer Science, Suan Dusit Rajabhat University, Ratchasima Rd, Dusit 10300 THAILAND (e-mail: [email protected]).
network or their users [3, 4].
Intrusion detection is a critical component of secure information systems. Many approaches have been proposed which include statistical [5], machine learning [6], data mining [7] and immunological inspired techniques [8]. Statistical analysis techniques are widely used in anomaly detection [9]. Compared with machine learning methods, statistical analysis techniques have an advantage that they can run in real time without offline learning and relearning from training data, but its detection performance is not good enough [10].
The rest of the paper organized as follows: Section II discuses related works in the field of intrusion detection systems and describe a brief introduction to Adaptive Resonance Theory (ART) algorithm and Rough Set concept; in section III, experimental design section IV, experimental results and comparison. Finally, section V presents our conclusion, some discussion and future research.
II. RELATED WORKS
Most intrusion occurs via network using the network protocols to attack their targets. Twycross [11] proposed a new paradigm in immunology, Danger Theory, to be applied in developing an intrusion detection system. Alves et al. [12] presents a classification-rule discovery algorithm integrating artificial immune systems (AIS) and fuzzy systems. For example, during a certain intrusion, a hacker follows fixed steps to achieve his intention, first sets up a connection between a source IP address to a target IP, and sends data to attack the target [13].
Generally, there are four categories of attacks [11]. They are: 1) DoS (denial-of-service), for example ping-of-death, teardrop, smurf, SYN flood, and the like. 2) R2L :
unauthorized access from a remote machine, for example guessing password, 3) U2R : unauthorized access to local super user (root) privileges, for example, various “buffer overflow” attacks, 4) PROBING: surveillance and other probing, for example, port-scan, ping-sweep, etc. Some of the attacks (such as DoS, and PROBING) may use hundreds of network packets or connections, while on the other hand attacks like U2R and R2L typically use only one or a few connections.
A. Active Resonance Theory (ART)
ART refers to a class of self organizing neural architectures that cluster the pattern space and produce appropriate weight vector templates. Conventional artificial neural networks have failed to solve the stability-plasticity dilemma. A network remains open to new learning (remain plastic) without washing away previously learned codes. Too often, learning a new pattern erases or modifies previous training. If
Integrating ART and Rough Set Approach for
Computer Security
there is only a fixed set of training vectors, the network can be cycled through these repeatedly and may eventually learn all. In a real world, it will be exposed to a constantly changing environment; it may never see the same training vector twice. Under such conditions, back propagation will learn nothing. It will continuously modify its weights to no avail, never arriving at satisfactory settings.
ART networks and algorithm maintain the plasticity required to learn new patterns, while preventing the modification of patterns that have been learned previously.[14].
The basic architecture of adaptive resonance neural net involves three groups of neurons.
1. Input processing field –F1 layer (the comparison layer)
2. Cluster units –F2 layer (the recognition layer)
3. Reset Mechanism – that controls the degree of similarity of patterns placed on same cluster.
ART came in several flavors, both supervised and unsupervised. There are various unsupervised ART algorithm such as ART-1, ART-2, ART-3 and Fuzzy ART; and various supervised ones named with the suffix “MAP” such as ARTMAP, Fuzzy ARTMAP and Gussian ARTMAP[14].
[image:2.595.316.545.58.181.2]ART1 is the simples ART learning model specifically designed for recognizing binary pattern. The ART1 system consists of an attentional subsystem and an orienting subsystem as shown in figure 1.
Fig. 1 ART1 consists of an attention subsystem and an orienting subsystem[15].
[image:2.595.316.544.68.300.2]The attentional subsystem consists of two competitive networks, the comparison layer F1 and recognition layer F2 ,
[image:2.595.319.546.219.360.2]Fig.2 processing element X1i in Layer F1[16]
Fig.3 processing element X1i in Layer F2 [16]
Operation
The network starts by clamping the input at F1. Because the output of F2 is zero, G1(Gain1) and G2 (Gain2) are both on and the output of F1 matches its input. The pattern is sent to F2, and in F2 one neuron becomes active as shown in figure 1, 2. This signal is then sent back over the backward LTM, which reproduces a binary pattern at F1. Gain 1 is inhibited, and only the neurons in F1 which receive a 'one' from both x and F2 remain active. If there is a substantial mismatch between the two patterns, the reset signal will inhibit the neuron in F2 and the process is repeated.
1. Initialization:
where N is the
number of neurons in F1, M the number of
neurons in F2, 0 _ i < N,
and 0
≤
j <M. Also, choose the vigilance
threshold
ρ
, 0
≤
ρ
≤
1;
2. Apply the new input pattern x:
3. compute the activation values y0 of the neurons in
F2:
4. select the winning neuron k (0 ≤ k <M):
[image:2.595.57.293.392.589.2]where . denotes inner
product, go to step 7, else go to step 6. Note
that
essentially is the inner
product
,which will be large if and
near to each other;
6. neuron k is disabled from further activity. Go to step 3;
7. Set for all l, 0 ≤ l < N:
8. re-enable all neurons in F2 and go to step 2
B. Rough Set
Rough set theory is a formal methodology that can be employed to reduce the dimensionality of datasets as a preprocessing step to training a learning system on the data.Suppose that a dataset is viewed as a decision table T where attributes are columns and objects are rows. Let U denote the set of all objects in the dataset and A the set of all attributes such that
a U
:
→
V
a for everya
∈
A
where Va is the value set for attribute a. In adecision system, A is decomposed into the set C of conditional attributes and the set D of decisions attributes which are mutually exclusive and
C
∪ =
D
A
. For anyP
⊆
A
,
there is an equivalencerelation I(P) as follows:. 2
( ) {( , )
|
( )
( )}.
I P
=
x y
∈
U
∀ ∈
a
Pa x
=
a y
If
( , )
x y
∈
I P
( ),
then x and y are indiscernible by attributes from P. The equivalence classes of the P-indiscernibility equivalence relation I(P) are denoted[ ] .
x p
Given an equivalence relation I(P) for,
P
⊆
C
the lower approximation{
| [ ]
}.
PX
= ∈
x U
x p
⊆
X
The C-positive region of D is the set of all objects from the universe U which can be classified with certainty into classes of U/D employing attributes from C, that is,/
( )
.
c
x U D
POS D
CX
∈
=
∪
An attribute
c
∈
C
is dispensable in a decision table T ifPOS
( { })c−c( )
D
=
POS D
c( );
otherwise attribute cis indispensable in T. A set of attributes
R
⊆
C
is called a reduct of C if it is a minimal attributes subset preserving the condition:POS
R( )
D
=
POS D
c( ).
With regard to computational complexity and memory requirements, however, the calculation of all reducts in an NP-hard task [17]. To solve this problem, we use QUICKREDUCT algorithm [18] shown below for feature selection of classification. The algorithm uses the degree of dependency
γ
p D
( )
as follows:||
( ) ||
( )
,
||
||
P
POS
D
P D
U
γ
=
For any set A, ||A|| denotes the cardinality of A. As a criterion for the attribute selection as well as a stop condition. This algorithm does not always generate a minimal reduct since
γ
p D
( )
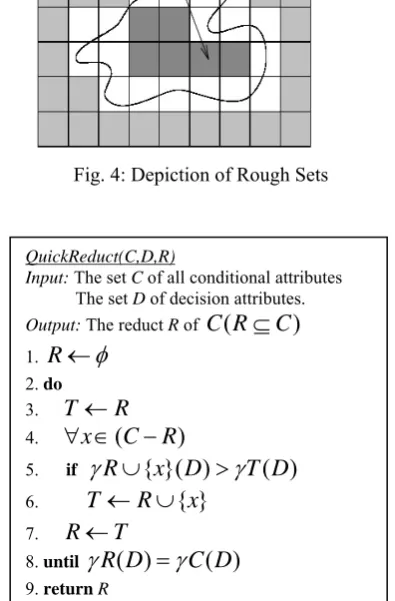
is not a perfect heuristic. [image:3.595.315.524.337.486.2]It does result in only one close-to-minimal reduct, though it is useful in greatly reducing dataset dimensionality. The average complexity of QUICKREDUCT algorithm was experimentally determined to be approximately O(n) for a dimensionality of n though the worst-case runtime complexity is O(n!)
Fig. 4: Depiction of Rough Sets
Fig. 5: QuickReduct Algorithms
To illustrate the operation of Rough Set Attribute Reduction (RSAR), an example dataset is presented as in Table 1
QuickReduct(C,D,R)
Input: The set C of all conditional attributes
The set D of decision attributes. Output: The reduct R of
C R
(
⊆
C
)
1.
R
←
φ
2.do 3.
T
←
R
4.
∀ ∈
x
(
C
−
R
)
5. if
γ
R
∪
{ }( )
x D
>
γ
T D
( )
6.T
← ∪
R
{ }
x
7.
R
←
T
[image:3.595.326.524.411.712.2]Table 1: Example Dataset
Information can be incomplete, inconsistent, uncertain, or all three. We adopted the rough set algorithm for data cleaning as proposed by Sarjon and Mohd. Noor [19]. To use rough sets by the equivalence up to discernibility, this attribute reduction will have to be minimal with respect to content of information.
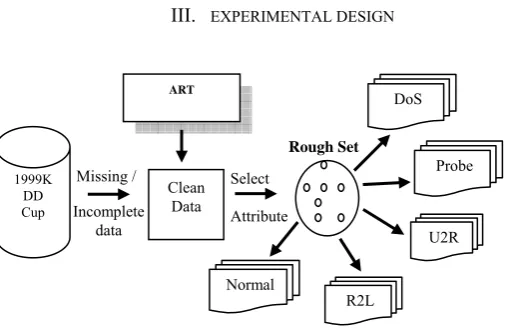
III. EXPERIMENTAL DESIGN
Fig. 6 Overall Intrusion Detection Systems
In our method have the three steps (Figure 6). First step is cleaning for handle missing and incomplete data. Second step using ARTalgorithms for select the best attribute and feature selection and the last step for clustering group of data using rough set.
The pre-processor module performs the following tasks: 1. Identifies the attributes and their value. 2. Convert categorical to numerical data. 3. Data normalization.
4. performs redundancy check and handle about null value.
5. Initializes all the necessary parameters (if any).
IV. PRE-EXPERIMENTAL
In this experiment, we use a standard dataset the raw data used by the KDD Cup 1999 intrusion detection contest [20].
This database includes a wide variety of intrusions simulated in a military network environment that is a common benchmark for evaluation of intrusion detection techniques. In general, the distribution of attacks is dominated by probes and denial-of-service attacks; the most interesting and dangerous attacks, such as compromises, are grossly under-represented [21]. The data set has 41 attributes for each connection record plus one class label. There are 24 attack types, but we treat all of them as an attack group. A data set of size N is processed. The nominal attributes are converted into linear discrete values (integers). After eliminating labels, the data set is described as a matrix X,
which has N rows and m=41 columns (attributes). There are md=8 discrete-value attributes and mc = 33 continuous-value
attributes.
We ran our experiments on a system with a 1.6 GHz Pentium M processor and 512 MB DDR RAM running Windows XP. All the preprocessing was done using MATLAB®. MATLAB’s Toolbox [22] was used for ART clustering, whereas rough set operations were done in ROSETTA [23]. ROSETTA is a software toolkit capable of performing all the operations for data processing and classification. In practice, the number of classes is not always known beforehand. There is no general theoretical solution to finding the optimal number of clusters for any given data set. We choose k = 5 for the study.
V. EXPERIMENTAL RESULT
A. Data Processing
A considerable amount of data-preprocessing had to be undertaken before we could do any of our modeling experiments. It was necessary to ensure though, that the reduced dataset was as representative of the original set as possible. The test dataset that previously began with more than 300,000 records was reduced to approximately 18,216 records. Table 2 shows the dataset after balanced among category for attack distribution over modified the normal and other attack categories. Preprocessing consisted of two steps. The first step involved mapping symbolic-valued attributes to numeric-valued attributes and the second step implemented non-zero numerical features. We reduce the dimensionality of this data set from 41 to 10 attributes are
duration, service, src_bytes, dst_byte, count, srv_count, serror_rate, dst_host_srv_count, dst_host_diff_srv_rate, and dst_host_same_src_port_rate.
B. Performance Measure
Standard measures for evaluating IDSs include detection rate, false alarm rate, trade-off between detection rate and false alarm rate [24], performance (Processing speed +
propagation + reaction), and Fault Tolerance (resistance to
attacks, recovery, and subversion). Detection rate is computed as the ratio between the number of correctly detected attacks and the total number of attacks, while false alarm (false positive) rate is computed as the ratio between the numbers of normal connections that are incorrectly misclassified as attacks [25]. These are good indicators of performance, since they measure what percentage of
Attributes Instanc
e Service Count Srv_coun t
Decision field
1 http 1 4 Yes
2 ftp_data 2 3 Yes
3 Private 1 5 No
4 http 1 1 Yes
5 Domain_ u
2 3 No
6 http 0 2 No
1999K DD Cup
Missing /
Incomplete data
Clean Data
Rough Set DoS ART
Select
Attribute
Normal
Probe
U2R
[image:4.595.27.283.379.544.2]intrusions the system is able to detect and how many incorrect classifications are made in the process.
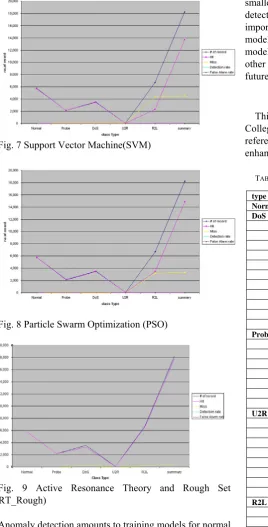
[image:5.595.59.328.91.619.2]Fig. 7 Support Vector Machine(SVM)
Fig. 8 Particle Swarm Optimization (PSO)
Fig. 9 Active Resonance Theory and Rough Set (ART_Rough)
[image:5.595.312.555.277.792.2]Anomaly detection amounts to training models for normal traffic behavior and then classifying as intrusions any network behavior that significantly deviates from the known normal patterns and to construct a set of clusters based on training data to classify test data instances. In fig.7, fig.8, fig.9 are result from our experiments.
VI. CONCLUSION AND FUTURE WORKS
Rapid expansion of computer network throughout the world has made security a crucial issue in a computing environment. Anomaly-based network intrusion detection is a complex process. The central focus of the research reported in this paper we presented hybrid architecture for intrusion detection. The architecture combines the two approaches, the
anomaly and misuse intrusion detection, trying to take benefit of their advantages through their cooperation.
Feature selection also gave equivalent accuracy with a smaller set of features. These results are very promising since detection accuracy at low false-positive rates is extremely important in IDS. Intrusion detection model is a composition model that needs various theories and techniques. One or two models can hardly offer satisfying results. We plan to apply other theories and techniques in intrusion detection in our future work.
ACKNOWLEDGMENT
This work is partially supported by Nakhorn Ratchasima College. Authors would like to thanks the two anonymous referees for the constructive comments that helped to enhance the quality and presentation of this paper.
TABLE 2. NUMBER AND TYPES OF ATTACKS IN TRAINING DATA SET
type Subtype amount %
Normal 60,593 19.481
DoS
apache2 794 0.255
pod 87 0.028
smurt 164,091 52.757
back 1,098 0.353
land 9 0.003
mailbomb 5,000 1.608
neptune 58,001 18.648
processtable 759 0.244
teardrop 12 0.004
udpstorm 2 0.004
Total 222,853 73.901
Probe
Ipsweep 306 0.098
portsweep 354 0.114
Saint 736 0.237
Mscan 1,053 0.339
Nmap 84 0.027
Satan 1633 0.525
Total 4,166 1,339
U2R
buffer_overflow 22 0.007
loadmodule 2 0.001
perl 2 0.001
ps 16 0.005
rootkit 13 0.004
sqlattack 2 0.001
xterm 13 0.004
Total 70 0.023
R2L
guess_passwd. 4,367 1.404
multihop 18 0.006
named. 17 0.005
phf. 2 0.001
sendmail. 17 0.005
snmpgetattack. 7,741 2.489
xlock. 9 0.003
xsnoop. 4 0.001
ftp_write. 3 0.001
httptunnel. 158 0.051
imap. 1 0.000
snmpguess. 2,406 0.774
Spv. - 0.000
warezclient. - 0.000
warezmaster. 1,602 0.515
worm. 2 0.001
Total 16,347 5.255
[image:5.595.305.557.283.788.2]REFERENCES
[1] D.S Bauer and M.E Koblentz, “NIDX- an expert system for real-time network intrusion detection,” Proceedings of the Computer Networking Symposium, pp. 98-106, 1988.
[2] M. Amini, R. Jalili, Network-Based Intrusion Detection Using Unsupervised Adaptive Resonance Theory (ART), Proceedings of the 4th Conference on
Engineering of Intelligent Systems (EIS 2004), Madeira,
Portugal, 2004.
[3] R.Coolen and H.A.M. Luiijf, “Intrusion Detection: Generics and State-of-the-Art”, Research and Technology Organization (RTO) Technical Report 49, 2002.
[4] S. Kummar, “Classification and Detection of Computer Intrusions”, Ph.D. Thesis, Purdue University, 1995.
[5] R. Bace and P. Mell, “Intrusion Detection Systems,” NIST Special Publication on Intrusion Detection System, 31 November 2001.
[6] A.Sundaram, “An introduction to intrusion detection, Crossroads,”: The ACM student magazine, 2(4), April 1996.
[7] D. Denning, “An intrusion-detection model,” In IEEE computer society symposium on research in security and privacy, pp. 118-131, 1986.
[8] T.Lane, “Machine Learning techniques for the computer Security,” PhD thesis, Purdue University, 2000.
[9] Madori Asaka, Takefumi Onabuta, Tadashi Inoue, Shunji Okazawa, and Shigeki Goto, “A new intrusion detection method based on discriminant analysis,” Oakland, pp.130-143, May 2001.
[10] Ming Tang, Song-Can Chen, Yi Zhuang and Jia Liu, “Using Statistical Analysis and Support Vector Machine Classification to Detection Complicated Attacks,” Proc. Of the Third International Conference on Machine Learning and Cybernetics IEEE Computer Society, Shanghai, China, August 26-29, 2004.
[11] J. Twycross , Immune Systems, “Danger Theory and Intrusion Detection”, presented at the AISB 2004 Symposium on Immune System and Cognition, Leeds,
U.K., March 2004.
[12] R.T. Alves, M.R.B.S. Delgado, H.S. Lopes, A.A. Freitas, “An artificial immune system for fuzzy-rule induction in data mining”, Lecture Notes in Computer Science, Berlin: Springer-Verlag,Vol.3242,
pp.1011-1020, 2004.
[13] W. Lee and S. Stolfo, Data Mining Approaches for Intrusion Detection, Proceedings of the 7th USENIX security symposium, 1998.
[14] A. Morteza and J. Rasool, “Network-Based Intrusion Detection Using Unsupervised Adaptive Resonance Theory (ART)”, http://nsc.sharif.edu/resources/papers/
[15] T. Tanaka and A. Weitzenfeld, “Adaptive Resonance Theory”, http://cannes.itam.mx/Alfredo/English/Publications/Nslbook/MitPress /157_170.CH08.pdf.
[16] Z. Mbaitiga, “Adaptive Resonance Theory1 (ART1) Neural Network Based Horizontal and Vertical Classification of 0-9 Digits Recognition”, Journal of Computer Science, vol. 3, Nov.2007, pp.869-873.
[17] Q. Shen and A. Chouchoulas, (2001), “Rough Set-Based Dimensionality Reduction For Supervised And Unsupervised Learning”, International Journal of Applied Mathematics and Computer Science, Volume 11 (Issue 3), pp. 583–601.
[18] J. Katzberg and W. Ziarko, (1996), “Variable Precision Extension Of Rough Sets”, In W. Ziarko (ed.) Fundamenta Informaticae, Special Issue on Rough Sets, Volume 27 (Issue 2-3), pp. 155–168.
[19] D. Sarjon and Mohd Noor Md Sap, (2002), “Association Rules Using Rough Set and Association Rule Methods”, Proc.of 7th Pacific Rim International Conference on Artificial Intelligence (PRICAI-02),Tokyo, Japan, August 18-22, pp. 238-243.
[20] KDD Data Set, 1999;
http://kdd.ics.uci.edu/databases/kddcup99/kddcup99.html.
[21] P. Laskov, K. Rieck, C. Schäfer, K.R. Müller, (2005), “Visualization Of Anomaly Detection Using Prediction Sensitivity”, Proc.of Sicherheit, April 2005, pp.197- 208.
[22] Math Works, (2001), “Statistical Toolbox For User’s Guide”, Math Works.
[23] K. Cios, W. Pedrycz, R. Swiniarski, (1998), “Data Mining-Methods For Knowledge Discovery”, Kluwer Academic Publishers, London. [24] A. Lazarevic, A. Ozgur, L. Ertoz, J. Srivastava, and V. Kumar, (2003),
“A Comparative Study Of Anomaly Detection Schemes In Network Intrusion Detection”, In SIAM International Conference on Data Mining, 2003.
![Fig.2 processing element X1i in Layer F1[16]](https://thumb-us.123doks.com/thumbv2/123dok_us/1317379.662068/2.595.316.544.68.300/fig-processing-element-x-i-in-layer-f.webp)