Energy Efficient Data Processing in Sensor
Networks
Prakash G L*, Thejaswini M*, S H Manjula*, K R Venugopal*, L M Patnaik**
∗†Abstract—The sensor nodes in a Wireless Sensor Network(WSN) are tiny devices operating on bat-teries and employing low-power radio transceivers to enable communication. Minimizing energy consump-tion has been a major objective at all levels in sen-sor networks. In this paper, we present, a data pro-cessing scheme that maintains the user-specified qual-ity of data requirement while significantly reducing the overall energy consumption. Specifically, since communication dominates power usage in sensor net-works, it exploits end-user temporal coherency toler-ances to reduce the amount of information transmit-ted by individual nodes. We compare our proposed scheme against an existing data aggregation scheme with a local sensor cache. We present experimental results measuring both power savings and also the quality of data for group-by queries. These results show that our method can reduce power consumption by up to 60 percent without any loss in the quality.
Keywords: Aggregation, Communication, Power Con-sumption, Query Processing.
1
Introduction
For all the sensor network applications, the overall tasks of sensor networks are monitoring, collecting and processing the sensed data from the covered area and sending the data back to the observers. However, the computation abilities, storage capacities and power of sensors are limited. Communication bandwidth of sensor networks is also limited. This brings a lot of challenges. A popular application of sensor networks is event monitoring, such as fire detection in forests and enemy monitoring in battlefields.
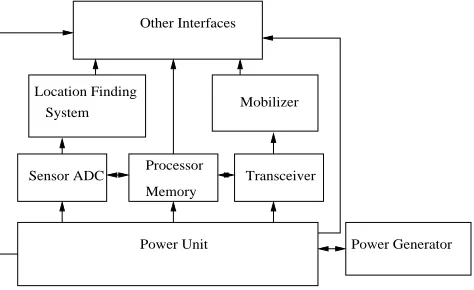
Figure 1 illustrates the generic architecture of a sensor node. It is composed of a power unit, processing unit, sensing unit and communication unit. The processing unit is responsible to collect, process signals captured from sensors and transmit them to the network. The processing unit is used to compute and process the data locally. Sensors are devices that produce a measurable
∗Department of Computer Science and Engineering, University
Visvesvaraya College of Engineering, Bangalore University, Banga-lore 560 001, [email protected]
†*Vice Chancellor, Defence Institute of Advanced
Technol-ogy(Deemed University), Pune, India
Other Interfaces
System Mobilizer Location Finding
Sensor ADC Processor Memory
Transceiver
[image:1.612.311.548.186.331.2]Power Unit Power Generator
Figure 1: Sensor Node Hardware
response to a change in a physical condition like temper-ature and pressure. The wireless communication channel provides a medium to transfer signals from sensors to ex-ternal world or to a computer network and helps to estab-lish and maintain wireless sensor network which is usually ad-hoc. Advances in Micro Electro Mechanical System (MEMS) technology and its associated interfaces, signal processing and Radio Frequency(RF) circuitry have en-abled the development of wireless sensor nodes.
Contribution: To propose a solution to evaluate queries, query optimization for specific types of queries for data dissemination and processing in sensor networks. In a simulation study the performance of data processing approach and the performance of different query plans are compared. Data processing techniques improve the energy efficiency; a typical parameter measure of performance in sensor networks.
2
RELATED WORK
The evolution of sensor networks, challenges and op-portunities is presented in [1]. A Survey of number of data processing methods, communication architectures and the features influencing the sensor netwok design have been described in [2].
Sabbineni et al., [3] presented a new dissemination protocol for data collection in WSN. It uses location information to reduce redundant transmissions, thereby saving energy. Virtual grid formation is used to achieve location aided flooding. This reduces the redundant transmissions of same packet by a node resulting in energy saving.
Kalpakis et al., [4] have formulated the maximum-lifetime data-gathering problem has a linear programming for-mulation by taking data aggregation in to consideration and presented a polynomial-time algorithm to solve the problem. although this optimization framework yields satisfactory performance it makes the simplistic assumption of perfect data correlation, where intermedi-ate sensor node can aggregintermedi-ate any number of incoming packets into a single packet. A perfect data correlation can also be found in [5], which analyzes the performance of data-centric routing schemes with in-network aggre-gation.
3
PROBLEM DEFINITION
Given a WSN of size N, where (ni, nj) are connected
if both the nodes i and j and the network model is connected graph G(N,E) where the node ni and nj are
connected iff they are able to communicate and transmit data among themselves, the objectives are
• To improve a data processing method to reduces the data size.
• To improve a communication model to lower the number of transmissions.
• To reduce energy by sending the data to be trans-ferred to the basestation.
3.1
Assumptions
1. A query issued in an environment typically speci-fies sensing types(photo, light, temperature, loca-tion, acceleraloca-tion, magnitude), source node, set of predicates and sample period.
2. Every node holds a symmetric connectivity list of its neighbours.
a
c d
f(a,b)
f(c,d,f(a,b)) Server
n1
n2
n3 n4
[image:2.612.307.549.56.202.2]n5 n6
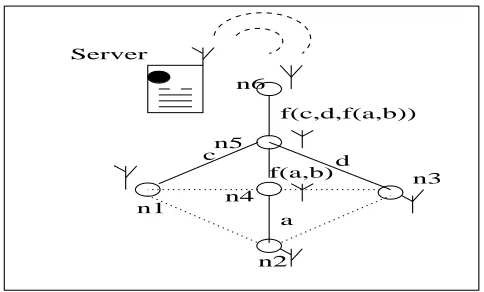
Figure 2: In-network Aggregation at Nodes
3. Every node holds an interest cache and a data list.
4. All nodes have similar capability and equal signifi-cance.
3.2
Example
Consider the following example, where an average read-ing is computed over a network of six nodes arranged in a three-level routing tree in Figure 2. In the server based approach, where the aggregation occurs at an external server, each sensor sends its data directly to the server. This requires a total of sixteen message transmissions. Alternatively, each sensor may compute a partial state record, consisting of (sum, count), based on its data and that of its children, if there are any. This requires a total of only six message transmissions to server.
In-network aggregation and query processing typically in-volve query propagation and data aggregation. To push query to every node in a network, an efficient routing structure have to be established. Transmitting all raw data to the sink nodes consumes more energy than push-ing computation into the network. It requires different optimizing techniques for in-network data processing in sensor networks.
4
SYSTEM DESIGN
4.1
Network Architecture
A sensor network is modeled as a connected graphG(N, E), where sensor nodes are represented as the set of verticesN and wireless links as the set of edgesE.
Data(D)=1MB Energy(E)=0.01J Node 1
(19,34)
(100,20)
(150,10) (150,134) (100,80)
(64,34) (150,34) Energy(E)=0.01J
Data(D)=1MB
Energy(E)=0.01J Data(D)=1MB
Energy(E)=0.01J Data(D)=1MB Node 0
Node 2
Node 3
Node 4 Node 5
Node 6
741KB
1096KB
355KB 53KB
10B
244.6KB 163.8KB Energy(E)=1J
Data(D)=10B
Energy(E)=1J Data(D)=10B
[image:3.612.302.540.57.202.2]Energy(E)=1J Data(D)=10B
Figure 3: Sensor Node Deployment
interested in collecting the required data possible from all these sensors at a sink node then to end user. Given some energy constraints in each of these sensors. Figure 3, shows a sample scenario with six source nodes, one sink node(node 0). Each node is labelled with its (x,y) coordinates, its available data and energy. The goal is to extract the data to the sink node. The arrows indicate the direction of data sent.
4.2
Query Model
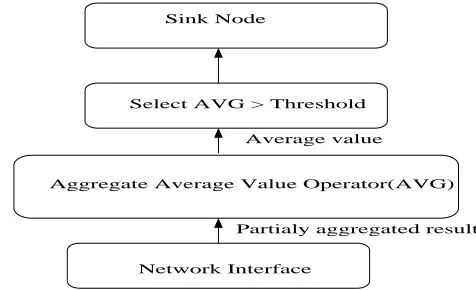
The order in which a node samples its sensors conven-tionally referred to as a query plan, This can be a crucial factor affecting the energy consumed by the sensor net-work. Such orderings for the nodes involved in a query are an essential part of query plan [6]. The data collected by the sink node can be used to determine energy-efficient query plans for the nodes participating in the query. It is important to note that the cost of determining the optimal query for a node depends on the complexity of the query. While for simple queries, a node may itself be able to derive the optimal query plan by spending a small amount of energy or memory, for complex queries, it might be desirable to delegate this task to the energy or memory rich sink node. Figure 4, shows the query for the sink node, which contains an AVG operator to compute the average value over all sensor readings and SELECT operator that checks if the result is above threshold.
The goal of the In-network query workload design is to reveal the performance characteristics of in-network query processing techniques. The query workload as follows.
Sink Node
Select AVG > Threshold
Network Interface
Average value
[image:3.612.49.291.62.202.2]Partialy aggregated result Aggregate Average Value Operator(AVG)
Figure 4: Query plan at the Sink Node
4.2.1 Data acquisition query workload
In this section, the different types of query plans are presented. In the workload, Q1-Q2 are data acquisition queries.
Q1: Single Sensory Attribute Projection and Selection
SELECTnode id, photo FROMsensors WHERElight≥C
Q1 studies the performance of selection queries on a sensory attribute. In each epoch (sample interval) of the query, only those nodes whose recent photo readings satisfy the predicate will send out their data towards the sink even though all nodes in the network acquire their own light readings. The set of nodes that satisfy the predicate may vary from epoch to epoch depending on the data. The parameter C in the predicate is a user-specified constant value. It can be changed to achieve different selectivities of the predicate.
Q2: Conjunctive Selection on Multiple Sensory At-tributes
SELECTnode id, photo, temperature FROM sensors
WHEREphoto ≥C1 ANDtemperature≥C2
optimized by sending only readings which qualifies the criteria. Here the query condition is checked locally at the sensor nodes. The packets are transmitted only if the conditions are true.
4.2.2 Aggregation Query Workload
In this section, present the four SQL queries in the current version of query workload. In the workload, Q3-Q4 are aggregation queries. All queries in the workload are continuous queries.
Q3: Duplicate-Sensitive Simple Aggregation
SELECT SUM(photo) FROMsensors
Q3 tests the performance of the aggregation schemes for duplicate-sensitive aggregates. The duplicate-sensitivity of the aggregate requires extra effort in multi-path routing in order to ensure the correctness of query results.
Q4: Aggregation with Sensory Attribute Selection
SELECT AVG(photo) FROMsensors WHEREphoto ≥C
In comparison with Q3 and Q4 adds a selection predicate on the aggregation attribute. The predicate selects a subset of the nodes in the network to participate in the aggregation and this subset may change over epochs of the query depending on the data.
4.3
Data Processing
Data stored in sensor networks can be viewed as local, external and data centric. In local storage, data is stored on nodes locally; to retrieve data a query floods the network. In external storage, data is sent to sink node without waiting for the query. In data centric storage all communication is for named data.
4.3.1 Broadcasting Query Message
This is the simplest scheme. Sink node broadcast query message(BQ). Each source sensor node sends a data packet consisting of a record towards the sink.
Computation will only happen at the sink after all the records have been received. This may consume more power to communicate with far nodes and computation at sink node.
4.3.2 Processing Data Locally
Instead of sending all the data to the sink node, send the locally processed data to the sink which will optimize the power consumption and communication radio energy,
e.g.,instead of sending all the raw temperature readings, we send partially aggregated(PA) data such as average of every seven readings from intermediate node and send it to the sink for further processing.
4.3.3 Packet Merging
In Packet Merging(PM), instead of sending each sensor readings separately in a packet we can merge several records into large packet, consisting of many readings. Packet merging is the only way to reduce the number of bytes transmitted. This will save power consumption of source node and reduces the computation cost of sink node.
4.4
Energy Model
To process a query, each source node samples its sensed data and checks if resulting readings satisfy the rele-vant predicates. To estimate the power consumption of per-node energy consumption Mica2 energy mode is used.
The total energy consumed Tenergy is the sum of
energy consumed by RADIO(Eradio), CP U(Ecpu),
LEDs(Eleds), ADC(Eadc), M EM ORY(Ememory) and
V OLT AGE(Evoltage).
The values ofEledsandEadcare insignificant, then
Equa-tion becomes
Tenergy=Eradio+Ecpu+Ememory+Evoltage (1)
The average energy consumption Aenergy of a node is
given by sum of total energy Tenergy by number of
nodesN
Aenergy=
X
Tenergy/N (2)
The cost for transmitting dataEctransin terms of packet
sizes, the distance between the sender and receiverdcan be formulated .
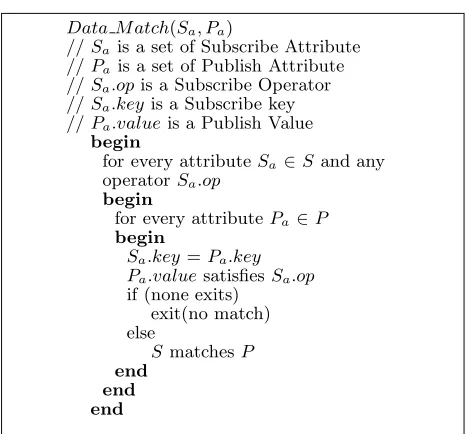
Table 1: Data Matching Rules
Data M atch(Sa, Pa)
//Sais a set of Subscribe Attribute //Pa is a set of Publish Attribute //Sa.opis a Subscribe Operator //Sa.keyis a Subscribe key //Pa.valueis a Publish Value
begin
for every attributeSa∈S and any operatorSa.op
begin
for every attribute Pa ∈P begin
Sa.key=Pa.key Pa.valuesatisfiesSa.op
if (none exits) exit(no match) else
S matchesP end
end end
where Etx is the cost for using the transmitter (i.e., the
bit cost for the transmitter electronics) andEampfor the
amplifier cost.
5
Algorithm
Data is exchanged when there are matching between sub-scriptions and publications. Algorithm for matching rules is given in Table 1. Since diffusion is based on the core concept of subject-based routing, it is very important to make sure attributes in publications, subscriptions and filters match. For both Publish/Subscribe and Filters interfaces, matches are determined by one way match applying the following rules between the attributes as-sociated with publish (P) and subscribe (S).
6
PERFORMANCE EVALUATION
Simulation results performed on a test bed using TOSSIM simulator for TinyOS. Using PowerTOSSIM to estimate the total energy consumption of in-network data processing approaches. To estimate the power consump-tion of the mica2 sensor node mica2 energy mode is used. Table 2, shows energy dissipation for mica2 mote .
6.1
Simulation Setup
[image:5.612.304.554.95.223.2]In this section, simulation studies are compare the perfor-mance of the packet broadcasting, packet merging with packet aggregation methods with respect to its lifetime using TOSSIM simulator in windows operating system.
Table 2: The Energy Dissipation of Operations for Mica2
Operation Energy Dissipation(mA)
CPU Active 8.93
CPU Idle 4.13
CPU ADC Noise Reduction 1.0
CPU Power Down 0.103
CPU Power Save 0.110
CPU Standby 0.216
CPU Initialization 3.2
Radio Default Power 15.00
EEPROM Read 6.24
EEPROM Write 18.40
[image:5.612.319.536.352.501.2]Different number of Sensors are randomly distributed in a query region over 100m x 100m area. The Simulation is run for 60 seconds, and each simulation run for differ-ent network size. The simulation parameters for query processing are listed in Table 3.
Table 3: Simulation Parameters for Query Plan
Parameter Type Test Value
Number of nodes 5,20,50,65,75,85,100
Sink node Mote 0
Radio model Lossy
Distance scaling factor 1.0 with empirical radius Simulator hardcoded 4Mhz
Epoch Period 1000ms-10000ms
Aggregate operations SUM,AVG,MAX
Sensor type Photo sensor,
Temperature sensor, Demo sensor, Accelerometer sensor, Magnetometer sensor
6.2
Performance Analysis
From the simulation results, Figure 5, illustrates the performance analysis of a simple query(SQ) of sensing photo reading above some threshold value and increased workload query of detecting photo, temperature, ac-celerometer and magnetometer in x and y directions, and all readings above some threshold values which influences the performance metrics such as lifetime of the network. Energy consumption for sparse networks is increases linearly and for dense networks simple query increases faster than workload query.
255 260 265 270 275 280 285
0 20 40 60 80 100
Average Dissipated Energy Node(mJ)
Network Size Simple query
[image:6.612.52.300.59.240.2]Workload query
Figure 5: Average Dissipated Energy versus Network Size for different query type
50 100 150 200 250 300
0 20 40 60 80 100
Average Dissipated Energy Node(mJ)
Network Size Packet broadcasting
Packet merging Packet averaging
Figure 6: Average Dissipated Energy for In-Networks Data Processing Techniques
nodes, and packet merging. Without in-network data processing, each node has to send a data packet for each node whose route goes through n number of nodes, so energy consumption increases very fast.
Packet broadcasting consists of all raw data, consumes more energy Packet merging consumes less energy than packet broadcasting as it consists of several sensor readings merged in a packet. Packet aggregation in in-network data processing method consumes less energy compared to other methods, it reduces redundancy in sensor readings.
7
CONCLUSIONS
The Energy optimization techniques are proposed such as network data processing methods such as, query
optimization plans, processing data locally and packet merging. As compared to the existing data processing and communication methods, our approaches are more effective to minimize the total processing and transmis-sion energy consumed by the network.
Future challenges include running queries from multiple users for long time over a sensor network, sharing the resources among the queries to balance and minimize overall resource usage.
References
[1] Che-Yee Chong and Srikanth P. Kumar, “Sensor Net-works: Evolution, Opportunities and Challenges,”In Proceedings of the IEEE, vol. 91, pp. 1247–1256, Au-gust 2003.
[2] I. F. Akyildiz, W. Su, Y. Sankarasubramaniam and E. Cayirci, “Wireless Sensor Networks: A Survey,”IEEE Communication Magazine, vol. 40, pp. 102–114, Au-gust 2002.
[3] Harshavardhan Sabbineni and Krishnendu Chakrabarty, “Location-Aided Flooding: An Energy-Efficient Data Dissemination Protocol for Wireless Sensor Networks,” inIEEE Transactions on Computers, vol. 54, pp. 36–46, January 2005.
[4] K. Kalpakis, K. Dasgupta, and P. Namjoshi, “Effi-cient Alogorithms for Maximum lifetime Data gath-ering and Aggregation in Wireless Sensor Networks,” in Comput. Netw. J.,, vol. 42, pp. 697–716, August 2003.
[5] B. Krishnamachari, D. Estrin, and S. Wicker, “Mod-elling data-centric routing in wireless sensor net-works,” in Univ. Southern California Comput. Eng.,, pp. 02–14, 2002.
[image:6.612.53.296.285.465.2]