Abstract–With the rapid enhancement of product functions and performances, the cycle of technological innovation is becoming shorter. Accordingly, it is difficult to meet various customer needs due to increased development costs and the shortened development period. This also has a significant impact on establishing corporate strategies. Successful product development is essential to the survival of a company in the competitive market. A company needs to identify the diverse risk factors that might occur in the development process, measure how much they will affect the development process, and create strategies and tactics to counter them. Against this backdrop, this paper draws upon the possible risks in the product development project and presents how to measure these risk degrees and the integrated risk degrees of the whole project in order to more effectively manage them. In other words, the paper shows how to determine the impact values of risks in each development phase, the probability of risk occurrences and the risk degrees and how to calculate the integrated risk degree of each phase.
Index Terms–product development project, impact value, probability of risk occurrences, risk degrees, integrated risk degrees
I. INTRODUCTION
A product development project can determine the success and failure of the manufacturing industry. However, many companies see such projects as extremely difficult tasks because of the high investment costs and chances of failure. Approximately 80 % of globally-conducted product development projects fail while they are in progress. Even the 20% of completed projects took more costs and time than expected [1]. That was because they failed to recognize the risks and risk degrees in advance and there was no systematic way to effectively deal with the risks that occurred in the middle of the project.
D. W. Choi. Master student, Department of Systems Management Engineering, Sungkyunkwan University, Suwon 440-746, Korea(e-mail: [email protected]).
J. S. Kim. Doctoral student, Department of Systems Management Engineering, Sungkyunkwan University, Suwon 440-746, Korea(e-mail: [email protected]).
[image:1.595.320.556.178.317.2]H. G Choi. Professor, Department of Systems Management Engineering, Sungkyunkwan University, Suwon 440-746, Korea (corresponding author)
Fig. 1 Integrated processes for product development
As seen in Fig.1, a product development project is evolving into an integrated process of various concepts [2]. Successful product development requires total quality management for quality improvement, change management to deal with internal and external changes, risk management against risk occurrence and risk degrees, project management to save costs and time, and concurrent engineering for parallel communication-based design rather than serial design. These processes should be systematically connected. This paper studies concurrent engineering and risk management and presents how to take out the potential risk factors in the development project and calculate the integrated risk degree of the whole project. Fig. 2 shows the overview of this paper.
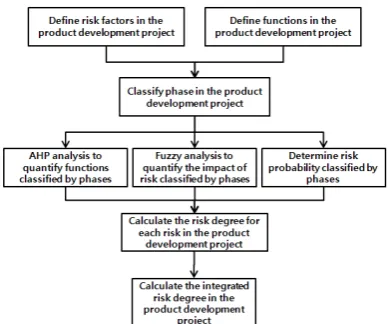
Fig. 2 The structure to determine integrated risk degrees
Determination of Integrated Risk Degrees in
Product Development Project
D. W. Choi., J. S. Kim., and H. G Choi.
[image:1.595.319.514.539.701.2]II.
CLASSIFICATIONOF RISK FACTORSIn the planning phase of product development project, companies are most likely to overlook the consideration of risks that can happen during the project. If a company fails to manage systematically those risks, it may face the difficulties that the project is not successfully completed within a scheduled time frame, and so requires higher costs[3].
[image:2.595.43.551.180.515.2]First of all, a company needs to investigate, collect, and classify potential risk factors arising from the product development project. Table Ⅰ presents the general design phases. Also, the example of the risk factors for each phase are presented in Table Ⅱ [4]-[11].
Table I. THE GENERIC PRODUCT DEVELOPMENT PROCESS [12] Phase 0:
Planning
Phase 1: Concept Development
Phase 2: System-Level
Design
Phase 3: Detail Design
Phase 4: Testing and Refinement
Phase 5: Production
Ramp-Up Marketing
• Articulate market opportunity •Define market segments
•Collect customer needs
•Identify lead users •Identify competitive products
•Develop plan for product options and extended product family •Set target sales Price point(s)
•Develop marketing plan
•Develop promotion and launch materials •Facilitate field testing
•Place early production with Key customers
Design
•Consider product Platform and architecture •Assess new technologies
•Investigate feasibility of product concepts •Develop industrial design concepts •Build and test
experimental prototypes
•Generate alternative product architectures •Define major subsystems and interfaces •Refine industrial design
•Define part geometry •Choose materials. •Assign tolerances. •Complete industrial design control documentation
•Reliability testing. •Life testing •Performance testing •Obtain regulatory approvals •Implement design changes
•Evaluate early production output
Manufacturing •Identify production constraints •Set supply chain strategy
•Estimate manufacturing cost •Assess production feasibility
•Identify suppliers for key components
•Perform make-buy analysis.
•Define final assembly scheme •Set target costs
•Define piece-part production processes •Design tooling. •Define quality assurance processes •Begin procurement of long-lead tooling
•Facilitate supplier Ramp-up •Refine fabrication and assembly Processes •Train work force •Refine quality assurance processes
•Begin operation of entire
production system
Other Function •Research: Demonstrate Available technologies •Finance: Provide planning goals
•General Management: Allocate project resources
•Finance: Facilitate economic analysis •Legal: Investigate patent issues
•Finance:
Facilitate make-buy analysis
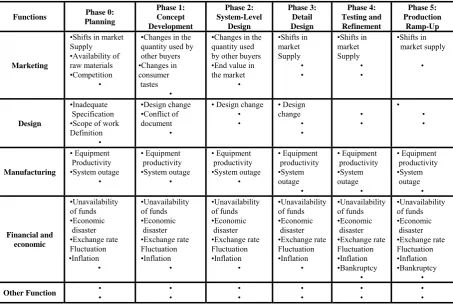
Table II. RISK FACTORS CLSSIFIED BY PHASE*
Functions Phase 0: Planning Phase 1: Concept Development Phase 2: System-Level Design Phase 3: Detail Design Phase 4: Testing and Refinement Phase 5: Production Ramp-Up Marketing
•Shifts in market Supply •Availability of raw materials •Competition
•
•Changes in the quantity used by other buyers •Changes in consumer tastes
•
•Changes in the quantity used by other buyers •End value in the market • •Shifts in market Supply • • •Shifts in market Supply • • •Shifts in market supply • Design •Inadequate Specification •Scope of work Definition • •Design change •Conflict of document •
• Design change • • • Design change • • • • • • • Manufacturing • Equipment Productivity •System outage • • Equipment productivity •System outage • • Equipment productivity •System outage • • Equipment productivity •System outage • • Equipment productivity •System outage • • Equipment productivity •System outage • Financial and economic •Unavailability of funds •Economic disaster •Exchange rate Fluctuation •Inflation • •Unavailability of funds •Economic disaster •Exchange rate Fluctuation •Inflation • •Unavailability of funds •Economic disaster •Exchange rate Fluctuation •Inflation • •Unavailability of funds •Economic disaster •Exchange rate Fluctuation •Inflation • •Unavailability of funds •Economic disaster •Exchange rate Fluctuation •Inflation •Bankruptcy • •Unavailability of funds •Economic disaster •Exchange rate Fluctuation •Inflation •Bankruptcy •
Other Function • • • • • • • • • • • •
*More risk factors have been collected and classified by functions in our research
Ⅲ. DETERMINATION OF RISK DEGREES
Calculate the risk degrees of each phase and put those degrees together to calculate the integrated risk degrees for the whole project.
Risk factors in each phase have different degrees of importance, so determine their relative importance through the AHP (Analytic Hierarchic Process) and convert the figure into an impact values by using the fuzzy algorithm. Finally, calculate the probability of the risk occurrences of the risk factor and multiply the probability by the impact value to get the risk degree of a risk factor. Risk degree is defined as Equation (1) [13].
i i i P I
R = × (1)
where
i
R
= risk degree of risk factor ii
I
= impact value of risk factor ii
P
= probability of risk occurrences of risk factor iA.The AHP (Analytic Hierarchic Process)
The AHP is a decision-making process using hierarchical analysis, which was first developed by T.L Satty[14] in the 1970s. It is a multi-criteria decision method that captures the knowledge, experience, and intuition of decision makers
through a pair-wise comparison between the elements of the decision-making hierarchy[15]. The features of AHP are that both quantitative and qualitative elements are considered for decision-making as the method involves logic from human thinking and experience-based intuition. Therefore, it is an appropriate way to draw the relative importance of the risk factors by development phases.
Product development projects are differently exploited depending on the product and corporate environment. The potential risks of the projects also have different importance. For that reason, this paper suggests an AHP analysis to determine the importance and impact value of each risk factor in a project. However, even though the AHP can quantify the experience and knowledge of experts, these values have inherent ambiguity. Thus, this paper attempts to resolve the ambiguity through the fuzzy theory.
B. Fuzzy Theory
Risk factors can occur simultaneously in a product development project, so they should be differently handled depending on their impact values and ramifications. To do so, the importance of each risk factor through AHP is first determined and is removed its ambiguity by quantifying the impact values of the risks using the fuzzy theory.
The fuzzy theory was suggested by Zadeh[16] that mathematically demonstrates unclear quantitative data as well as uncertainty and the ambiguity of human thinking and judgment [17].
To apply the fuzzy theory for a problem, an appropriate membership function is required. As development projects have different impact values depending on their degree of
difficulty. Different membership functions should also be used in accordance with the level of difficulty. In this paper, the difficulty of a project is determined after all the divisions engaging in the product design phase make decisions on 9 dimensions shown in the Table Ⅲ, on the assumption that concurrent engineering is introduced [18]. That is, the weight level A of each dimension the IDM is defined as 1, and B, C, and D, as 2, 3, and 4, respectively to determine the difficulty of the project development project. As the IDM has 9 dimensions, the projects can have 9 levels of difficulty at the minimum and 36 at the maximum. Consequently, 28 membership functions will be defined and applied to determine the impact value a risk factor.
To apply the relative importance of a risk factor obtained through AHP into the fuzzy algorithm, the value of its relative importance should be normalized through Equation (2).
max
w w
I i
i = (2)
where
i
w
= Relative importance of thi
risk factormax
w
= The maximum value of relative importancei
I
= Normalized importance for thi
risk factorNormalized importance and membership function determine impact values. However, in order to convert a fuzzy figure into a scalar, defuzzifacation should be followed. This paper uses the clipped center of gravity method, the most general way of defuzzification, to determine the impact value of a risk factor.
C. The Probability of Risk Occurrences
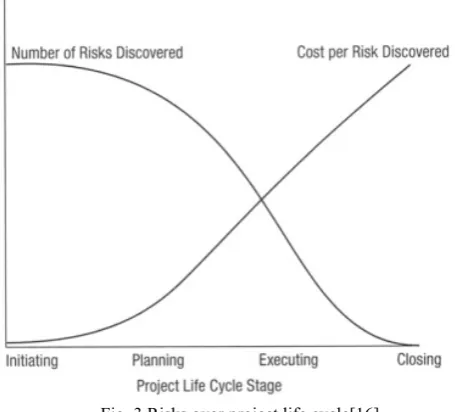
[image:4.595.311.539.59.265.2]As shown in Fig. 3, risk factors occur more during the early phase of project development. Risks in the early stages cost less to tackle than those in the later phases.
Fig. 3 Risks over project life cycle[16]
Even for experts, it is very hard to detect the signs of risks in the early phases. There are many reasons behind this. Firstly, diverse risk factors can occur simultaneously. Among them, some are subject to time while others are independent of time. In addition, one risk factor can affect the occurrences of another risk factor. That is also, the number of risk occurrences follows various statistical distributions. The most common way of prediction is to estimate the probability of a risk occurrence based on information from similar projects conducted in the past. The actual distribution of risk occurrence can vary depending on different corporate circumstances, but this paper analogized distribution types from Fig. 3. Fig. 3 shows that risks occur more frequently in the early phase and rapidly decrease in the later part of the project. However, the paper assumed that the occurrence distribution of a risk factor is important, and that if effective response activities, based on concurrent engineering, are executed for a risk factor occurrence, it will significantly reduce the probability of the same risk occurrence in the later phase of project. Based on those assumptions, the frequency of risks follows a gamma distribution and is defined as in Fig. 4.
[image:4.595.58.284.228.370.2]Fig. 4 Probability of risk occurrences for a risk factor
Table III. IDM(INFLUENCING DIMENSIONS MATRIX) Level
Dimension
A B C D
Product Complexity
Product Technology
Program Structure
Program Futures
Competition
Business Relationship
Team Scope
Resource Tightness
Schedule Tightness
[image:4.595.331.547.555.724.2]A gamma distribution shows the time to wait for every n times of Poisson occurrences. The Poisson distribution indicates the number of a certain events such as arrivals and services within a given time.
The density probability function of gamma distribution given in Equation (3).
∫
∞ − − Γ = > u x n nx e λ λ 1(n) 1 u)
P(X (3)
where
λ= the amount of an event that occurs within a given time n= the amount of exponential variables for which the time
of event is independent
x= the time to be taken until the occurrence of an event
0 , 0 , 0 1 ) 1 ( ), 1 ( ) 1 ( ) ( > > > = Γ − Γ − = Γ λ n x n n n
x, n= real vales
If the probability of a risk occurrence follows a gamma distribution, the probability for multiple number of risks occurred will be also defined as a gamma distribution. However, in the actual development project, the probability of occurrences of a risk factor does not necessarily fit a gamma distribution.
Ⅳ. DETERMINATION OF INTEGRATED RISK DEGREE
In a product development project, a harmonic mean is applied to calculate the average risk degree of each phase. If risk factors are regarded as electric resistance against a successful completion of the project, a harmonic mean is appropriate because it is more common for risk factors to occur simultaneously, rather than consecutively. Equation (4) is used to compute a harmonic mean.
i r r r r n 1 1 1 1 R 3 2 1 p + • • • + + +
= (4)
where
p
R
= the average risk degree per phasei
r
= the risk degree of thi
factor n= the number of risk factors [image:5.595.312.566.477.682.2]Table Ⅳ shows the results of the harmonic mean for each design phase.
Table IV. RISK DEGREES CLASSIFIED BY PHASES
Phase 0: Planning Phase 1: Concept Developmen t Phase 2: System-Level Design Phase 3: Detail Design Phase 4: Testing and Refinement Phase 5: Production Ramp-Up 0
R
R
1R
2R
3R
4R
5Unlike risk degrees by phases, an arithmetic mean is applied to determine the integrated risk degree of the project. That is because product development phases are carried out
consecutively. Equation (5) shows the integrated risk degree in a product development project.
6 R R R R R R
R 0 1 2 3 4 5
T + + + + +
= (5)
Ⅴ. AN EXAMPLE
The integrated risk degree of the project is determined in accordance with the phases of Fig. 2. The degree is also affected by the determination of impact values according to the importance of risks, the probability of risk occurrence, and the risk degrees. In this example, “Inflation affects the project finance” is used as a risk factor. First of all, Table Ⅴ
shows the assumed relative impact values through an AHP analysis of the risk factors from phases 0 to 5. The difficulty of the project is assumed to be 30, based on the IDM (Table
Ⅵ), and the corresponding membership functions is shown in Fig. 5.
TABLE Ⅴ
WEIGHTS OBTAINED FRONM AHP ANALYSIS
Phase Functions Risks Weight
Design
√Inadequate
specification
√Conflict of
document 0.150 0.078 1 0.52 Finance
√Lack of funds
√Inflation
√Exchange rate
fluctuation 0.105 0.052 0.103 0.35 0.78 0.69 Phase 0 • • • •
Phase 1 • • • • •
•
• • • • • • • • •
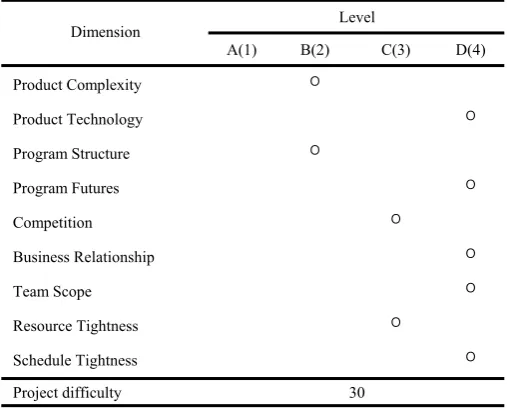
Table VI. IDM(INFLUENCING DIMENSIONS MATRIX) ASSUMED FOR A PROJECT
Level Dimension
A(1) B(2) C(3) D(4)
Product Complexity О
Product Technology О
Program Structure О
Program Futures О
Competition О
Business Relationship О
Team Scope О
Resource Tightness О
Schedule Tightness О
Project difficulty 30
(A: low, B: medium, C: high, D: very high)
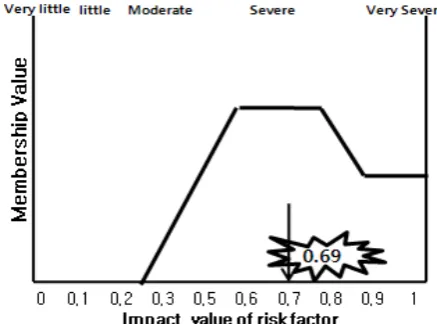
[image:5.595.45.291.656.733.2]Fig. 5 Choice of membership function
[image:6.595.316.535.51.213.2] [image:6.595.56.278.348.532.2]The impact values of the risk factors can be calculated by phases and functions. But, this example calculated only the impact value of the “Inflation” risk among the financial risks of Phase 0. Based on the AHP, the importance of “Inflation” is 0.78 in Table V. Then, select a membership function from Fig. 5, apply 0.78 to the fuzzy algorithm, and go through defuzzification. After this calculation, the final impact value is calculated at 0.69. (Refer to Figs. 6-8)
Fig 6. Membership function by AHP’s evaluation
Fig 7. Distribution of impact value of the risk factor by fuzzy inferencing
Fig 8. Defuzzifacation using clipped of gravity method
To determine the probability of risk occurrences, the historical data regarding the “Inflation” factor should be collected and analyzed. If the risk data shows that “Inflation” factor occurs three times exponentially with arrival rate, 0.1 in phase 0. the probability of that risk factor to be happened more than once will be as follows.
) 4 2 P(X 1 ) 4 2
P(X ≤ = − >
: time period for the phase 0=24 hour
λ=1/10, n=3
∫
∞−
×
×
=
>
24
) 10
1 ( 2 3
2
)
10
1
(
]
4
2
P[X
x
e
x
= 0.57
That is, the probability of ‘Inflation’ occurrence is 0.43 and the final risk degree is 0.2967(0.69 0.43). Likewise, all risk ⅹ
factors in the phases can be calculated through the same process. A harmonic mean is applied to measure the average risk degree by phases. In this example, Table presents the Ⅶ
[image:6.595.314.471.371.445.2]harmonic means of risk degrees that consider all risk factors including the factor of the “Inflation effect on the project finance”. The integrated risk degree of the whole project is 0.41.
Table VII. RISK DEGREE CLASSIFIED BY PHASES
Phase 0: Plannin
g
Phase 1: Concept Developme
nt
Phase 2:
System-Level Design
Phase 3: Detail Design
Phase 4: Testing
and Refineme
nt
Phase 5: Production
Ramp-Up
0.63 0.75 0.34 0.26 0.28 0.21
Integrated risk degree
6
21
.
0
28
.
0
26
.
0
34
.
0
75
.
0
63
.
0
+
+
+
+
+
=
[image:6.595.58.279.577.742.2]Ⅵ. CONCLUSION
This paper surveyed and collected the possible risk factors in a product development project, and classified the risks by phases. Those risks in each phase were also categorized by functions. The surveyed, collected and classified risk factors can be selectively applied depending upon the corporate environments or the developing products. The paper suggests a method to calculate the risk degree of the whole project based on these factors. In other words, the paper includes: how to leverage the AHP and fuzzy theory to calculate impact values; how to calculate the probability of risk occurrences through general probability distribution; and how to integrate the risk degrees of each factor.
If a company puts this study into practice and calculates the integrated risk degree of a project in the planning phase, the company will be able to determine whether to conduct the project in the planning phase, as well as whether or not to stop the ongoing project. The biggest benefit is that the company can recognize the risk degrees of a product development project and devise counter responding activities. Moreover, the study enables the company to determine whether to manage the project intensively or not, thereby increasing the chances of the successful completion of the project. Consequently, this will help to reduce the time and costs for product development and create new profits. Lastly, the study is expected to promote the development of the engineering risk management area.
ACKNOWLEDGMENTS
This study was supported by the Brain Korea 21 Program of the Korea Research Foundation, 2007. This work was also supported by the Korea Science and Engineering Foundation (KOSEF) grant funded by the Korean government (MOST) (R01-2008-000-10646-0).
REFERENCES
[1] C. John, “Manage risk in product and process development and avoid unpleasant surprises,” Engineering Management Journal, 1995, pp. 35-38.
[2] H. Kerzner, Project Management: A Systems Approach to Planning, Scheduling, and Controlling. John Wiley & Sons, 2006.
[3] J. O. Ahn, H. S. Jeung, J. S. Kim, H. G. Choi, “A framework for managing risks on concurrent engineering basis”, International Conference on Management of Innovation and Technology, 2008, pp. 293-298.
[4] D. V. Well-Stam, F. Lindenaar, S. V. Kinderen, B. V. D. Bunt, Project risk management : an essential tool for managing and controlling
projects. Kogan Page, 2007, pp. 143-147.
[5] K. D. Miller, “A Framework for Integrated Risk Management in International Business,” Journal of International Business Studies, vol. 23, 1992, pp. 311-331.
[6] L. P. Cooper, “A research agenda to reduce risk in new product development through knowledge management: a practitioner perspective,” Journal of Engineering and Technology Management, vol. 20, 2003, pp. 117-140.
[7] P. K. Dey, “Process re-engineering for effective implementation of projects,” International Journal of Project Management, vol. 17, pp. 147-159.
[8] R. M. Wideman, Project and program risk management: a guide to
managing project risks and opportunities, Project Management
Institute, 1992, pp. A-1~A-4.
[9] S. Ghosh, J. Jintanapakanont, “Identifying and assessing the critical risk factors in an underground rail project in Thailand: a factor analysis approach,” International Journal of Project Management, 2004, pp.
[10] T. J. Kloppenborg, Project Management: A Contemporary Approach. South-Western Cengage Learning, 2009, ch. 10.
[11] T. R. Adlder, J. G. Leonard, R. K. Nordgren, “Improving risk management: moving from risk elimination to risk avoidance,”
Information and Software Technology, 1999, pp. 29-34.
[12] K. T. Ulrich, S. D, Epppinger, Product Design and Development. McGraw-Hill, 2004, ch. 2.
[13] C. A. Bana e Costa, J. C. Vansnick, “A critical analysis of the eigenvalue method used to derive priorities in AHP,” European
Journal of Operational Research, vol. 187, 2008, pp. 1422-1428.
[14] R. W. Saaty “The analytic hierarchy process-what it is and how it is used,” Mathematical Modeling, 1987, pp. 161-176.
[15] T. L. Saaty, “Decision Making for Leaders,” Rws Pubns, 1995. [16] L. A. Zadeh, “Fuzzy set,” information and Control, vol. 8, 1965. [17] E. W. T. Ngai, F. K. T. Wat., “Fuzzy decision support system for risk
analysis in e-commerce development,” Decision Support Systems, vol. 40, 2005, pp. 235-255.
[18] N. Singh, System Approach to Computer-Integrated Design and Manufacturing. John Wiley & Sons, 1996, ch. 4.
![Table I. THE GENERIC PRODUCT DEVELOPMENT PROCESS [12]](https://thumb-us.123doks.com/thumbv2/123dok_us/1311468.661238/2.595.43.551.180.515/table-i-generic-product-development-process.webp)