ISSN Online: 2327-4344 ISSN Print: 2327-4336
DOI: 10.4236/gep.2019.75009 May 24, 2019 81 Journal of Geoscience and Environment Protection
Spectral Features for the Detection of Land
Cover Changes
Ram C. Sharma
1, Hoan Thanh Nguyen
2,3, Saeid Gharechelou
4, Xiulian Bai
5, Luong Viet Nguyen
6,
Ryutaro Tateishi
71Department of Informatics, Tokyo University of Information Sciences, Chiba, Japan 2Institute of Geography, Vietnam Academy of Science and Technology, Hanoi, Vietnam
3Graduate University of Science and Technology, Vietnam Academy of Science and Technology, Hanoi, Vietnam 4Faculty of Civil Engineering, Shahrood University of Technology, Shahrood, Iran
5College of Resource and Environmental Economics, Inner Mongolia University of Finance and Economics, Hohhot, China 6Space Technology Institute, Vietnam Academy of Science and Technology, Hanoi, Vietnam
7Center for Environmental Remote Sensing, Chiba University, Chiba, Japan
Abstract
Derivation of more sensitive spectral features from the satellite data is im-mensely important for better retrieving land cover information and change monitoring, such as changes in snow covered area, forests, and barren lands as some examples from local to the global scale. The major objectives of this paper are to present the potential of water-resistant snow index (WSI) for the detection of snow cover changes in the Himalayas, extant two composite im-ages, biophysical image composite (BIC) and forest cover composite (FCC) for the detection of changes in barren lands and forested areas respectively, and two newly designed composite images, water cover composite (WCC) and urban cover composite (UCC) for the detection of changes in water and urban areas respectively. This research implemented the image compositing technique for the detection and visualization of land cover changes (water, forest, barren, and urban) with respect to local administrative areas where a significant land cover change occurred from 2001 to 2016. A case study was also conducted in the Himalayan region to identify snow cover changes from 2001 to 2015 using the WSI. Analysis of the annual variation of the snow cover in the Himalayas indicated a decreasing trend of the snow cover. Con-sequently, the downstream areas are more likely to suffer from snow related hazards such as glacial outbursts, avalanches, landslides and floods. The changes in snow cover in the Himalayas may bring significant hydrophysical and live-lihood changes in the downstream area including the Mekong Delta. There-fore, the countries sharing the Himalayan region should focus on adapting the severe impacts of snow cover changes. The image compositing approach
How to cite this paper: Sharma, R. C., Nguyen, H. T., Gharechelou, S., Bai, X. L., Nguyen, L. V., & Tateishi, R. (2019). Spec-tral Features for the Detection of Land Cover Changes. Journal of Geoscience and Environment Protection, 7, 81-93.
https://doi.org/10.4236/gep.2019.75009
Received: April 4, 2019 Accepted: May 21, 2019 Published: May 24, 2019
Copyright © 2019 by author(s) and Scientific Research Publishing Inc. This work is licensed under the Creative Commons Attribution International License (CC BY 4.0).
http://creativecommons.org/licenses/by/4.0/
DOI:10.4236/gep.2019.75009 82 Journal of Geoscience and Environment Protection presented in the research demonstrated promising performance for the detec-tion and visualizadetec-tion of other land cover changes as well.
Keywords
Land Cover, Water Cover Composite, Urban Cover Composite, Snow Cover Composite, Biophysical Image Composite, Forest Cover Composite, Himalayas, MODIS, Change Detection
1. Introduction
The unprecedented changes in land cover triggered by human activities have brought enormous social, economic, and environmental challenges worldwide. Satellite remote sensing is a suitable technology for large scale monitoring of land cover such as snow covered areas, forests, and barren lands as some examples from local to the global scale. Spectral indices are one of the techniques commonly used for the land cover monitoring of individual classes. Multi-temporal composite images are an alternative approach for simultaneous detection and visualization of spatio-temporal changes of land cover (Sharma et al., 2016; Sharma et al., 2018). However, derivation of more sensitive features from the satellite data is immensely important for better retrieving land cover information and change monitoring.
Major techniques for deriving the snow cover information from satellite data are spectral mixture analysis and spectral indices (Crane & Anderson, 1984; Ro-senthal & Dozier, 1996; Hall et al., 2002; Salomonson & Appel, 2004; Painter et al., 2009). For improved discrimination between snow and water areas, the wa-ter-resistant snow index (WSI) was developed by Sharma et al. 2016. The WSI is the normalized difference between the value and hue obtained by transforming the RGB color composite made up of red, green, and near infrared bands into HSV (Hue-Saturation-Value) color space. For the detection of water bodies and urban built-up areas, normalized difference water index (NDWI, McFeeters, 1996; Gao et al., 1996) and normalized difference built-up index (NDBI, Zha et al., 2003) are available.
The spectral indices such as normalized difference soil index (Rogers & Kear-ney, 2004; Deng et al., 2015) have been used for the detection of barren lands. The barren soil indices are derived as the normalized difference between short-wave infrared and near infrared or green reflectance. For improving the detec-tion of barren lands, biophysical image composite (BIC) was designed by Shar-ma et al. 2016. The BIC is a false color composite iShar-mage Shar-made up of the norShar-ma- norma-lized difference vegetation index (NDVI), shortwave infrared reflectance, and green reflectance, which were specially selected from the highest vegetation ac-tivity period over an entire year.
DOI: 10.4236/gep.2019.75009 83 Journal of Geoscience and Environment Protection reflectance (Rouse et al., 1974; Tucker, 1979), is often used for the detection of vegetative areas. For improving the discrimination of forested areas from other vegetative areas, forest cover composite (FCC) was designed by Sharma et al. 2018. The FCC is a false color composite image made up of short-wave infrared reflectance and green reflectance, particularly selected from the period when the NDVI is at a maximum, as the red and blue bands, respectively; and mean NDVI value over an entire year as the green band. The FCC was designed in such a way that the forested areas appear greener than other vegetative areas.
The major objectives of this paper are to present the potential of water-resistant snow index (WSI) for the detection of snow cover changes in the Himalayas, ex-tant two composite images, biophysical image composite (BIC) and forest cover composite (FCC) for the detection of changes in barren lands and forested areas respectively, and two newly designed composite images, water cover composite (WCC) and urban cover composite (UCC) for the detection of changes in water and urban areas respectively.
2. Methodology
2.1. Satellite Data
The composite images were generated from the Moderate Resolution Imaging Spectroradiometer (MODIS) based multi-temporal satellite images. We used Terra/Aqua satellite based MODIS Surface Reflectance 8-Day Level 3 Global 500 m data (MOD09A1 and MYD09A1). Only highest quality surface reflectance datasets were extracted by masking out the pixels affected by clouds, cloud sha-dows, cirrus, and large solar zenith angles using separate quality band descrip-tions available in the dataset. All the satellite images available over an entire year were exploited for the generation of composite images (BIC, FCC, WCC, and UCC). In this research, the potential of multi-temporal composite images for the detection and visualization of land cover changes (water, barren, forest, and urban) at every five years from 2001 to 2016 (2001, 2006, 2011, 2016) was demonstrated. We used DMSP/OLS (Defense Meteorological Satellite Program/Operational Li-nescan System) observed nighttime light data to generate the UCC. The compo-site images were implemented in some local administrative areas where a signif-icant land cover change occurred from 2001 to 2016. The local administrative areas were extracted from the GADM (Global Administrative Areas) database (http://www.gadm.org). In addition, a case study was conducted in the Hima-layan region to identify the snow cover changes using the MODIS data.
2.2. Detection of Barren Lands Changes
DOI:10.4236/gep.2019.75009 84 Journal of Geoscience and Environment Protection
( )
( )
( )
NDVImax max NDVImaxRed R Swir
BIC Green G NDVI
Blue B Green
= = = = (1)
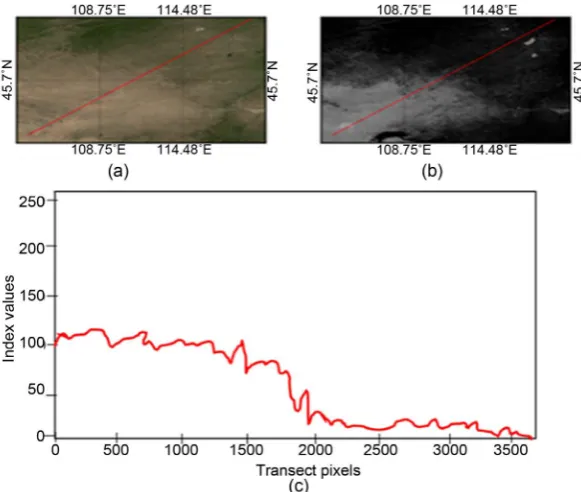
An alternative approach for the detection of barren lands was also demon-strated. The barren lands frequently lack the vegetation cover, contain lesser surface moisture, and exhibit higher land surface temperature. To capture these conditions of the barren lands, an index was proposed as the normalized differ-ence between the hue and saturation by transforming the RGB (near infrared, shortwave infrared, red) color into HSV (Hue-Saturation-Value) space. The sen-sitivity of the MODIS based index was assessed in a transition zone of varied level of vegetation and barren lands concerning the true-color image for 2016.
2.3. Detection of Forest Cover Changes
The BIC was designed for the extraction of vegetative areas (forests, crops, shrubs/herbs) from non-vegetative areas (barren, urban, and water/snow). To overcome the difficulty of discriminating forested areas from other vegetative areas such as crops, shrubs, and herbs using the BIC, FCC was designed by changing the green (G) term of the BIC by annual mean NDVI value (Sharma et al., 2018). The composition of the FCC is shown in Equation (2).
( )
( )
( )
NDVImax mean NDVImaxRed R Swir
FCC Green G NDVI
Blue B Green
= = = = (2)
Examples of forest cover change detection were demonstrated using the MODIS based FCC concerning the true-color images in areas where substantial changes in forest cover have occurred from 2001 to 2016.
2.4. Detection of Water Cover Changes
A new image composite called the water cover composite (WCC) is proposed in the research. The WCC is made up of annual minimum green (Greenmin)
reflec-tance, annual minimum near infrared (Nirmin) reflectance, and annual
maxi-mum superfine water index (SWImax) values as the red (R), green (G), and blue
(B) bands respectively. The SWI, the normalized difference between the satura-tion (Hue-Saturasatura-tion-Value transformasatura-tion of the RGB reflectance) and near infrared, was designed for better extraction of surface water at global scale (Sharma et al., 2015). The composition of the WCC is shown in Equation (3).
( )
( )
( )
min min maxRed R Green
WCC Green G Nir
Blue B SWI
= = = = (3)
DOI: 10.4236/gep.2019.75009 85 Journal of Geoscience and Environment Protection
2.5. Detection of Urban Cover Changes
For the detection and visualization of urban built-up areas, a new image compo-site called the Urban Cover Compocompo-site (UCC) was also designed in this research. The UCC is made up of Enhanced Urban Built-up Index (EUBI; Sharma et al., 2016), annual mean NDVI (NDVImean) values, and annual minimum green (Greenmin) reflectance as the red (R), green (G), and blue (B) bands respectively. The EUBI (Sharma et al., 2016) is the ratio between annual median composite of the nighttime lights values and annual maximum composite values of the norma-lized difference between hue and value obtained from the Hue-Saturation-Value transformation of the RGB (near infrared, shortwave infrared, and red bands) composite of the MODIS data. The composition of the UCC is shown in Equa-tion (4).
( )
( )
( )
minmeanRed R EUBI
UCC Green G NDVI
Blue B Green
=
= =
=
(4)
2.6. Detection of Snow Cover Changes
The MODIS data available from 2001 to 2015 were used for detecting snow cov-er changes in the Himalayas. For each 8 days data, the WSI was calculated, and monthly median composites were prepared. The monthly true-color composite images were used as the reference data to determine the threshold between snow and non-snow areas on the WSI images. The Himalayas, also known as water towers of Asia, provides freshwater to large rivers of Asia including Mekong, Ganges, and Brahmaputra. These downstream rivers are the backbone of water supply, agriculture, and livelihood in many Asian countries including Vietnam.
3. Results
3.1. Water Cover Changes
The potential of the water cover composite (WCC) was assessed for the detec-tion and visualizadetec-tion of spatio-temporal changes of the water bodies in two ad-ministrative regions: Aralskiy, Qyzylorda, Kazakhstan and Andamarca, SudCa-rangas, Oruro, Bolivia. In both locations (Figure 1 and Figure 2), a large area of water body lost gradually from 2001 to 2016. Almost all water bodies lost in An-damarca, SudCarangas, Oruro, Bolivia in 2016. It should be noted that, only in-ter-annual variation of the land cover changes have been presented in this paper. Though the water bodies exhibit seasonal changes intra-annually, the WCC is designed in such a way that it can visualize even a minimum level of the water body. Therefore, the loss of the water body as detected by the WCC conveys se-vere environmental concerns in those regions.
3.2. Barren Lands Changes
DOI:10.4236/gep.2019.75009 86 Journal of Geoscience and Environment Protection
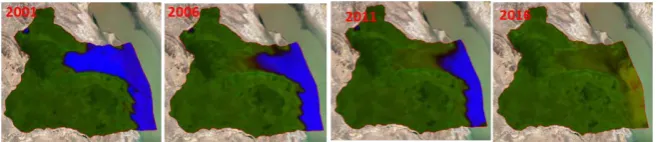
[image:6.595.211.542.214.285.2]Figure 1. Performance of water cover composite (WCC) for the detection and visualiza-tion of changes in water bodies from 2001 to 2016 in Aralskiy, Qyzylorda, Kazakhstan. A large area of water body (blue pixels) lost gradually from 2001 to 2016. The WCC images were overlaid over the Google Map images.
Figure 2. Performance of water cover composite (WCC) for the detection and visualiza-tion of changes in water bodies from 2001 to 2016 in Andamarca, SudCarangas, Oruro, Bolivia. This figure is adapted from Tateishi et al. 2017. A large area of water body (blue pixels) lost gradually from 2001 to 2016. The WCC images were overlaid over the Google Map images.
two administrative regions: Boulia, Queensland, Australia and Abu Kamal, DayrAzZawr, Syria. As shown in Figure 3, a fluctuation in the barren (vegeta-tive) lands over the 15 years period was detected by the BIC, perhaps due to the changes in precipitation. In another case study in Abu Kamal, DayrAzZawr, Sy-ria (Figure 4), though some regrowth of vegetative areas was detected in 2016, a large vegetative areas were converted into barren lands both in 2006 and 2011.
In addition, Figure 5 demonstrates the potential of the proposed index for the detection of barren lands. The proposed index has shown different index values between the barren lands (high values) and vegetative areas (low values). However, it is the subject of future research to see its applications in other geographic regions.
3.3. Forest Cover Changes
The forest cover composite (FCC) has successfully detected the forested areas and their temporal changes as shown in Figure 6.
In addition, the potential of the forest cover composite (FCC) for the detec-tion and visualizadetec-tion of spatiotemporal changes of the forested areas was as-sessed in two administrative regions: PreaekPrasab, Kraches, Cambodia and Moreno, Santiago del Estero, Argentina. In both locations (Figure 7 and Figure 8), a large forested area lost gradually from 2001 to 2016. The loss of forested areas has alarmed the environmental concerns in those regions.
3.4. Snow Cover Changes
DOI: 10.4236/gep.2019.75009 87 Journal of Geoscience and Environment Protection
[image:7.595.207.540.236.307.2]Figure 3. Performance of biophysical image composite (BIC) for the detection and visua-lization of changes in barren lands from 2001 to 2016 in Boulia, Queensland, Australia. A small areas of barren lands (red pixels) present in 2001 were substantially increased in 2006. Though they were decreased in 2011 as vegetative areas (green pixels) flourished, some vegetative areas lost again in 2016 and barren lands (red pixels) increased. The BIC images were overlaid over the Google Map images.
Figure 4. Performance of biophysical image composite (BIC) for the detection and visua-lization of changes in barren lands from 2001 to 2016 in Abu Kamal, DayrAzZawr, Syria. A large vegetative areas (green pixels) present in 2001 lost in 2006 and 2011, and barren lands (red pixels) increased substantially. Some regrowth of vegetative areas (green pix-els) was noticed in 2016. The BIC images were overlaid over the Google Map images.
Figure 5. The sensitivity of the proposed index in a transition zone between vegetative and barren areas: (a) MODIS true-color image, (b) Proposed index (25-percentiles), (c) Profile plot of the proposed index along the red line drawn.
[image:7.595.228.519.388.634.2]DOI:10.4236/gep.2019.75009 88 Journal of Geoscience and Environment Protection
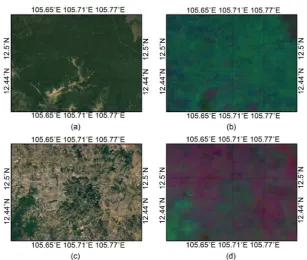
[image:8.595.211.539.410.483.2]Figure 6. An example showing the performance of forest cover composite (FCC) for the detection of forest cover changes: (a) Google map/Landsat based true color image of 2001, (b) MODIS based FCC image of 2001, (c) Google map/Landsat based true color image of 2016, (d) MODIS based FCC image of 2016. The red color in (d) implies the re-duction of forested areas.
Figure 7.Performance of forest cover composite (FCC) for the detection and visualiza-tion of changes in forested areas from 2001 to 2016 in PreaekPrasab, Kraches, Cambodia. A large area of forested areas (green pixels) lost gradually from 2001 to 2016. The FCC images were overlaid over the Google Map images.
Figure 8.Performance of forest cover composite (FCC) for the detection and visualiza-tion of changes in forested areas from 2001 to 2016 in Moreno, Santiago del Estero, Ar-gentina. A large area of forested areas (green pixels) lost gradually from 2001 to 2016. The FCC images were overlaid over the Google Map images.
[image:8.595.213.538.555.626.2]DOI: 10.4236/gep.2019.75009 89 Journal of Geoscience and Environment Protection
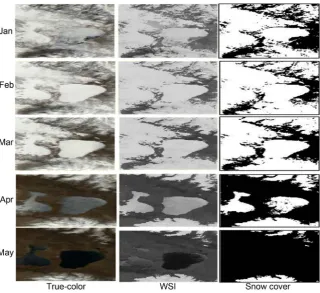
Figure 9. Detection of snow cover using the water-resistant snow index (WSI) with ref-erence to true-color images.
Figure 10. The monthly variation of the snow cover from 2001 to 2015.
receives plenty of snowfall during winter and some portion of it maintains snow cover throughout a year. The change analysis has indicated a decreasing trend of snow cover from 2001 to 2015 during both winter and summer seasons.
3.5. Urban Cover Changes
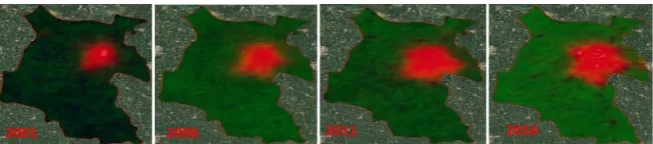
[image:9.595.232.517.405.587.2]DOI:10.4236/gep.2019.75009 90 Journal of Geoscience and Environment Protection administrative regions: West Delhi, Delhi, India and Suiyang, Shangqiu, Henan, China. A notable degree of urbanization was detected by the UCC in both re-gions from 2001 to 2016 (Figure 11 and Figure 12).
4. Discussion and Conclusions
[image:10.595.212.538.456.529.2]Moderate Resolution Imaging Spectroradiometer (MODIS) has provided pre-cious assets of multi-temporal data suitable for monitoring land cover types such as snow covered areas, forests, and barren lands as some examples. Spectral in-dices derived from remote sensing data are crucial to the monitoring of land cover changes. The multi-temporal image compositing approach provides an opportunity for simultaneous detection and visualization of spatiotemporal changes of land cover. In this research, image compositing technique was im-plemented for the detection and visualization of different land cover (water, barren, forest, and urban) changes with case studies in several local administra-tive regions where significant land cover changes have occurred from 2001 to 2016. The special composite images were designed by exploiting the time-series of the multi-spectral satellite imagery on an annual basis. However, the applica-tion of the spectral index and composite images presented in this research in different study areas is a subject for future research. It is also important for vali-dating the performance of the spectral index and composite images with the support of ground truth data. Environmental issues require not only national measures but also local level measures. Local level environmental data are im-portant for the assessment of global-local sustainability (Tateishi et al., 2017). This research presented an idea of monitoring land cover changes with respect to the unit of local administrative area.
Figure 11. Performance of urban cover composite (UCC) for the detection and visualiza-tion of changes in urban built-up areas from 2001 to 2016 in West Delhi, Delhi, India. The urban built-up areas (red pixels) expanded gradually from 2001 to 2016. The UCC images were overlaid over the Google Map images.
[image:10.595.211.538.596.668.2]DOI: 10.4236/gep.2019.75009 91 Journal of Geoscience and Environment Protection Previous research (Sharma et al., 2016)demonstrated the better performance of the water-resistant snow index (WSI) for the detection of snow-covered areas over the extant snow indices. In this research, we employed the WSI for snow cover change analysis in the Himalayas with reference to true color images. Analysis of the annual variation of the snow cover indicated a decreasing trend. However, verification of this trend using in situ measurement data is recom-mended. Unlike other land cover changes, snow cover is not directly altered by human activities. The Himalayas are highly sensitive to climate change (Liu &
Chen, 2000). Immerzeel et al. 2009 found substantial variation in snow cover
from 2000 to 2005 in the Himalayan basin. Contrasting patterns of early twen-ty-first century glacier mass change have been reported in the Himalayas (Kääb et al., 2012). Consequently, the Himalayan region seems to be more prone to snow related hazards such as glacial outbursts, avalanches, and landslides. The changes in snow cover in the Himalayas may bring significant hydrophysical and livelihood changes in the downstream area including the Mekong Delta. There-fore, the countries sharing the Himalayan region should focus on adapting the severe impacts of snow cover changes.
Though this research dealt with MODIS based moderate-resolution (500 m) images, a similar technique can be applied with the high resolution multi-spectral images obtained from Landsat 8 or Sentinel-2 satellites. It is expected that the composite images presented in this research can be used for quantifying the land cover changes by accounting relative proportion of the RGB color values or em-ploying supervised classification approach. They can also be used as reference images for the collection of ground truth data necessary for land cover change research.
Acknowledgements
This research was funded by the Vietnam Academy of Science and Technology (VAST) under project codes: KHCBTĐ.02/19-21 and UQĐTCB.02/19-20. MODIS data used in the research were available from the NASA EOSDIS Land Processes Distributed Active Archive Center (LP DAAC), USGS/Earth Resources Observa-tion and Science (EROS) Center, Sioux Falls, South Dakota.
Conflicts of Interest
The authors declare no conflicts of interest regarding the publication of this pa-per.
References
Crane, R. G., & Anderson, M. R. (1984). Satellite Discrimination of Snow/Cloud Surfaces. International Journal of Remote Sensing, 5, 213-223.
https://doi.org/10.1080/01431168408948799
DOI:10.4236/gep.2019.75009 92 Journal of Geoscience and Environment Protection https://doi.org/10.1016/j.jag.2015.02.010
Gao, B. (1996). NDWI—A Normalized Difference Water Index for Remote Sensing of Vegetation Liquid Water from Space. Remote Sensing of Environment, 58, 257-266. https://doi.org/10.1016/S0034-4257(96)00067-3
Hall, D. K., Riggs, G. A., Salomonson, V. V., Di Girolamo, N. E., & Bayr, K. J. (2002). MODIS Snow-Cover Products. Remote Sensing of Environment, 83, 181-194. https://doi.org/10.1016/S0034-4257(02)00095-0
Immerzeel, W. W., Droogers, P., de Jong, S. M., & Bierkens, M. F. P. (2009). Large-Scale Monitoring of Snow Cover and Runoff Simulation in Himalayan River Basins Using Remote Sensing. Remote Sensing of Environment, 113, 40-49.
https://doi.org/10.1016/j.rse.2008.08.010
Kääb, A., Berthier, E., Nuth, C., Gardelle, J., & Arnaud, Y. (2012). Contrasting Patterns of Early Twenty-First-Century Glacier Mass Change in the Himalayas. Nature, 488, 495. https://doi.org/10.1038/nature11324
Liu, X., & Chen, B. (2000). Climatic Warming in the Tibetan Plateau during Recent Dec-ades. International Journal of Climatology, 20, 1729-1742.
https://doi.org/10.1002/1097-0088(20001130)20:14<1729::AID-JOC556>3.0.CO;2-Y McFeeters, S. K. (1996). The Use of the Normalized Difference Water Index (NDWI) in
the Delineation of Open Water Features. International Journal of Remote Sensing, 17, 1425-1432.https://doi.org/10.1080/01431169608948714
Painter, T. H., Rittger, K., McKenzie, C., Slaughter, P., Davis, R. E., & Dozier, J. (2009). Retrieval of Subpixel Snow Covered Area, Grain Size, and Albedo from MODIS. Re-mote Sensing of Environment, 113, 868-879.https://doi.org/10.1016/j.rse.2009.01.001 Rogers, A. S., & Kearney, M. S. (2004). Reducing Signature Variability in Unmixing
Coastal Marsh Thematic Mapper Scenes Using Spectral Indices. International Journal of Remote Sensing, 25, 2317-2335.https://doi.org/10.1080/01431160310001618103 Rosenthal, W., & Dozier, J. (1996). Automated Mapping of Montane Snow Cover at
Sub-pixel Resolution from the Landsat Thematic Mapper. Water Resources Research, 32, 115-130.https://doi.org/10.1029/95WR02718
Rouse Jr., J., Haas, R., Schell, J., & Deering, D. (1974). Monitoring Vegetation Systems in the Great Plains with ERTS. NASA Special Publication, 351, 309.
Salomonson, V. V., & Appel, I. (2004). Estimating Fractional Snow Cover from MODIS Using the Normalized Difference Snow Index. Remote Sensing of Environment, 89, 351-360.https://doi.org/10.1016/j.rse.2003.10.016
Sharma, R. C., Tateishi, R., & Hara, K. (2016). A New Water-Resistant Snow Index for the Detection and Mapping of Snow Cover on a Global Scale. International Journal of Re-mote Sensing, 37, 2706-2723.https://doi.org/10.1080/01431161.2016.1183832
Sharma, R. C., Tateishi, R., Hara, K., Gharechelou, S., & Iizuka, K. (2016). Global Map-ping of Urban Built-Up Areas of Year 2014 by Combining MODIS Multispectral Data with VIIRS Nighttime Light Data. International Journal of Digital Earth, 9, 1004-1020. https://doi.org/10.1080/17538947.2016.1168879
Sharma, R., Hara, K., & Tateishi, R. (2018). Developing Forest Cover Composites through a Combination of Landsat-8 Optical and Sentinel-1 SAR Data for the Visualization and Extraction of Forested Areas. Journal of Imaging, 4, 105.
https://doi.org/10.3390/jimaging4090105
DOI: 10.4236/gep.2019.75009 93 Journal of Geoscience and Environment Protection Sharma, R., Tateishi, R., Hara, K., & Nguyen, L. (2015). Developing Superfine Water In-dex (SWI) for Global Water Cover Mapping Using MODIS Data. Remote Sensing, 7, 13807-13841.https://doi.org/10.3390/rs71013807
Tateishi, R., Keola, S., Uchiyama, Y., & Sharma, R. C. (2017). Development of Glob-al-Local Datasets of Environment/Economy/Society and Their Multi-Temporal Analy-sis for Assessment of Sustainability. International Symposium on Remote Sensing. 17-19 May, Nagoya, Japan.
http://www.rssj.or.jp/isrs2017/wp-content/uploads/sites/3/2017/05/ISRS2017_Program _20170523_Oral.pdf
Tucker, C. J. (1979). Red and Photographic Infrared Linear Combinations for Monitoring Vegetation. Remote Sensing of Environment, 8, 127-150.
https://doi.org/10.1016/0034-4257(79)90013-0