Uniaxial Pressure Control of Competing Orders in a High Temperature
Superconductor
Authors:
H.-H. Kim1†, S. M. Souliou2†,‡ , M.E. Barber3,E. Lefrancois1,2, M. Minola1, M. Tortora1, R. Heid5, N. Nandi3, R. A. Borzi3,4, G. Garbarino2, A. Bosak2, J. Porras1, T. Loew1, M. König3, P.M. Moll3, A. P. Mackenzie3, B. Keimer1, C. W. Hicks3, M. Le Tacon5*
Affiliations:
1 Max Planck Institute for Solid State Research, Heisenbergstraße 1, D-70569 Stuttgart, Germany.
2 European Synchrotron Radiation Facility (ESRF), BP 220, F-38043 Grenoble Cedex, France.
3 Max Planck Institute for Chemical Physics of Solids, Nöthnitzer Straße 40, 01187 Dresden, Germany.
4 Instituto de Física de Líquidos y Sistemas Biológicos (IFLYSIB), UNLP-CONICET, La Plata, Argentina and Departamento de Física, Facultad de Ciencias Exactas, Universidad Nacional de
La Plata, c.c. 16, suc. 4, 1900 La Plata, Argentina.
5Institute for Solid State Physics, Karlsruhe Institute of Technology, Hermann-v.-Helmholtz-Platz 176344 Karlsruhe, Germany.
*Correspondence to: [email protected].
†These authors contributed equally to the present work.
‡Current address: Institute for Solid State Physics, Karlsruhe Institute of Technology,
Abstract:
Abstract: Cuprates exhibit antiferromagnetic, charge-density-wave (CDW), and high-temperature
superconducting ground states that can be tuned by doping and external magnetic fields. However,
disorder generated by these tuning methods complicates the interpretation of such experiments.
Here, we report a high-resolution inelastic x-ray scattering study of the high-temperature
superconductor YBa2Cu3O6.67 under uniaxial stress, and show that a three-dimensional long-range-ordered CDW state can be induced by pressure along the a-axis, in the absence of magnetic fields. A pronounced softening of an optical phonon mode is associated with the CDW transition. The
amplitude of the CDW is suppressed below the superconducting transition temperature, indicating
competition with superconductivity. The results provide insights into the normal-state properties
of cuprates and illustrate the potential of uniaxial-pressure control of competing orders in quantum
Main Text:
Moderately doped high-temperature superconductors show a ubiquitous tendency towards
charge order (1). Manifestations of charge ordering include striped order in lanthanum-based
cuprates (2, 3) – an incommensurate modulation of both charge and spin that suppresses
superconductivity – and a biaxial charge density wave (CDW) with quasi-two-dimensional (2D)
short-range order in the CuO2 planes of all other cuprate families (4-12). The origin of CDW order and its relationship with superconductivity are widely debated issues. It is well-established that
static CDW order and superconductivity compete, however it is not clear whether the two orders
are best described as mutually incompatible (7, 8), as different manifestations of the same pairing interaction (13), or as different aspects of a composite order parameter (14, 15). These issues have
direct and important implications for the mechanism of high-temperature superconductivity
(HTSC).
The YBa2Cu3O6+x (YBCO6+x) family has been particularly well studied because doping-induced structural disorder is less severe than in other families. In this compound, the competition
between superconductivity and CDW order is evidenced by the depression of the CDW amplitude
upon cooling below the superconducting transition temperature, Tc, (7,8) and by its enhancement in magnetic fields that weaken superconductivity (8,9). Nuclear Magnetic Resonance (NMR) and
x-ray studies further showed that in fields larger than ~15 T a 3D long-range ordered uniaxial CDW
(16-19) is induced. This 3D order is distinct from the 2D one, although they coexist and are related to each other; for instance, they have the same in-plane incommensurability. The 3D order has an
identifiable thermodynamic transition (20-22), whereas the 2D CDW onsets gradually (23-24), and it is not clear whether it constitutes an alternative ground state, or is, for example, a vestige of the
Here we use inelastic x-ray scattering (IXS) on a sample of YBCO6.67 (Tc = 65K, doping p = 0.12) to show that uniaxial pressure along the crystallographic a axis can induce long-range 3D
CDW order, in the absence of a magnetic field.
We first specify why we chose to work with uniaxial pressures. In the doping range of
interest (0.08 < 𝑝 < 0.15), hydrostatic pressure yields, through self-doping and other effects, an
increase of 𝑇) (25). A recent study of the biaxial charge modulation further revealed its rapid
suppression under hydrostatic pressure (26). However, it has long been established that, at least in
the limit of low pressures, the effect of hydrostatic pressure on 𝑇)reflects a net sum of larger effects
of uniaxial pressures that almost cancel each other out (27,28). In particular, close to p~0.12 where the charge modulation is maximized, uniaxial pressure applied along the a-axis suppresses 𝑇) (ref.
29 and 30)
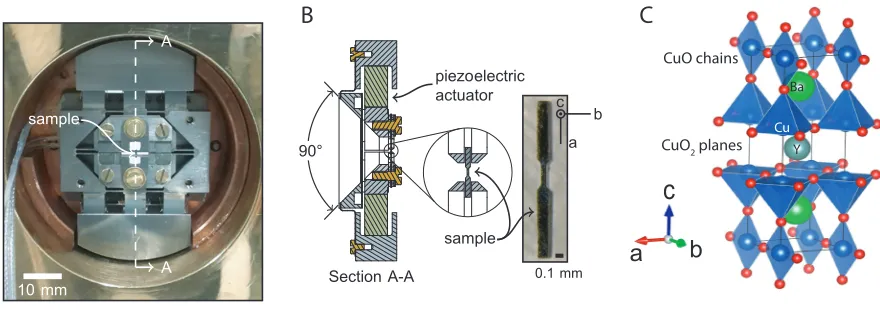
In this study, we pressurized the sample using a piezoelectric-based apparatus similar to
that used in recent studies of ruthenium oxides (31-33), but modified to allow x-ray transmission through the apparatus and the sample. For maximum scattering intensity, the thickness of the
sample should match the absorption length at the working wavelength [𝜆 = 0.6968 Å for this
experiment], which is ~ 40 µm. However, to withstand strong compression without buckling, the length-to-thickness ratio of the sample cannot be too large (31), and a 40 µm thickness implies a length that is inconveniently short for reliable mounting. Therefore, we prepared a thicker needle
from a YBCO6.67 single crystal, then used a plasma focused ion beam to thin down to 40 µm thickness the central portion over ~200 µm (Fig. 1). The x-ray beam, with a spot of 50x40µm2, was considerably smaller than the thinned central portion of the sample, so highly uniform strain is
expected in the probed volume. All the strain values in this paper are calculated using the
peak and the changes in Tc (30). The highest compression we reached was 𝜀11~ − 1.0%, where ac
susceptibility measurements showed that Tc decreases (at a rate increasing with strain) to 48±5 K (30).
The data on the 2D biaxial CDW are shown in Fig. 2. The scattering intensity of the biaxial
CDW peaks at the reduced momentum transfer q2D = (h,k,l) = (0,0.31,0.5), in reciprocal lattice units (r.l.u.) of the orthorhombic crystal structure (7, 8). The 3D CDW peaks, in contrast, at 𝒒67=
(0,0.31,1) (16-19). In the rest of the paper, we will mostly refer to the total momentum transfers
𝑸97 = (H,K,L) = (0,0.31,6.5) and 𝑸67 = (0,0.31,7) around which measurements were carried out,
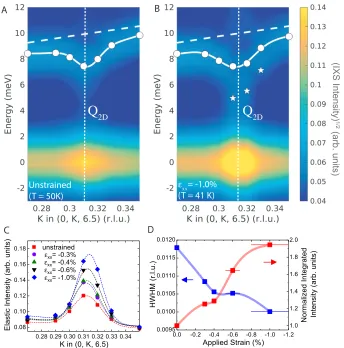
and where the structure factor of the CDWs is maximum (34,35). The color maps in Figs. 2, A-B show the raw IXS intensity at 𝜀11 = 0% (Fig. 2A) and at -1.0% (Fig. 2B). Both data sets were
measured below Tc (30). Two characteristic features of the CDW are clearly visible: the
quasi-elastic ‘central’ peak at 𝑸97 and the superconductivity-induced Kohn anomaly in the phonon
spectra. In unstrained conditions, the latter consists of a ~15% softening of the low lying acoustical
phonon (at ~8 meV) at 𝑸97 (35). Comparing the two panels, it can be seen that the quasi-elastic
peak is enhanced by the applied pressure. In Fig. 2C, it is seen that this enhancement occurs
smoothly. At the highest strain, the integrated intensity of the peak is a little over two times larger
than that of the unstrained sample (Fig. 2D). Its half-width-at-half-maximum (HWHM) 𝜎, which
is inversely proportional to the modulation correlation length 𝜉 =9=>< , decreases modestly under
pressure (Fig. 2D). We did not resolve any shift of 𝑸97 with 𝜀11 . Finally, a comparison of Figs. 2,
A and B reveals an increase of the low energy spectral weight under pressure. Its phenomenology
and relation to the Kohn anomaly will be discussed below.
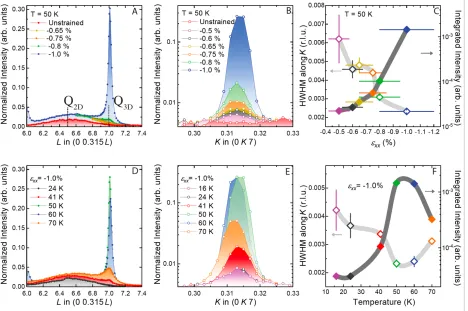
We observe a much more notable response to uniaxial pressure in the scattering pattern at
line at T = 50 K (Fig. 3A). At 𝜀11 = −0.8%, a small, narrow peak appears at 𝑸67. When the compression is further increased, to 𝜀11 = −1.0%, this peak becomes much more intense. It
appears on top of the broad profile centered around 𝑙 = 0.5 (𝐿 = 6.5) that arises from the 2D
CDW. The profile of the 3D peak along 𝐾 is shown on Fig. 3B. A weak 3D peak is visible at
compressions as low as 𝜀11 = −0.5%, however the increase in intensity from 0.8 to 1.0%
compression dwarfs the evolution at lower compressions. The evolution of the integrated intensity,
and the HWHM along K, are shown in Fig. 3C. At 𝜀11 = −1.0%, the HWHM is 𝜎F~0.002 r.l.u. It
is resolution-limited along L (𝜎)~0.02 r.l.u). These correspond to respective (lower bounds for the)
correlation lengths of 𝜉F =9=><
G~80𝑏~310Å and 𝜉) =
<
9=>I~ 8𝑐~94Å (the limitations of the
scattering geometry did not permit investigation of 𝜉L). These correlation lengths are larger than
the values reported under a field of 26 T. The correlation lengths of the 2D CDW at 1.0%
compression are 𝜉F97~ 16𝑏~65Å and 𝜉)97~ 𝑐~12Å. To estimate the correlation volume Ξ =
𝜉L× 𝜉F× 𝜉), we estimate 𝜉L~ 𝜉F for both the 2D and 3D CDWs. For the 3D order we find
Ξ~51000 unit cells under uniaxial pressure for 𝑇~𝑇), exceeding by more than two orders of
magnitude that of the 2D CDW at ambient conditions (Ξ~250 unit cells).
The temperature evolution of the 3D CDW at 𝜀11 = −1.0% is shown in Fig. 3, D-F. The
peak is very strong at 60 K, and is weaker but still visible at 70 K. That is higher than the onset
temperature of the 3D order observed under high field, and higher than the Tc of the unstressed
sample. On the low-temperature side, strong competition with superconductivity is apparent. At
T=41 K (i.e. below Tc), the peak at 𝑸67 has already lost ~90% of the integrated intensity recorded at 50K and can hardly be distinguished from the background of the 2D order at lower temperatures.
To gain further insights on the relationship between the 2D and 3D orders, we investigate
the pressure and temperature dependence of the phonon modes in the inelastic part of the spectra.
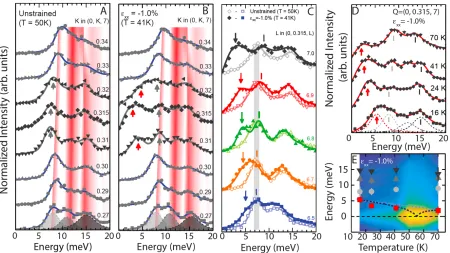
In Fig. 4A, we show the phonon spectra in the absence of applied pressure at T=50 K, along the (0, K, 7) direction. Well away from 𝑸67,three peaks are visible. These are well reproduced in ab initio
lattice dynamics calculations (30), and correspond respectively to an acoustic phonon mode of the
Δ′U irreducible representation (36) at ~8 meV, two optical modes (Δ´< and Δ´U) at ~11 meV (which
are not resolvable in the measurement), and another Δ´< optical mode at ~15 meV. It can be seen
that, in the absence of strain, the acoustic mode softening associated with the 2D CDW (34), and
shown at 𝑸97 in Fig. 2A, extends along L and is visible at 𝑸67.
In Fig. 4B, we show the same spectra but with 𝜀11= −1.0% and T = 41 K (to stay below
Tc). Away from 𝑸67, the spectra are essentially unchanged. Near 𝑸67, on the other hand, a very
strong phonon softening is observed, albeit not of the acoustic mode, which now disperses exactly
as predicted by the ab initio calculations as K is swept through 𝑸67. In other words, the Kohn anomaly seen in Fig. 4A, at T=50 K and 𝜀11 = 0%, is no longer present under 𝜀11 = −1.0%. This
suppression of the acoustical Kohn anomaly can also be seen in Fig. 4C, where we show the
L-dependence of the phonon spectra from 𝑸97 to 𝑸67 for both 𝜀11 = 0 and 𝜀11 = −1.0%. Without
pressure, the acoustical phonon is soft along the entire L-line, in agreement with the data in Fig.
4A. At 𝜀11 = −1.0%, we can follow the hardening of the acoustical mode, i.e. the disappearance
of the Kohn anomaly, as we traverse from 𝑸97 to 𝑸67. The mode that softens approaching 𝑸67 is
a distinct feature, which we therefore identify as one of the optical modes. Figures 4, D and E
show the temperature dependence of the phonon modes at Q3D. At 70 K the optical phonon is already very soft, which indicates that, unlike the acoustical Kohn anomaly, the optical mode
softening is not induced by superconductivity. At 50 and 60K, the soft phonon mode cannot be
2H-NbSe2 (37)), this suggests a complete softening of this mode. The mode hardens again below 50K, as the long-range CDW order disappears in the superconducting state.
The unambiguous identification of the soft phonon among the 36 allowed optical modes
(38) is not a trivial task. Interestingly, both Δ′< and Δ′U representations include an oxygen
bond-stretching phonon around 60 meV (39) that exhibits pronounced dispersion anomalies close to 𝑸𝟑𝑫
(40). The buckling mode (Δ′<) also softens anisotropically along the 010 direction upon entering
the superconducting state (41). Various scenarios have been discussed, attributing these anomalies
to e.g. coupling of the phonons to dispersive collective charge excitations (42, 43) or to
hybridization with lower energy branches of the same symmetry (44).
Further work is required to determine which of these optical modes is driven soft under
uniaxial pressure, whether the softening is complete (a continuous hardening of the soft-phonon
upon cooling through Tc at 𝑸𝟑𝑫cannot be completely ruled-out with the data at hand – see Fig. 4E)
and to understand the mechanism yielding the disappearance of the acoustical phonon Kohn
anomaly at 𝑸67. The absence of phonon softening in single-electron calculations indicates that
electronic correlations need to be included in any theoretical treatment of the phonon softening and
CDW formation (45).
From a theoretical point of view, unidirectional CDW are unstable against disorder, and a
vestigial nematic state is expected instead. It has previously been discussed how short-range biaxial
modulation of the charge density might emerge from an intrinsic unidirectional CDW instability in
presence of quenched disorder (23, 46, 47), which locally reorients small uniaxial domains.
Inhomogeneous distribution of the disorder strength has been invoked (18) to explain the
appearance of long range unidirectional 3D order alongside with an increase of the 2D order under
of the 2D one, this process occurs on top of a general strengthening of CDW order as
superconductivity is suppressed by the magnetic field, and inhomogeneity in the strength of
disorder allows spatially-separated, coexisting domains of 2D and 3D order.
Similarly, our data indicate that strain tuning efficiently strengthens the CDW and supports
the formation of the 3D order, likely primarily in those regions where the pinning strength is the
weakest. It will be interesting to see in the future whether the strength of the 2D order does
eventually decrease as strain is further increased. More generally, further theoretical work is
required to understand the strain-induced strengthening of the CDW, which cannot be solely
attributed to the competition with superconductivity because the 3D CDW peak can already be
induced above the nominal 𝑇) of the sample.
We conclude by noting that uniaxial stress will allow the relationship between the
superconductivity and CDW to be investigated with high precision in future experiments. A
magnetic field suppresses type-II superconductivity inhomogeneously, thanks to the presence of
vortices, resulting in broad transitions. In contrast, the homogeneous tuning provided by stress
could for instance allow to determine using thermodynamic probes whether the CDW and
superconductivity can coexist microscopically. Our piezoelectric-based apparatus constitutes a
versatile tool that can be implemented in a large variety of experimental setups, in particular at
References and Notes:
1. B. Keimer, S. A. Kivelson, M. R. Norman, S. Uchida, J. Zaanen, Nature518, 179-186 (2015).
2. J. M. Tranquada, B. J. Sternlieb, J. D. Axe, Y. Nakamura, S. Uchida, Nature375, 561-563
(1995).
3. M. Vojta, Advances in Physics58, 699-820 (2009).
4. J. E. Hoffman et al., Science295, 466 (2002).
5. C. Howald, H. Eisaki, N. Kaneko, M. Greven, A. Kapitulnik, Phys. Rev. B67, 014533 (2003).
6. W. D. Wise et al., Nature Physics4, 696-699 (2008).
7. G. Ghiringhelli et al., Science337, 821-825 (2012).
8. J. Chang et al., Nature Physics8, 871-876 (2012).
9. S. Blanco-Canosa et al., Phys. Rev. Lett. 110, 187001 (2013).
10. T. P. Croft, C. Lester, M. S. Senn, A. Bombardi, S. M. Hayden, Phys. Rev. B89, 224513
(2014).
11. E. H. da Silva Neto et al., Science Advances2, 1600782 (2016).
12. W. Tabis et al., Phys. Rev. B96, 134510 (2017).
13. A. Perali, C. Castellani, C. Di Castro, M. Grilli, Phys. Rev. B54, 16212 (1996).
14. S. A. Kivelson, E. Fradkin, V. J. Emery, Nature393, 550-553 (1998).
15. L. E. Hayward, D. G. Hawthorn, R. G. Melko, S. Sachdev, Science343, 1336-1339 (2014).
16. T. Wu et al., Nature Communications6, (2015).
17. S. Gerber et al., Science350, 949-952 (2015).
18. H. Jang et al., Proceedings of the National Academy of Sciences113, 14645-14650 (2016).
19. J. Chang et al., Nature Communications7, 11494 (2016).
20. F. Yu et al., Proceedings of the National Academy of Sciences113, 12667-12672 (2016).
21. D. LeBoeuf et al., Nature Physics9, 79-83 (2013).
23. L. Nie, L. E. H. Sierens, R. G. Melko, S. Sachdev, S. A. Kivelson, Phys. Rev. B92, 174505
(2015).
24. Y. Caplan, G. Wachtel, D. Orgad, Phys. Rev. B92, 224504 (2015).
25. S. Sadewasser, J. S. Schilling, A. P. Paulikas, B. W. Veal, Phys. Rev. B61, 741-749 (2000).
26. S. M. Souliou et al., Phys. Rev. B 97, 020503 (2018).
27. C. Meingast et al., Phys. Rev. Lett.67, 1634 (1991).
28. U. Welp et al., Phys. Rev. Lett.69, 2130-2133 (1992).
29. O. Kraut et al., Physica C: Superconductivity205, 139-146 (1993).
30. Materials and methods are available as supplementary materials.
31. C. W. Hicks et al., Science344, 283-285 (2014).
32. C. W. Hicks, M. E. Barber, S. D. Edkins, D. O. Brodsky, A. P. Mackenzie, Review of
Scientific Instruments85, 065003 (2014).
33. A. Steppke et al., Science355, 148 (2017).
34. M. Le Tacon et al., Nature Physics10, 52-58 (2014).
35. E. M. Forgan et al., Nature Communications6, 10064 (2015).
36. K.-P. Bohnen, R. Heid, M. Krauss, Europhys Lett64, 104-110 (2003).
37. F. Weber et al., Physical Review Letters 107, 107403 (2011).
38. In presence of the oxygen-superstructure at this doping level (Ortho-VIII), even more phonons
can be expected (36 is the number of optical modes expected for the ortho-I structure of
YBa2Cu3O7).
39. D. Reznik et al., Nature440, 1170-1173 (2006).
40. D. Reznik, Physica C: Superconductivity481, 75-92 (2012).
41. M. Raichle et al., Phys. Rev. Lett.107, 177004 (2011).
42. L. Chaix et al., Nature Physics13, 952 (2017).
43. E. Kaneshita, M. Ichioka, K. Machida, Phys. Rev. Lett.88, 115501 (2002).
45. Z. P. Yin, A. Kutepov, G. Kotliar, Phys. Rev. X3, 021011 (2013).
46. J. A. Robertson, S. A. Kivelson, E. Fradkin, A. C. Fang, A. Kapitulnik, Phys. Rev. B74,
134507 (2006).
47. A. Del Maestro, B. Rosenow, S. Sachdev, Phys. Rev. B74, 024520 (2006).
48. C. T. Lin, W. Zhou, W. Y. Liang, E. Schönherr, H. Bender, Physica C: Superconductivity 195, 291 (1992).
49. M. Lei, J. L. Sarrao, W. M. Visscher, T. M. Bell, J. D. Thompson, A. Migliori, U. W.
Welp, B. W. Veal, Phys. Rev. B 47, 6154 (1993).
50. S. G. Louie, K.-M. Ho, M. L. Cohen, Phys. Rev. B 19, 1774 (1979).
51. C. Elsässer, N. Takeuchi, K.-M. Ho, C. T. Chan, P. Braun, M. Fähnle,
J. Phys.: Condens. Matter 2, 4371 (1990).
52. L. Hedin and B. I. Lundqvist, Journal of Physics C: Solid State Physics 4, 2064 (1971).
53. K. P. Bohnen, R. Heid, M. Krauss, Europhysics Letters 64, 104 (2003).
54. R. Heid and K. P. Bohnen, Physical Review B 60, R3709 (1999). 55. E. Burkel, Report on Progress in Physics 63, 171 (2000).
Acknowledgments: We thank T. P. Devereaux, M.-H. Julien, S. Kivelson, D. Leboeuf, C. Meingast, J. Schmalian and L. Taillefer for fruitful discussions, and FEI for assistance with the
PFIB sample preparation.
Funding:
Author contributions: IXS experiments were carried out by S.M.S., H.-H.K., E.L., M.M., M.T., A.B. and M.L.T. IXS data were analyzed by S.M.S. and M.L.T. XRD experiments were carried out by H.-H.K.,
M.E.B., N.N., R.A.B., and C.W.H. performed the susceptibility measurements. Single crystals studied in
this work were prepared by J.P., T.L. and S.M.S. PFIB preparation was carried out by P.M.M. and M.K.
The strain devices used in this study were built by C.W.H. with assistance from M.L.T., H.-H.K., and E.L.
S.M.S. and M.L.T. conceived the project. A.P.M., B.K., C.W.H. and M.L.T. supervised the project. M.L.T.
and C.W.H. wrote the manuscript with input from all the coauthors.
Competing interests: C.W.H. has 31% ownership of Razorbill Instruments, which has commercialized apparatus on which that used in this work are based.
Data and materials availability: Raw data and simulation codes used for all figures in this paper and the supplementary materials are available at http://dx.doi.org/10.5445/IR/1000086708
Fig. 1 Strain device (A) Photograph of the Piezo-electric device (B) Sectional cut of the device and picture of the Focused-Ion-Beam-thinned sample used for this experiment. (C) Unit cell of
YBa2Cu3O6+x (here with x=1). Strain is applied perpendicular to the CuO chains.
sample
10 mm
A A
piezoelectric actuator
sample
Section A-A 90°
0.1 mm c
b a
A B C
a
c
b CuO chains
CuO2 planes Y
Ba
Fig. 2. Strain dependence of the IXS spectra around 𝑸𝟐𝑫. (A) IXS intensity vs total momentum transfer for the unstrained sample at T < Tc. Square root of the intensity has been plotted to enhance
the contrast between the phonon and the elastic line. The calculated dispersion of the low-lying
acoustical mode is plotted as a dashed line. The plain line is a guide to the eye to the observed
dispersion of this mode (fitted values are represented by the dots). (B) Same as in (A), but for 𝜀11 =
−1.0% (the stars indicate the energy of the soft optical phonon). (C) Strain-dependence of the
quasi-elastic line intensity across 𝑸𝟐𝑫 along the (0, K,6.5) direction. (D) Strain dependence of the
half-width-at-half-maximum and of the integrated intensity (normalized to the unstrained value) of
the quasi-elastic line at 𝑸𝟐𝑫, integrated along K and normalized to the unstrained value. 0.0 -0.2 -0.4 -0.6 -0.8 -1.0 -1.2
0.0095 0.0100 0.0105 0.0110 0.0115 0.0120 1.0 1.2 1.4 1.6 1.8 2.0
Applied Strain (%)
H W H M (r .l. u .) N o rm a liz e d In te g ra te d In te n si ty (a rb . u n its )
0.28 0.29 0.30 0.31 0.32 0.33 0.34 0.08 0.10 0.12 0.14 0.16 0.18
εxx= -0.6% unstrained
εxx= -1.0% εxx= -0.4% εxx= -0.3%
E la st ic In te n si ty (a rb . u n its )
K in (0, K, 6.5)
B
C D
A
Unstrained (T = 50K)
εxx= -1.0%
(T = 41 K)
Q
2DQ
2D(IXS Intensity)
1/2
Fig. 3. Strain dependence of the quasi-elastic line at 𝑸𝟑𝑫. (A) Quasi-elastic intensity at T= 50 K along the (0 0.315 L) direction as function of a-axis compression 𝜀11. (B) Quasi-elastic intensity
at T= 50 K along the (0 K 7) direction as function of a-axis compression 𝜀11. (C) Strain dependence
of the HWHM and the integrated intensity along the (0 K 7) direction at T=50 K. (D) Temperature
dependence of the quasi-elastic intensity along the (0 0.315 L) direction for 𝜀11 = −1.0%. (E)
Temperature dependence of the quasi-elastic intensity along the (0 K 7) direction for 𝜀11 =
Fig. 4. Strain dependence of the phonon spectra around 𝑸67. (A) Inelastic x-ray scattering intensity (elastic line has been subtracted (30) recorded below Tc along the (0 K 7) direction, in the absence
of strain (at T = 50 K) and (B) for 𝜀11 = −1.0% (T = 41 K). In both panels, the red lines represent
the calculated structure factor of the phonons (30), the gray arrows indicate the acoustical phonon,
the red ones the soft optical mode. (C) L-dependence of the inelastic spectra below Tc without
(open symbols – T =50 K) and with 𝜀11 = −1.0% applied strain (closed symbols– T =41 K). The
ticks correspond to the energy of the acoustical mode in the strained case, the arrows to that of the
soft optical phonon. (D) Temperature dependence of the phonon spectra at 𝑸67 for 𝜀11 = −1.0%. Solid lines in panels (A)-(D) correspond to the least square fitting of the data (30) (E) Phonon
energy vs temperature superimposed to the IXS intensity color map (log scale) at 𝑸67for 𝜀11 =
−1.0%. Dotted lines are guide to the eyes for possible scenarios for the temperature dependence