Contents lists available atScienceDirect
Geoderma
journal homepage:www.elsevier.com/locate/geoderma
E
ff
ects of cropping systems upon the three-dimensional architecture of soil
systems are modulated by texture
Aurelie Bacq-Labreuil
a,⁎, John Crawford
b, Sacha J. Mooney
a, Andrew L. Neal
b, Elsy Akkari
b,
Cormac McAuli
ff
e
b, Xiaoxian Zhang
b, Marc Redmile-Gordon
b,1, Karl Ritz
aaDivision of Agriculture & Environmental Sciences, School of Biosciences, University of Nottingham, Sutton Bonington Campus, Leicestershire LE12 5RD, UK bSustainable Agriculture Science, Rothamsted Research, West Common, Harpenden, AL5 2JQ, UK
A R T I C L E I N F O
Handling editor: Yvan Capowiez
Keywords:
X-ray CT Cropping systems 3D image analysis Porosity
Pore size distribution Pore connectivity
A B S T R A C T
Soil delivers fundamental ecosystem functions via interactions between physical and biological processes mediated by soil structure. The structure of soil is also dynamic and modified by natural factors and management intervention. The aim of this study was to investigate the effects of different cropping systems on soil structure at contrasting spatial scales. Three systems were studied in replicated plotfield experiments involving varying degrees of plant-derived inputs to the soil, viz. perennial (grassland), annual (arable), and no-plant control (bare fallow), associated with two contrasting soil textures (clayey and sandy). We hypothesized the presence of plants results in a greater range (diversity) of pore sizes and that perennial cropping systems invoke greater structural heterogeneity. Accordingly, the nature of the pore systems was visualised and quantified in 3D by X-ray Computed Tomography at the mm andμm scale. Plants did not affect the porosity of clay soil at the mm scale, but at theμm scale, annual and perennial plant cover resulted in significantly increased porosity, a wider range of pore sizes and greater connectivity compared to bare fallow soil. However, the opposite occurred in the sandy soil, where plants decreased the porosity and pore connectivity at the mm scale but had no significant structural effect at theμm scale. These data reveal profound effects of different agricultural management systems upon soil structural modification, which are strongly modulated by the extent of plant presence and also contingent on the inherent texture of the soil.
1. Introduction
Soil structure is dynamic and subject to modification by natural and anthropogenic actions, such as wetting-drying cycles and freeze-thaw action. These processes re-structure the soil with potential con-sequences for physical and biological processes (Rabot et al., 2018). Water flow and gas diffusion are both affected by the porous archi-tecture (Naveed et al., 2016). The nature and magnitude of soil mi-crobial activity are affected by the air-water balance in soil and the availability of nutrients, and microbial communities are strongly af-fected by their microenvironment in soil (Chenu, 1993;Helliwell et al., 2014). Soil microbes, along with plant roots, are implicated in ag-gregation processes via gluing and enmeshing activity (Tisdall and Oades, 1982). Microbial communities can contribute to aggregate sta-bility and therefore help prevent de-structuring of soil structure (Chenu
and Cosentino, 2011;Dorioz et al., 1993;Oades, 1993). This, in turn, might lead to the capacity of soils to adapt to changing environmental circumstances (Crawford et al., 2012;Feeney et al., 2006).
Tillage practices have a significant direct influence impact on soil structure, often increasing the macro-porosity of conventionally man-aged soils (Ambert-Sanchez et al., 2016). Conventional tillage can also result in depletion of nutrients and organic carbon within the soil (Coleman et al., 1997) and a decline in aggregated structure (Watts et al., 2001). Studies of a long-term (40+ years)field experiment at Rothamsted Research (Harpenden, UK) in which grassland was con-verted to arable and bare fallow managements has resulted in a decline of soil organic carbon and nitrogen (Gregory et al., 2016) and a de-crease in microbial abundance under the different managements (Hirsch et al., 2009). These studies focused on soil biological and che-mical properties (such as microbiota, pH, organic carbon). However,
https://doi.org/10.1016/j.geoderma.2018.07.002
Received 16 February 2018; Received in revised form 28 June 2018; Accepted 2 July 2018 ⁎Corresponding author.
1Current address: Catchment Sensitive Farming, Natural England, Guildbourne House, Worthing, BN11 1LD, UK.
E-mail addresses:[email protected](A. Bacq-Labreuil),[email protected](J. Crawford), [email protected](S.J. Mooney),[email protected](A.L. Neal),[email protected](E. Akkari),
[email protected](X. Zhang),[email protected](M. Redmile-Gordon),[email protected](K. Ritz). Geoderma 332 (2018) 73–83
0016-7061/ © 2018 The Authors. Published by Elsevier B.V. This is an open access article under the CC BY license (http://creativecommons.org/licenses/BY/4.0/).
there is no information on the structure of the pore networks of the soils under these long-term managements.
The aim of this study was to identify any effects of different crop-ping managements associated with contrasting degrees of plant pre-sence on soil structure in the context of two soil textural classes. Three long-term field cropping systems were studied: grassland (perennial plant), arable (annual plant) and bare fallow (no plant). We hypothe-sized that cropping management influences the inherent soil structural properties by (i) the presence of plants resulting in greater soil porosity and range of soil pore diameters due to root action; and (ii) a more persistent presence of plants invokes greater porosity and structural heterogeneity, apparent as a wider range of pore sizes in perennial systems. Structural properties of the soils were determined at two spatial scales of sample and resolution, i.e. ‘core’scale (435 cm3 at 40μm resolution) and‘aggregate’scale (circa 4 mm3at 1.5μm resolu-tion). To establish the functional consequences of such structures for water flow in the soils, we also estimated their saturated hydraulic conductivity at both scales using a pore-scale modelling approach.
2. Materials and methods
2.1. Soils
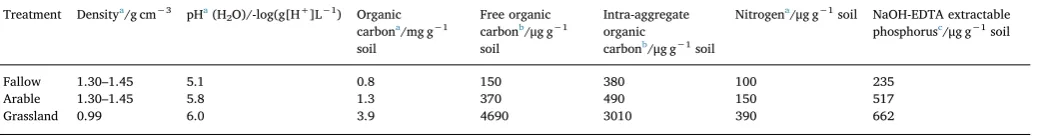
[image:2.595.42.566.648.716.2]Soil cores were collected in October 2015 at Rothamsted Research (Hertfordshire, UK) from two complementary long-term experiments: Highfield Ley-Arable experiment (LATLONG 51.8103N, -0.3748E), on a silty-clay loam textured soil developed on clay-with-flints over Eocene London Clay (Batcome series) and classified as a Chromic Luvisol by FAO criteria (hereafter referred to as clay soil,Table 1); and Woburn Ley-Arable experiment (LATLONG 52.0009N, -0.6137E), on a well-draining, sandy loam soil of the Cottenham Series (Hodge et al., 1984), classified as a Cambric Arenosol (FAO), (referred to as sandy soil, Table 1). The replication of the treatments was uneven and based on the inherent experimental plot design. Four cylindrical cores (68 mm dia-meter × 120 mm height) of the grassland and arable treatments and three replicate cores of the bare fallow treatment were extracted for the clay soil from the surface down to the height of the columns minus 1 cm (110 mm). Four cores of the grassland, arable with manure (25 t ha−1annum−1; hereafter referred to as arable manure) and bare fallow treatments andfive replicate cores of the arable with inorganic fertiliser (10 kg N ha−1y−1; hereafter referred to as arable inorganic) were collected for the sandy soil. For both soil types, the arable treat-ment was under conventional tillage, ploughed to a depth of 23 cm, once a year. The arable fields for the clay and sandy soil was last ploughed respectively in September and October 2014 before sampling. The fallow plots were rotavated in June 2015 for the clay soil and tined in April 2015 for the sandy soil before sampling. All replicates were independent and derived from separate plots. All treatments had been maintained for at least 50 years. After sampling, cores were stored at 4 °C prior to further analysis.
2.2. X-ray computed tomography (CT)
Soil cores were scanned using a Phoenix v∣tome∣x M scanner (GE Measurement and Control solution, Wunstorf, Germany), set at 160 kV, a current of 180μA, detector sensitivity of 200% and at a pixel/voxel resolution of 40μm (resultant voxel volume = 64,000μm3). A total of 2900 projection images were taken at 250 ms per image using an averaging of 1 image and skip of 0. Total scan time per core was 24 min. After scanning, each core was dismantled, and the soil passed through a sieve series of 4, 2 and 0.71 mm. Three randomly-selected aggregates retained between the 2 and 0.71 mm sieves per core were scanned using a Phoenix Nanotom®(GE Measurement and Control solution, Wunstorf, Germany) set at 90 kV, a current of 65μA and at a base resolution of 1.51μm (resultant voxel volume = 3.44μm3). A total of 1440 projec-tion images were taken at 500 ms period using an averaging of 3 images and skip of 2. The total scan time per sample was 69 min.
Reconstruction of all scanned images was processed using Phoenix datos∣x2 rec reconstruction software. Scanned images were optimised to correct for any movement of the sample during the scan and noise was reduced using the beam hardening correction algorithm, set at 8. As a multi-scan routine was performed on the core samples, VG StudioMax® 2.2 was used to merge the top and bottom scans to obtain a single 3D volume for the complete core. For both core and aggregate samples, image sequences were extracted (dimensions described below) for image analysis. Core samples were scanned at the prevailing water content following sampling (approximately field capacity). Soil ag-gregates were derived from these cores following air-drying overnight and the moisture content recorded. The soil was passed through 4, 2 and 0.71 mm mesh size sieves while subjected to horizontal shaking for 3 min at 300 rotations min−1. Twenty aggregates were randomly se-lected from between the 2 and 0.71 mm sieves, and conserved in sealed containers in the dark at room temperature.
2.3. Image analysis
Initial image analysis was performed using ImageJ (Schneider et al., 2012). For both soil cores and aggregates, a uniform region of interest (ROI) was defined for each sample; 40 × 40 × 40 mm and 0.981 × 0.725 × 0.604 mm respectively. Core ROIs were positioned centrally to limit inclusion of cracks or large stones created during the sampling process. Cubic ROIs for aggregates were not possible because of their variable geometry, so the largest ROI accommodated by all aggregates was chosen. The coordinates of these regions were adapted for each image volume/sequence. The image pre-processing consisted of: (i) cropping to the ROI; (ii) enhancing the contrast/brightness to 0.35%; (iii) application of a 2-pixel radius medianfilter; (iv) converting the image format to 8-bit; (v) saving the new image volume. Stones were segmented from the ROI volume in VG StudioMax®2.2 using the surface determination tool.
All images were thresholded using the bin bi-level threshold ap-proach byVogel and Kretzschmar (1996)using the open source soft-ware QuantIm (http://www.quantim.ufz.de/). Each image within the image sequence has a single threshold value, to determine the
Table 1
Summary physical and chemical data of Highfield Ley-Arable experiment soils.
Treatment Densitya/g cm−3 pHa(H
2O)/-log(g[H+]L−1) Organic
carbona/mg g−1
soil
Free organic carbonb/μg g−1
soil
Intra-aggregate organic
carbonb/μg g−1soil
Nitrogena/μg g−1soil NaOH-EDTA extractable
phosphorusc/μg g−1soil
Fallow 1.30–1.45 5.1 0.8 150 380 100 235
Arable 1.30–1.45 5.8 1.3 370 490 150 517
Grassland 0.99 6.0 3.9 4690 3010 390 662
a Gregory et al., 2016.
b Hirsch et al., 2009.
prescribed initial threshold values (T1and T2), the Li-threshold algo-rithm in ImageJ was applied to 20 images randomly selected within the image sequence. The threshold values (T1and T2) were attributed de-pending on extremes values obtained in the 20 images selected. Por-osity, pore size distribution, pore connectivity and surface density de-termined according toVogel et al. (2010). Here, total porosity refers to percentage of pores > 0.05 mm at the core scale and > 1.8μm at the aggregate scale, as per the segmented data. Pore size distribution was expressed as the proportion of each pore size as the percentage volume normalised to the total ROI volume, and also as the proportion of each pore size as the cumulative percentage volume normalised to the total pore volume. The pore size diameter was determined using a maximum opening diameter based on a numerical sphere algorithm as described by Vogel et al. (2010). Pore connectivity is derived from the Euler number and normalised by the total volume. The more negative the Euler number, the more connected the pore system. Increase of sphere opening diameter results in loss of smaller pores or pore-irregularities
due to irregular-shape pores. The surface density represents the pro-portion of transition from pore to solid which is the ratio of the pore surface area (mm2) divided by the pore volume (mm3). After the spherical opening, the numerical representation of the pore surface includes a combination of the pore-solid interface and a numerical surface placed in the middle of irregular-shaped pores (Vogel et al., 2010).
2.4. Hydraulic conductivity of aggregates and inter-aggregate pores
[image:3.595.93.499.56.509.2]It is not straightforward to measure saturated hydraulic con-ductivity (Ksat) of individual aggregates. To facilitate direct comparison ofKsatfor all sample classes, we numerically calculated the ability of inter- and intra-aggregate pores to conduct water based on the pore-scale velocity of waterflow through the pore geometry. This was si-mulated using the lattice Boltzmann model developed previously (Zhang et al., 2005, 2016; Zhang and Lv, 2007). The details of the
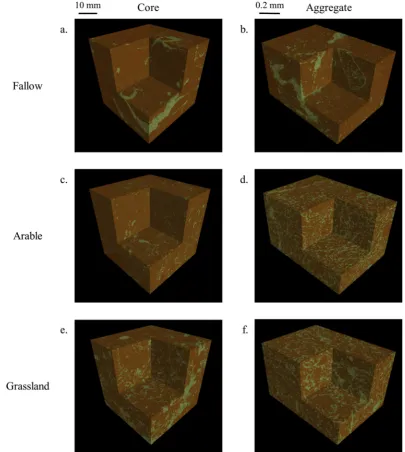
Fig. 1.3D representation of clay soils under different cropping systems visualised at core (40μm resolution; a, c, e) and aggregate (1.5μm resolution; b, d, f) scales, displayed as thresholded images denoting pore (green) or solid (brown) phases. (a, b) bare fallow; (c, d) arable; (e, f) grassland. (For interpretation of the references to colour in thisfigure legend, the reader is referred to the web version of this article.)
model and how the permeability of each image was calculated are given in Appendix A.1. Supplementary materials. The computational demand of the ROI exceeded the power of the computer facility we could access, and we were therefore unable to directly simulate waterflow in the ROI. Instead, we selected several sub-volumes, denoted as volume of interest (VOI), from each ROI to simulate waterflow through them and calculated their permeability. The model used a sparse matrix algo-rithm to store only the pore voxels, and hence the maximum size of the VOI the model can process depended on the number of pore voxels (or porosity) within it. For each ROI image, wefirst calculated its porosity and then divided it into a number of equal sub-volumes ensuring that the number of pore voxels in each sub-volume did not exceed the maximum pore voxels the model can deal with. Pre-analysis of all images revealed that the pore geometry in the aggregates was a rela-tively uniform 0.5 mm, we thus used one VOI (375∗375∗375μm) to represent one ROI. The pore geometry in the core was highly hetero-geneous, and we randomly selected three samples from the sub-volumes into which the original ROI was divided to simulate water flow and calculate their permeability.
2.5. Statistical analysis
Analysis of variance (ANOVA) was performed on all primary vari-ables using a split-plot design with cropping management and size classes of pores as factors. The relationship between the measured porosity and calculated saturated permeability was also explored using ANOVA to test for equality of slopes of log10-transformed data within the modelled VOI. All analyses were conducted using Genstat v 17.1 (VSN International Ltd. 2014).
3. Results
3.1. Effect of management on clay soil pore structure
3.1.1. 3D image assessment
Fig. 1illustrates selected 3D representations of pore architecture from the clay soil cores (Fig. 1a, c, e) and aggregates (Fig. 1b, d, f) displayed as segmented images. For the soil cores, there was a clear decrease in the number of stones respectively fallow = arable > grass (Fig. A1, Table A1). Moreover, arable soils contained larger pores (> 1 mm) than the other treatments (Fig. 1c), especially at the interface with stone material (Fig.1c). The bare fallow core generally had smaller pores (0.25–1 mm;Fig. 1a). Grass cores had a wider range of pore sizes and contained more root and organic material (Fig. 2a, A1e). A similar observation was made for soil aggregate images as the bare fallow ag-gregates comprised mostly small pores despite the presence of a few, larger pores (Fig. 1b, A1b), the arable aggregates appeared to only have smaller sized pores (Fig. 1d, A1d), and grass aggregates again showed the widest range of pore sizes (Fig. 1f, A1f).
3.1.2. 3D characteristic analysis
There were significant differences in porosity characteristics for the clay soil under each management system, which contrasted in nature between core and aggregate scales (Table 2;Fig. 1). At the core scale, total pore volume was not significantly different between treatments (Table 2). At the aggregate scale, total pore volume was significantly different under all three treatments, with a distinct ranking of grass-land > arable > fallow, and a two-fold difference between grassland and fallow (Table 2).
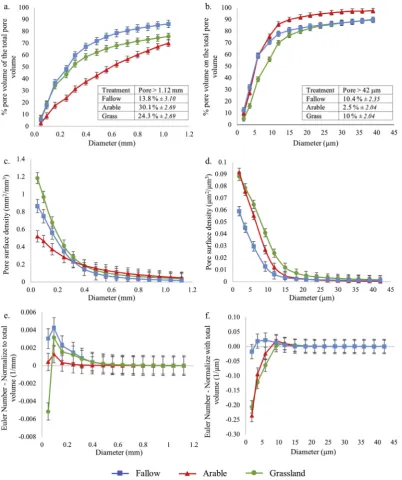
The pore size distribution normalised to the total ROI volume showed, at the core scale, for the arable treatment an equivalent pro-portion of all pore sizes < 1.12 mm, with a smaller propro-portion of pore sizes < 0.25 mm compared to grassland and fallow treatments (Fig. A2a). The proportion of pores > 1.12 mm was greater for the grassland and the arable treatments compared to fallow treatment (Fig. A2a). Cumulative pore size distributions were similar in their non-linear
character under grassland and fallow at the core scale, showing a greater proportion of pore sizes < 0.25 mm than the arable soil (i.e. > 50% of pore volume;Fig. 2a). However, the proportion of pore sizes with a diameter > 1.12 mm was significantly greater under grassland and arable than fallow (P< 0.001; Fig. 2a). In contrast, under the arable treatment, the cumulative pore size distribution was linear between 0.05 and 1.04 mm (Fig. 2a), indicating that the pores in this range were uniformly distributed. At the aggregate scale, the pro-portion of pore sizes normalised to the total ROI volume increased significantly with the increasing pore sizes up to 5.97μm for all treat-ments with a greater proportion of these pore sizes for grassland and arable treatments. For the pore sizes between 9.26 and 20.91μm, the proportion of the pore sizes decreased for all treatment, with a sub-stantial decrease for the arable compared to the grassland. There were no significant differences beyond this pore size, except for the pore sizes > 42μm with the proportion of pores ranking from arable < fallow < grassland (Fig. A2b). The cumulative pore size distributions for pores < 9.26μm under arable and fallow treatments were not significantly different, but both were significantly greater than grass-land (Fig. 2b). For pores > 11.8μm, the relationship was reversed and distributions under grassland and fallow were not significantly dif-ferent, but arable had a significantly smaller proportion of larger pores (Fig. 2b).
At the core scale, the pore-surface density was significantly different under all three treatments for pore sizes < 0.095 mm, with ranking of arable < fallow < grassland (Fig. 2c), with a two-fold difference be-tween grassland and arable. For the pore sizes < 0.25 mm, the surface density declined similarly under grassland and arable and there was no difference beyond the pore size 0.31 mm under all three treatments (P < 0.001;Fig. 2c). In contrast, at the aggregate scale, the surface density relating to the smallest pore sizes (1.86μm) was significantly reduced under fallow compared to arable and grassland, which were not significantly different (P <0.001;Fig. 2d). However, for the pore sizes between the pores 5.97μm and 11.8μm, the surface density de-creased more drastically under the arable treatment compared to the grassland, both converging towards the fallow. The surface density was not significantly different for pores > 14.9μm under all treatments (Fig. 2d).
There were no significant differences in pore connectivity between any of the treatments at the core scale (P >0.05;Fig. 2e). At the ag-gregate scale, the connectivity was significantly greater under grassland and arable treatments than fallow with respect to pores < 5.97μm, with no differences beyond this (Fig. 2f). There was no change in pore connectivity within aggregates under fallow across the size range measured (Fig. 2f).
permeability in all cases which was weakest for fallow (Fig. A3b), but as for the core-scale, there was no significant difference between the re-gression coefficients across all treatments (Table 4; overall mean 1.0 ± 0.23).
Fig. 2.Soil pore characteristics of clay soils under different cropping systems at core (40μm resolution; a, c) and aggregate (1.5μm resolution; b, d, e) scales: (a, b) cumulative pore distribution of cores; (c, d) surface density; (e, f) connectivity. Points indicate means, whiskers denote pooled standard errors.
Table 2
Total porosity in relation to management type at the core (base resolution 40μm) and aggregate (base resolution 1.5μm) scale of the clay soil, expressed as percentage of pores relative to the total volume (mean ± pooled standard error).
Treatment n Core Aggregate Fallow 3 8.07 ( ± 0.76) 14.3 ( ± 1.08) Arable 4 8.29 ( ± 0.66) 23.4 ( ± 0.94) Grassland 4 12.0 ( ± 0.66) 31.1 ( ± 0.94)
[image:5.595.37.290.623.682.2]PF 0.53 < 0.001
Table 3
Total porosity in relation to management type (expressed as percentage of pores relative to the total volume), and modelled saturated permeability, of the vo-lume of interest used for modelling, for the clay soil at the core and aggregate scale (mean ± pooled standard error).
Treatment n Core Aggregate Porosity
(%)
Permeability (mm2)
Porosity (%)
Permeability (mm2)
Fallow 3 9.3 ( ± 2.32)
387 ( ± 202) 14.8 ( ± 1.78)
0.55 ( ± 0.09) Arable 4 12.0
( ± 2.01)
702 ( ± 175) 23.0 ( ± 1.54)
0.62 ( ± 0.08) Grassland 4 16.3
( ± 2.01)
827 ( ± 175) 31.0 ( ± 1.54)
1.13 ( ± 0.08)
PF 0.54 0.38 0.002 0.003
[image:5.595.303.558.623.733.2]3.2. Effect of management on sandy soil
3.2.1. 3D image assessment
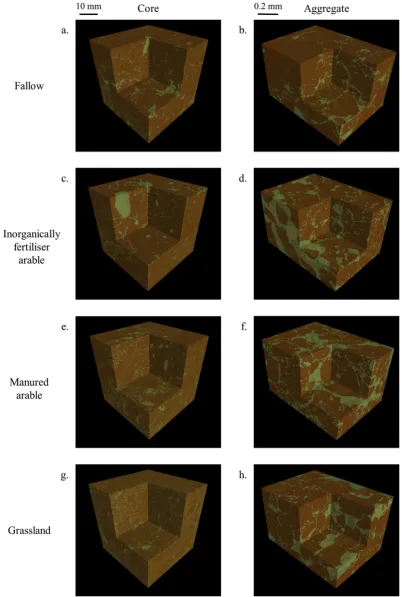
Fig. 3 and A4 illustrate the visualisation of the ROI of the four treatments. In the cores, the presence of stones decreased from bare fallow > arable inorganic equivalent to arable manure > grass (Fig. 3b, A4). The bare fallow and arable inorganic cores appeared re-latively porous and contained some large pores (Fig. 3a, c). The arable manure and grassland showed similar types of pores: mostly medium (0.25–1.0 mm) and small pores (< 0.25 mm; respectivelyFig. 3b, d). There was no significant difference in the proportion of stone for all treatments (Table A2). However, no noticeable difference was observed between the aggregates (Fig. 3, A4).
3.2.2. 3D characteristic analysis
Total porosity at the core scale was significantly greater under fallow and inorganically fertilised arable than grassland and manured arable with no significant difference between fallow and inorganically fertilised arable, nor between grassland and manured arable (Table 5). In contrast, at the aggregate scale, there were no significant differences in total porosity between any of the four treatments (Table 5).
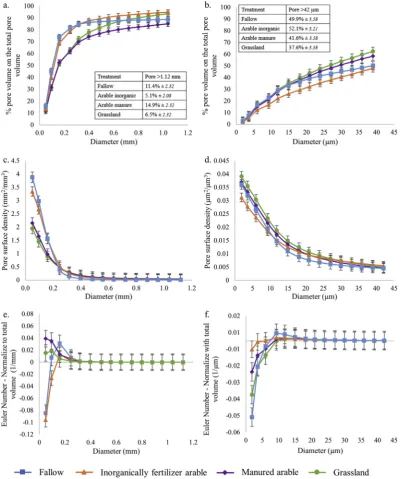
At the core scale, the pore size distribution normalised to the total ROI volume displayed contrasting behaviours for the pore sizes < 0.25 mm: inorganically fertiliser arable and fallow treatment contained the greatest proportion of the pore sizes compared to grassland and manured arable treatments (Fig. A5a). There was no difference beyond 0.25 mm, except for pores larger than 1.12 mm, here with a greater proportion for fallow and manured arable compared to grassland and inorganically fertiliser arable (Fig. A5a). The nature of the cumulative pore size distributions was different than the pore size distribution normalised to the total ROI and could be classified into three categories: fallow and inorganically fertilised arable, where 70% of the pore sizes were < 0.16 mm; manured arable where 70% of the pore sizes were < 0.32 mm and had a greater proportion of larger pores; and grassland where 70% of the pore sizes were < 0.32 mm and had a larger proportion of pores < 0.64 mm compared to manured arable. The proportion of pores > 1.1 mm ranged from 14.9% (manured arable) to 5.1% (inorganically fertilised arable), with the extremes being significantly different (Fig. 4a). The cumulative pore sizes were characterised by two distinct patterns in relation to treatment asso-ciated with fallow, inorganically fertilised arable treatments; and grassland and manured arable. For pore sizes < 0.64 mm, Fig. 4a showed a greater proportion of pore sizes smaller than 0.16 mm under fallow and inorganically fertilised arable than grassland and manured arable (respectively around 70% and 50%). The fallow and in-organically fertilised arable treatments showed a similar cumulative pore size distribution across the size range measured, with very few medium sized pores. The distribution of pore sizes under grassland and manured arable were more diverse, as indicated by greater linearity in abundance across the pore size range. Pore size distributions of grass-land and manured arable soils were similar up to a pore size of 0.56 mm and beyond this point, the distribution diverged and there was a
significantly greater proportion of the largest pore size under manured arable than grassland (Fig. 4a).
At the aggregate scale, a similar separation of the treatments was observed as for the core scale, although the cumulative pore size dis-tributions were more linear, with only a significant difference for the largest pores under fallow and inorganically fertilised arable, than for grassland and manured arable (Figs. 4b, A5b).
At the core scale, pore surface density profiles also divided into two distinct groupings: fallow and inorganically fertilised arable, and grassland and manured arable. These were significantly greater under fallow and inorganically fertilised arable than grassland and manured arable, both of which were congruent across the size range measured (Fig. 4c). The surface density at the smallest pore size (0.05 mm) was greater under fallow than inorganically fertilised arable, however for the larger pore size (> 0.05 mm) the surface density was not sig-nificantly different and decreased similarly under both treatments. For pore sizes > 0.25 mm, there were no significant differences between any of four treatments (Fig. 4c). At the aggregate scale, pore surface profiles were similar in their non-linear nature, with inorganically fertilised arable being significantly lower than other treatments over the range < 3.56μm (treatment x size classP< 0.001;Fig. 4d).
At the core scale, the connectivity was significantly greater for fallow and inorganically fertiliser arable compared to grassland and manured arable, with respect to pores < 0.09 mm, and there was no significant differences beyond this (P >0.05;Fig. 4e). At the aggregate scale, the values of pore connectivity for all treatments were relatively small, suggesting that the overall pore system for the sandy soil was poorly connected. The connectivity of pores at 1.86μm was sig-nificantly different under all four treatments with a ranking of fallow > grassland > manured arable > inorganically fertilised arable (Fig. 4f). There was then a general trend of decreasing con-nectivity above this size, with convergence of all treatments for pores > 5.97μm.
At the core scale, the soil porosity within the VOI (which was used for permeability calculations) was linearly related to the porosity of the entire core (P< 0.001), but was on average 22% less (data not shown), again revealing that centimetre-scale pore geometry was highly heterogeneous. Within the VOI, the porosity of manured arable and grassland treatments was similar (mean 17%), as was the case for inorganically fertilised arable and fallow (mean 21%), with the later pair being significantly greater than the former (P< 0.01;Table 5). At this scale, modelled permeability was not significantly different be-tween all treatments (Table 6). There was a significant positive power-law relationship between mean porosity and permeability for fallow, arable manure and grassland treatments, which was marginally sig-nificant for arable inorganic (Fig. A6a). There was no significant dif-ference between the regression coefficients of the power-law relation-ship between all treatments (Table 7; overall mean 0.68 ± 0.22). At the aggregate scale, there was a direct linear relationship between the porosity for whole aggregates and the VOI used for modelling (data not shown). There was no difference in total porosity between treatments within the VOI used for modelling permeability (Table 6; overall mean 2.22 ± 0.44). Permeability was not significantly different all treat-ments (Table 6). At this scale, there was a highly significant positive power-law relationship between porosity and permeability for all treatments (Fig. A6b). The regression coefficient was significantly greater in the case of fallow than all other treatments, and significantly smaller in the case of grassland than all other treatments, with arable and arable manure essentially the same, and median to fallow and grassland (Table 7).
4. Discussion
3D quantification of the soil architecture in terms of pore con-nectivity, pore surface density and pore size distribution, is essential for linking soil structure tofluidflow, gaseous diffusion and soil functions
Table 4
Linear regression coefficients (mean ± standard error) in relation to manage-ment type of log porosity vs. log modelled saturated permeability for the clay soil, at the core (Fig. A3a) and aggregate scale (Fig. A3b).
Treatment n Core Aggregate Coefficienta P
uncorr Coefficienta Puncorr
Fallow 9 0.27 ( ± 0.13) 0.08 0.71 ( ± 0.24) 0.02 Arable 12 0.79 ( ± 0.07) < 0.001 0.93 ( ± 0.14) < 0.001 Grassland 12 1.00 ( ± 0.15) < 0.001 1.38 ( ± 0.32) 0.002 Coefficients PF 0.01 0.30
Fig. 3.3D representation of sandy soils under different cropping systems visualised at core (40μm resolution; a, c, e, g) and aggregate (1.5μm resolution; b, d, f, h) scales, displayed as thresholded images denoting pore (green) or solid (brown) phases. (a, b) bare fallow; (c. d) inorganically fertiliser arable; (e, f) manured arable (g, h) grassland. (For interpretation of the references to colour in thisfigure legend, the reader is referred to the web version of this article.)
(Rabot et al., 2018) including metabolism. Our data revealed sub-stantial effects of agricultural practice upon both pore architecture and function from these perspectives.
4.1. Effect of management on clay soil
[image:8.595.36.289.107.176.2]The presence of plants increased the soil porosity, as also shown by Helliwell et al. (2017)albeit in the rhizosphere soil images acquired at 12μm resolution. Where present, perennial vegetation increased soil porosity at both core and aggregate scales to a greater extent than ei-ther annual plants interspersed by tilling or bare fallow. Grassland soils had not been ploughed for at least 150 years and the sampled soil contained a very low number of stones (Fig. 1c, Table A1). The greater proportion of larger pores is most likely to have been induced by the diversity of plant roots and their inputs and the presence of associated soil biota (Pires et al., 2017). The decreased occurrence of stones in the surface 10 cm of grassland soil is likely to be due in part to bioturbation, specifically via the surface-deposition of soil by anecic earthworms, which are known to effectively bury objects to lower soil horizons over time (Table A1;Canti, 2003;Hanson et al., 2009). Regular tillage of the
Table 5
Total porosity in relation to management type at the core (base resolution 40μm) and aggregate (base resolution 1.5μm) scale of the sandy soil, expressed as percentage of pores relative to the total volume (mean ± pooled standard error).
Treatment n Core Aggregate Fallow 4 21.1 ( ± 0.98) 23.7 ( ± 0.68) Inorganically fertilised arable 5 19.6 ( ± 0.87) 24.4 ( ± 0.61) Manured arable 4 14.6 ( ± 0.98) 24.8 ( ± 0.68) Grassland 4 13.3 ( ± 0.98) 25.4 ( ± 0.68)
PF 0.002 < 0.001
[image:8.595.98.502.240.720.2]fallow and arable soils would however retain stones in the plough layer. The pore size distributions were expressed in two ways: normalised to the total ROI volume (Fig. A2) and normalised to the total pore volume (Fig. 2a, b), each highlights different information regarding the pore structure. Normalising to the total ROI volume expressed the ab-solute proportion of the different pore sizes, whereas normalising to the pore volume shows the relative proportion of each pore sizes to the total porosity. At the core scale, both normalisations showed the same trend: a smaller proportion of pore sizes < 0.25 mm for the arable compared to grassland and fallow and greater proportion of pores > 1.12 mm for grassland and arable treatment compared to the fallow treatment (Fig. 2a, A2a). However, at the aggregate scale, the absolute proportion of the pores < 25μm was greater for grassland and arable than fallow, while the relative abundance showed a greater proportion for arable and fallow compared to grassland. This difference between absolute and relative abundances might be due to the fact that the porosity observed in the grassland was twofold greater than fallow, so the relative proportion accounted for the difference in porosity. At both scales, grassland soil showed a greater range of pore sizes compared to arable or fallow (Fig. 2a, b; Fig. A2) which could be emphasised by a greater presence of organic carbon, fungi and a greater abundance of bacteria in grassland treatment as shown byHirsch et al. (2009)in a previous study working on the same site. Under the arable and fallow treatments, the frequency of stones was greater than the grassland system (Table A1). The presence of stones could be accounted for as a result of the regular ploughing of the soil over the past 60 years which brought them to the soil surface (Rossi et al., 2013). Recent data from another long-term experiment has shown that no-till arable soils have a significantly lower percent of macro-pores than soils subjected to tilling with a chisel plough (Ambert-Sanchez et al., 2016), which corroborates our observation of the high proportion of large pores under the arable
at the core scale. The arable treatments showed fewer larger pores at the aggregate scale which emphasizes that ploughing apparently in-troduced a greater macro-porosity at the core scale.
At the core scale, grassland systems had a greater surface density for the smallest pores (Fig. 2c), in this circumstance the pore-solid interface was expected to be more accessible to micro-organisms and roots, which would be beneficial for water and nutrient uptake. In contrast, the surface density of all visible pores at the core scale was lowest under arable management which could be due to the mechanical disturbance but also the presence of stones since the morphology of a stone has a smoother edge than a pore. Moreover, the decreased surface density in the arable and fallow treatments can be induced by the loss of the elongated pores due to the impact of the machinery (Pagliaia et al., 2003). At the aggregate scale, treatments involving plants had a greater surface density of all pores than bare fallow soil. However, the surface density values were very low. There were statistically significant dif-ferences in surface densities between treatments at the aggregate scale but that the magnitude of the effect was very small.
The volume of interest (VOI) was derived from the region of interest (ROI). VOI was used to model the water saturation of the volume and the ROI was used to calculate the pore characteristics using QuantIm. At the core scale, basic pore characteristics were significantly linearly correlated but absolute values were different. These disparities are likely due to the heterogeneous distribution of the pores within ROI, but given the correlation, it is admissible for comparative purposes to study treatment effects. At the aggregate scale, VOI porosity was congruent with ROI porosity (data not shown).
At both scales, across all clay treatments, permeability generally increased with porosity (Table 3). At the core scale this followed a positive power-law relationship with the exponent varying significantly between treatments (Table 4; Fig. A3a). The increase in permeability, with respect to porosity, increased significantly ranking from fallow < arable < grassland, i.e. there is a substantive effect of the extent of plant presence upon this relationship and the intrinsic ability of the soils to conduct water.
At the aggregate scale, the permeability of the fallow and arable treatments was not significantly different despite the difference in porosity (Table 3). However, under both these treatments, the pore size distribution normalised to the total pore volume was similar for the smaller pores (< 9.26μm) and in greater proportion than grassland (Fig. 2b). Here, the increased proportion of smaller pores appears to reduce permeability. Surprisingly, the differences in grassland and arable treatment permeability (Table 3) were not matched by diff er-ences in pore connectivity (Fig. 2e) This suggests that pore size dis-tribution and porosity are better pore characteristic descriptors in our study, which is consistent with observation ofBlackwell et al. (1990). This observation complements other studies showing that permeability is dependent upon macro-porosity (Cercioglu et al., 2018) and pore-connectivity at the macroscale (Ball, 1981).
4.2. Effect of management on sandy soil
For sandy soil, there was similarity between pore structures derived from grassland (i.e. perennial plants) and manured arable (i.e. annual plants with organic inputs); and between the fallow and inorganically fertilised arable (i.e. annual plants with inorganic inputs;Fig. 4a). This observation is supported by another experiment studying C sequestra-tion over 70 years. In this particular soil, addisequestra-tion of organic manure (38 t ha−1 every fifth year) was as efficient at C sequestration as growing 3 years' grass and clover in a 5-year arable rotation (Johnston et al., 2017). At the core scale, the systems involving perennial and annual plants with organic inputs (manure) reduced porosity, surface density and connectivity (Table 5,Fig. 4c, e) but increased the diversity of pore sizes relative to the absence of plants and annual plants with inorganic inputs (Fig. 4a, c). This reduction in porosity was also ob-served, in the rhizosphere soil, for the growth of tomato plant root
Table 6
Total porosity in relation to management type (expressed as percentage of pores relative to the total volume), and modelled saturated permeability, of the vo-lume of interest used for modelling, for the sandy soil at the core and aggregate scale (mean ± pooled standard error).
Treatment n Core Aggregate Porosity
(%)
Permeability (mm2)
Porosity (%)
Permeability (mm2)
Fallow 4 20.9 ( ± 1.55)
266 ( ± 59.0) 25.0 ( ± 1.71)
2.44 ( ± 0.45) Inorganically
fertilised arable
5 21.2 ( ± 1.38)
406 ( ± 52.8) 26.0 ( ± 1.71)
2.84 ( ± 0.40)
Manured arable 4 16.4 ( ± 1.55)
501 ( ± 59.0) 24.3 ( ± 1.52)
1.88 ( ± 0.45) Grassland 4 17.0
( ± 1.55)
464 ( ± 59.0) 24.6 ( ± 1.71)
1.72 ( ± 0.45)
PF 0.61 0.37 0.98 0.54
Table 7
Linear regression coefficients (mean ± standard error) in relation to manage-ment type of log porosity vs. log modelled saturated permeability for the sandy soil, at the core (Fig. A6a) and aggregate scale (Fig. A6b).
Treatment n Core Aggregate Coefficienta P
uncorr Coefficienta Puncorr
Fallow 12 0.58 ( ± 0.25) 0.04 2.69 ( ± 0.51) < 0.001 Inorganically fertilised
arable
15 0.37 ( ± 0.18) 0.06 2.08 ( ± 0.21) < 0.001 Manured arable 12 1.08 ( ± 0.25) 0.002 1.90 ( ± 0.20) < 0.001 Grassland 12 0.70 ( ± 0.22) 0.01 1.37 ( ± 0.13) < 0.001
PF 0.08 0.02
a Coefficient of x value infitted equation.
systems in sandy loam soil byHelliwell et al. (2017). Furthermore, the increase of the porosity in inorganically fertilised arable and fallow treatments could be due to the conventional tillage which is applied to loosen the soil particles (Arvidsson, 1998). The soil structural char-acteristics associated with manured arable were similar to the grassland treatment, which supports the notion that addition of organic C helps support arable soil structure. Organic inputs decreased the soil porosity and the connectivity, which could decrease permeability of water and nutrients. Both normalisations of pore size distributions showed the same trend: a greater proportion of pores < 0.25 mm under in-organically fertiliser arable and fallow treatments compared to grass-land and manured arable (Fig. 4a, A5a).
At the core scale, VOI porosity was linearly correlated with ROI porosity, but the absolute values were different (data not shown). These differences might be induced by the heterogeneous distribution of the pores within the ROI, however due to the correlation, these values were admissible for the comparison of the treatment effects (Table 7). There were no significant differences amongst treatments for the permeability (Table 7).
At the aggregate scale, the only relative difference was observed for the pore connectivity; however, the Euler numbers were less negative, suggesting the pore systems of all treatments were poorly connected (Fig. 4e). Sandy soil is predominantly composed of larger grains than clay soils. This implies that the aggregate scale may not be optimal to observe differences between treatments in the sandy soil. However, the long-term organic management had been proven to have a greater variability in intra-aggregate spatial pore structure for afine-loamy soil (Kravchenko et al., 2014). In this study, organic matter inputs increased the presence of both larger (> 188μm) and smaller (< 13μm) pores. The most relevant scale to characterise soil micro-structure is con-tingent upon the texture (Kravchenko et al., 2014;Peth et al., 2008). This was apparent in our study where management effects were de-tected at the aggregate scale only in the case of the clay soil.
4.3. Contrasting effect of management on both soils
The two soil textures exhibited striking differences in soil structure following application of various long-term managements. In both soils, the grassland (and manured arable for the sandy soil) appeared to
in-fluence the porosity at the resolutions considered here, increasing for clay soil and decreasing for the sandy soil. Perennial plant inputs and the addition of manure for the arable treatment appear to affect system porosity in their vicinity, contingent on soil texture. We propose that plants modify soil porosity in their vicinity, improving hydraulic function–for example water retention andflow. Indeed, for both soils, under grassland and manured arable there was a decrease in the pro-portion of smaller pores, which may lead to an increase in permeability. We found that at the core scale, pore connectivity of the clay soil was not significantly different (Fig.2e) and was significantly greater for the inorganically fertilised arable and the fallow treatments compared to manured arable and grassland treatments. Therefore, carbon inputs from perennial plants and addition of organic carbon apparently de-creased the connectivity of the pore system which may recover from disturbance associated with management. This supports the observa-tions ofGregory et al. (2009) who found a positive relationship be-tween organic matter content and the resilience of soils to withstand physical compression. However, at the aggregate scale, the clay soil treatments were significantly different depending on management whereas the sandy aggregates were not significantly different in regard to pore structures between the different managements.
There was a positive power-law relationship between porosity and permeability in nearly all treatments, consistent with Luijendijk and Gleeson (2015); this suggests that soil structure is not random but structured through self-organization (Crawford, 1994). The type of cropping system did not significantly affect this relationship except at the core scale in clay soils and aggregate scale in the sandy soils. In both
cases, permeability was much greater relative to porosity under grass-land than in fallow, with arable intermediate regardless of increased organic status.
5. Conclusions
This study revealed profound but contrasting effects of different agricultural management systems, and in particular the role of plants, on soil structure over the long-term and in the context of two soil textures. For both soil textures, perennial and annual plants (associated with organic input for the sandy soil) increased the diversity of pore sizes. In contrast, the effect of plants on porosity and pore connectivity was markedly different between the two soil textures: for clay soil, plants increased the porosity and the connectivity of the pore system, whereas for sandy soil, plants decreased the porosity and the pore connectivity. Hence the hypothesis that the presence of plants increases porosity requires qualification since plants contributed to soil porosity only in the presence of clay: for sandy soil, the presence of plants re-duced porosity and connectivity. Our results confirmed the hypothesis that perennial plants invoked greater structural heterogeneity, manifest as a wider range of pore sizes. This study also showed that addition of manure to arable soil had essentially the same effect as continual per-ennial plants on the maintenance of the soil structure. Incorporation of organic matter (such as root, organic carbon) can be considered as an agent which assists soil structure to reorganise from the tillage by in-creasing the diversity of the pore sizes and dein-creasing porosity. Different crop/management systems create different kinds of soil structure, and for each there are a range of consequences depending on the function under consideration.
These data suggest that management systems generate soil structure differently, conferring to soil structure a variety of functions. The contrasting effects of increased plant presence in the two textures bear an intriguing relationship to what may be considered an optimal
con-figuration of pore architecture in the different circumstances. In the context of a cohesive soil, here clay, plant inputs induced greater por-osity, pore-connectivity and permeability, arguably advantageous to plants and the soil biome since it increases water availability via diffuse
flow paths. For less cohesive soil, here represented by sand, the pre-sence of plants decreased porosity and connectivity, which likewise is beneficial to the plant and soil biota by increasing the propensity for water storage. The inherent cohesion of the soil may alter a plant's response to its environment in terms of optimising water storage and
flow at a system level.
Acknowledgements
We thankPr. Hu Zhou for his assistance with the software QuantIm. This work was performed at the University of Nottingham Hounsfield facility. The University of Nottingham Hounsfield Facility receives funding from BBSRC (Swindon, UK), and The Wolfson Foundation (London, UK). Work at Rothamsted is supported by the BBSRC-funded Soil to Nutrition strategic programme (BBS/E/C/000I0310) and jointly by the Natural Environment Research Council and BBSRC as part of the Achieving Sustainable Agricultural Systems research programme (NE/ N018125/1 LTS-M). Access to the Highfield and Woburn Ley-Arable experiments is supported by the UK's Long-Term Experiment National Capability funded by the Biotechnology and Biological Sciences Research Council Grant [grant number BBS/E/C/000J0300)]. We also thank Dr. Steffen Schlüter and an anonymous reviewer for their in-sightful suggestions for improvement of this paper.
Appendix A. Supplementary data
References
Ambert-Sanchez, M., Mickelson, S.K., Ahmed, S.I., Gray, J.N., Webber, D.F., 2016. Evaluating soil tillage practices using X-ray computed tomography and conventional laboratory methods. Trans. ASABE 59, 455–463.https://doi.org/10.13031/trans.59. 11308.
Arvidsson, J., 1998. Effects of Cultivation Depth in Reduced Tillage on Soil Physical Properties, Crop Yield and Plant Pathogens. vol. 9. pp. 79–85.
Ball, B.C., 1981. Pore characteristics of soils from two cultivation experiments. J. Soil 32, 483–498.
Blackwell, P.S., Ringrose-Voase, A.J., Jayawardane, N.S., Olsson, K.A., McKenzie, D.C., Mason, W.K., 1990. The use of air-filled porosity and intrinsic permeability to characterise macropore structure and saturated hydraulic conductivity of clay soils. J. Soil Sci. 41, 215–228.
Canti, M.G., 2003. Earthworm activity and archaeological stratigraphy: a review of products and processes. J. Archaeol. Sci. 30, 135–148.https://doi.org/10.1006/jasc. 2001.0770.
Cercioglu, M., Anderson, S.H., Udawatta, R.P., Haruna, S.I., 2018. Effects of cover crop and biofuel crop management on computed tomography-measured pore parameters. Geoderma 319, 80–88.https://doi.org/10.1016/j.geoderma.2018.01.005. Chenu, C., 1993. Clay- or sand-polysaccharide associations as models for the interface
between micro-organisms and soil: water related properties and microstructure. Geoderma 56, 143–156.https://doi.org/10.1016/0016-7061(93)90106-U. Chenu, C., Cosentino, D., 2011. Microbial regulation of soil structural dynamics. In: Ritz,
K., Young, I. (Eds.), The Architecture and Biology of Soils: Life in Inner Space. CABI, Wallingford, Oxfordshire OX10 8DE, UK, pp. 37–70.
Coleman, K., Jenkinson, D.S., Croker, G.J., Grace, P.R., Klír, J., Körschens, M., Poulton, P.R., Richter, D.D., 1997. Simulating trends in soil organic carbon in long-term ex-periments using RothC-26.3. Geoderma 81, 29–44.
Crawford, J.W., 1994. The relationship between structure and the hydraulic conductivity of soil. Eur. J. Soil Sci. 45, 493–502.
Crawford, J.W., Deacon, L., Grinev, D., Harris, J.A., Ritz, K., Singh, B.K., Young, I., 2012. Microbial diversity affects self-organization of the soil-microbe system with con-sequences for function. J. R. Soc. Interface 9, 1302–1310.https://doi.org/10.1098/ rsif.2011.0679.
Dorioz, J.M., Robert, M., Chenu, C., 1993. The role of roots, fungi and bacteria on clay particle organization. An experimental approach. Geoderma 56, 179–194.https:// doi.org/10.1016/0016-7061(93)90109-X.
Feeney, D.S., Crawford, J.W., Daniell, T., Hallett, P.D., Nunan, N., Ritz, K., Rivers, M., Young, I.M., 2006. Three-dimensional microorganization of the soil-root-microbe system. Microb. Ecol. 52, 151–158.https://doi.org/10.1007/s00248-006-9062-8. Gregory, A.S., Watts, C.W., Griffiths, B.S., Hallett, P.D., Kuan, H.L., Whitmore, A.P., 2009.
The effect of long-term soil management on the physical and biological resilience of a range of arable and grassland soils in England. Geoderma 153, 172–185.https://doi. org/10.1016/j.geoderma.2009.08.002.
Gregory, A.S., Dungait, J.A.J., Watts, C.W., Bol, R., Dixon, E.R., White, R.P., Whitmore, A.P., 2016. Long-term management changes topsoil and subsoil organic carbon and nitrogen dynamics in a temperate agricultural system. Eur. J. Soil Sci. 67, 421–430. https://doi.org/10.1111/ejss.12359.
Hanson, I., Djohari, J., Orr, J., Furphy, P., Hodgson, C., Cox, G., Boradbridge, G., 2009. New observations on the interactions between evidence and the upper horizons of the soil. In: Ritz, K., Dawson, L., Miller, D. (Eds.), Criminal and Environmental Soil Forensic, pp. 239–251.
Helliwell, J.R., Miller, A.J., Whalley, W.R., Mooney, S.J., Sturrock, C.J., 2014. Quantifying the impact of microbes on soil structural development and behaviour in wet soils. Soil Biol. Biochem. 74, 138–147.https://doi.org/10.1016/j.soilbio.2014. 03.009.
Helliwell, J.R., Sturrock, C.J., Mairhofer, S., Craigon, J., Ashton, R.W., Miller, A.J., Whalley, W.R., Mooney, S.J., 2017. The emergent rhizosphere: imaging the devel-opment of the porous architecture at the root-soil interface. Sci. Rep. 7 (14875). https://doi.org/10.1038/s41598-017-14904-w.
Hirsch, P.R., Gilliam, L.M., Sohi, S.P., Williams, J.K., Clark, I.M., Murray, P.J., 2009. Starving the soil of plant inputs for 50 years reduces abundance but not diversity of soil bacterial communities. Soil Biol. Biochem. 41, 2021–2024.https://doi.org/10. 1016/j.soilbio.20.
Hodge, C.A.H., Burton, R.G.O., Corbett, W.M., Evans, R., Seale, R.S., 1984. Soils and Their Use in Eastern England. Bull. 13. Soil Surv. Engl, Wales, Harpenden, United Kingdom. Johnston, A.E., Poulton, P.R., Coleman, K., Macdonald, A.J., White, R.P., 2017. Changes in soil organic matter over 70 years in continuous arable and ley-arable rotations on a sandy loam soil in England. Eur. J. Soil Sci. 68, 305–316.https://doi.org/10.1111/ ejss.12415.
Kravchenko, A.N., Negassa, W.C., Guber, A.K., Hildebrandt, B., Marsh, T.L., Rivers, M.L., 2014. Intra-aggregate pore structure influences phylogenetic composition of bacterial community in macroaggregates. Soil Sci. Soc. Am. J. 78, 1924.https://doi.org/10. 2136/sssaj2014.07.0308.
Luijendijk, E., Gleeson, T., 2015. How well can we predict permeability in sedimentary basins? Deriving and evaluating porosity-permeability equations for noncemented sand and clay mixtures. Geofluids 15, 67–83.https://doi.org/10.1111/gfl.12115. Naveed, M., Moldrup, P., Schaap, M.G., Tuller, M., Kulkarni, R., Vogel, H.J., De Jonge,
L.W., 2016. Prediction of biopore- and matrix-dominatedflow from X-ray CT-derived macropore network characteristics. Hydrol. Earth Syst. Sci. 20, 4017–4030.https:// doi.org/10.5194/hess-20-4017-2016.
Neal, A.L., Rossman, M., Brearley, C., Akkari, E., Guyomar, C., Clark, I.M., Hirsch, P.R., 2017. Land-use influences phosphatase gene microdiversity in soils. Environ. Microbiol. 19, 2740–2753.
Oades, J.M., 1993. The role of biology in the formation, stabilization and degradation of soil structure. Geoderma 56, 377–400.https://doi.org/10.1016/0016-7061(93) 90123-3.
Pagliaia, M., Marsilib, A., Servadiob, P., Vignozzi, N., Pellegrini, S., 2003. Changes of some physical properties of a clay soil following the passage of rubber tracked and wheeled tractors of medium power. Soil Tillage Res. 73, 119–129.
Peth, S., Horn, R., Beckmann, F., Donath, T., Fischer, J., Smucker, A.J.M., 2008. Three-dimensional quantification of intra-aggregate pore-space features using synchrotron-radiation-based microtomography. Soil Sci. Soc. Am. J. 72, 897.https://doi.org/10. 2136/sssaj2007.0130.
Pires, L.F., Borges, J.A.R., Rosa, J.A., Cooper, M., Heck, R.J., Passoni, S., Roque, W.L., 2017. Soil structure changes induced by tillage systems. Soil Tillage Res. 165, 66–79. https://doi.org/10.1016/j.still.2016.07.010.
Rabot, E., Wiesmeier, M., Schlüter, S., Vogel, H.J., 2018. Soil structure as an indicator of soil functions: a review. Geoderma 314, 122–137.https://doi.org/10.1016/j. geoderma.2017.11.009.
Rossi, R., Amato, M., Pollice, A., Bitella, G., Gomes, J.J., Bochicchio, R., Baronti, S., 2013. Electrical resistivity tomography to detect the effects of tillage in a soil with a vari-able rock fragment content. Eur. J. Soil Sci. 64, 239–248.https://doi.org/10.1111/ ejss.12024.
Schneider, C.A., Rasband, W.S., Eliceiri, K.W., 2012. NIH image to ImageJ: 25 years of image analysis. Nat. Methods 9, 671–675.
Tisdall, J.M., Oades, J.M., 1982. Organic matter and water-stable aggregates in soils. J. Soil Sci. 33, 141–165.
Vogel, H.J., Kretzschmar, A., 1996. Topological characterization of pore space in soil -sample preparation and digital image-processing. Geoderma 73, 23–38.https://doi. org/10.1016/0016-7061(96)00043-2.
Vogel, H.J., Weller, U., Schlüter, S., 2010. Quantification of soil structure based on Minkowski functions. Comput. Geosci. 36, 1236–1245.https://doi.org/10.1016/j. cageo.2010.03.007.
Watts, C.W., Whalley, W.R., Longstaff, D., White, R.P., Brooke, P.C., Whitmore, a P., 2001. Aggregation of a soil with different cropping histories following the addition of organic materials. Soil Use Manag. 17, 263–268.https://doi.org/10.1079/ Sum200189.
Zhang, X., Lv, M., 2007. Persistence of anomalous dispersion in uniform porous media demonstrated by pore-scale simulations. Water Resour. Res. 43, 1–11.https://doi. org/10.1029/2006WR005557.
Zhang, X., Crawford, J.W., Deeks, L.K., Stutter, M.I., Bengough, A.G., Young, I.M., 2005. A mass balance based numerical method for the fractional advection-dispersion equation: theory and application. Water Resour. Res. 41https://doi.org/10.1029/ 2004wr003818.(n/a-n/a).
Zhang, X., Crawford, J.W., Flavel, R.J., Young, I.M., 2016. A multi-scale Lattice Boltzmann model for simulating solute transport in 3D X-ray micro-tomography images of aggregated porous materials. J. Hydrol. 541, 1020–1029.https://doi.org/ 10.1016/j.jhydrol.2016.08.013.