Munich Personal RePEc Archive
Inequality, Trade and Development:
Evidence from Developing Countries
Majeed, Dr. Muhammad Tariq
Quaid-i-Azam University, Islamabad, Pakistan, University of
Glasgow, UK
2 October 2013
1
Inequality, Trade and Development: Evidence from Developing Countries
Dr. M Tariq Majeed*
Abstract
This study analyzes the impact of trade on cross-country inequality using a panel data set from 65 developing counties over a long period 1970-2008. This study differs from the existing literature on distributional impact of trade by explicitly noting the importance of development stage in shaping the link. The analysis shows that the effect of trade on inequality depends upon the level of development of a trade integrating economy. Economies that have a high level of economic development acquire a favourable effect of trade while underdeveloped economies suffer from international economic integration. In sum, trade accentuates not ameliorate inequality in countries with low level of economic development.
JEL Classification: C23, D31 and F41
Key Words: Trade; Development; Inequality; Developing Countries
1. Introduction
This paper studies the relationship between trade and inequality. Inequality has increased
substantially all over the world during the last three decades of the twenty first century. The
inequality is increasing both within and between countries. Similarly, in recent decades,
globalization has also increased substantially- whether measured in trade flows, FDI, capital
flows, or offshoring- in both developed and developing countries.
These parallel developments have led to a natural conjecture that increasing inequality is a result
of increasing trade and therefore now increasing globalization is considered one of the reasons
for the increasing trend of inequality because. Until the 1990s, the main theoretical framework
to explain the relationship between trade and inequality was the Hecksher-Ohlin (HO) model. In
its simplest form, the HO model predicts that abundant factors have more return in an open
*
The author is Assistant Professor of Economics in Quaid-i-Azam University, Islamabad, Pakistan. Tel: +92 (0)51-90643020; Email: [email protected]
2
economy, it means in developed countries it is skilled labour which will benefit more from trade
and in developing countries it is unskilled labour which will benefit more from trade.
A number of studies published between 1990 and 2010 have shown that inequality has increased
in developing countries as a result of trade reforms (see Berman et. al., 1994; Autor et. al., 1998;
Harrison and Hanson (1999) and others). Such a positive impact of increasing trade on inequality
has undermined the simple theoretical predictions of the HO model. In other words, increasing
inequality with increasing globalization was at odds with simple predictions of the HO model.
Another problem with the HO model was that it was unable to explain increasing demand for
skilled labour with-in industry.
These findings led researchers to explore for other causes of increasing inequality. One main
explanation is skilled-biased technology, which implies that changes in technology are biased
towards skilled workers. Some other explanations are the weakening of labour unions, unequal
access to schooling, and immigration. Overall, most economists were sceptical of assigning
central importance to trade as a main cause of increasing inequality.
The literature was at odds with respect to existing trade theories. This led to new theories, which
focus on heterogeneous firms, labour market frictions and incomplete contracts. These new
theories provide insights into the effects of trade on income inequality. There are number of
ways through which trade contributes to inequality. However, this paper mainly focuses the role
of development through which trade contributes to inequality.
In the literature, the role of trade in explaining inequality is mainly generalized for all developing
countries. However, developing countries at different level of economic development have
different prerequisites to take the advantage of trade. The countries at lower levels of economic
development have weak trade unions, labour market frictions, unequal access to schooling
among others.
This study focuses trade as main cause of inequality, however the study differentiate between
3
inequality can vary depending upon the level of economic development for following reasons.
First, countries at lower level of economic development lack domestic conditions, which help
poor to take the advantage of trade. Second, parallel markets such as labour and financial market
are comparatively underdeveloped in these countries. The better domestic markets help poor to
take the advantage of increasing trade.
Since independent affect of trade is not helpful to explain the increasing trend of cross-country
inequality, this study focuses the importance of economic development in shaping the link
between trade and inequality. In other words, this study attempts to investigate whether the
inequality impact of trade depends on the level of economic development.
This study attempts to answer the following questions: First, what it the impact of trade on
inequality in developing countries? Second, does the inequality impact of trade vary depending
upon different levels of development in developing countries?
Rest of the discussion is structured as follows: Section 2 provides a review of the related
literature and theory on the predictors of inequality. Section 3 presents an analytical frame work
for the study and section 4 provides a discussion on data and estimation procedure. Section 5
puts forward results derived from the research questions and a discussion on these results.
4
2. Literature Review
The framework of Heckscher-Ohlin (HO) model, in its simplest form, predicts that a nation
specializes in a product, which requires an intensive use of its abundant factors of production.
Since developing countries are abundant with low-skilled labour, they specialize in labour
intensive products. The demand and wages for low-skilled labour tend to increase during the
process of products specialization based on labour intensive production techniques. Thus,
increasing wages help to narrow down the existing inequality gaps.
Nevertheless, predicted lower inequality by the HO model depends on the assumption of similar
technologies across countries. If this assumption is dropped then distributional effects of trade
also depends on technology diffusion from developed nations to developing nations that
generates a skill premium. In contrast to the prediction of the HO model, in this situation the
demand and wages for high skilled labour tend to increase. Consequently, wage gaps tend to
widen in an open economy (see, for example, Berman et. al., 1994; Autor et. al., 1998).
Robbins (2003) defines technological up grading as ―skill enhancing trade hypotheses‖. In the literature, many other studies note the skill-enhancing role of trade through upgrading of
technologies in the developing world. For example, Barba et. al., (2002) note that increasing
imports allow a developing economy to upgrade its technology through the imports of mature
and second hand capital goods. Acemoglu (2003) also argues that trade openness leads to
technical upgrading by allowing a rise in the international flows of capital goods. When south
rapidly adopted the modern skill intensive technologies, demand and wages of skilled labour
increased that, in turn, increased inequalities in developing countries.
Technological upgrading in developing countries not only helps to having better access in the
markets of developed counties but also saves the sunk costs of technological innovations. A
study by Perkins and Neumayer (2005) points out that a lagged developing country directly
5
In an open economy, to have a better access in the markets of developed countries, exports also
create incentives for replacement of outdated technologies. Yeaple (2005) shows that exports
based on updated technologies yield high profits.
In a case study of Mexico, Hanson and Harrison (1999) observe that firms demand more white
collar workers in exporting sectors as compared to non-exporting sectors of production.
Therefore, increasing exports widen inequalities. Moreover, Berman and Machine (2004)
confirm this positive association between exports and inequality for developing countries. These
studies build a positive link between exports and inequality but do not link trade to development.
This study fills the gap by developing a link between trade, development and inequality for
developing countries.
In a recent study, Majeed (2010b) finds out that trade accentuates, not ameliorates, and that it
intensifies, not diminishes, inequality in the case of Pakistan.
2.1: Theory of Inequality Determinants
Having discussed the relationship of trade with inequality, this section provides explanation of
some other important causes of inequality.
The most important factor, which explains cross-country variation in inequality, is economic
development. Kuznets (1955) predicts a non-linear relationship between inequality and economic
development. Inequalities tend to increase at lower levels of economic development but fall at
higher levels of economic development due to trickle down effects. Ahluwalia (1976) and
Majeed (2010b) support the Kuznets‘s point of view.
The impact of financial development on income inequality is not yet conclusive in the
literatures.1 There are two arguments in the literature: First, a developed finical system helps in
reducing inequalities through providing loans to poor. Second, the impact of financial
development on inequality is non-linear because initially financial development favors rich,
1
6
thereby increasing inequalities. However, over time at higher levels of financial development
poor also benefit when more people have access to financial system.
The effect of inflation on inequality is uncertain. It can increase inequalities through its effect on
individual income and can reduce inequalities in the presence of progressive tax system. The
inequality widening effect of inflation is more pronounced when wages fail to chase increasing
price levels. In developing countries, trade unions are weak and minimum wage laws are
dysfunctional in the presence of weak institutions. Thus, workers are left with less or no rise in
wages, while owners of the firms enjoy benefits of rising prices and get further rich (MacDonald
and Majeed, 2010).
The role of government in affecting income inequality is critical. The literature is not showing
consensus on the relationship between government spending and inequality. Government
spending might helps in ameliorating inequality, if government revenues collected through taxes
and transfer systems are redistributed in favor of poor. Papanek and Kyn (1986) test the impact
of government intervention on inequality and results of their study do not support the contention
that government spending reduces inequality. They argue that government intervention often
benefits the elite such as the political, bureaucratic and military leadership rather than poor2.
However, some cross-country studies (see, for example, MacDonald), find the inequality
reducing effect of government spending.
It is widely believed that higher population growth is associated with higher income inequality.
One of the reasons is that dependency burden may be higher for poor group. Deaton and Paxon
(1997) argue that population growth increases the size of families in the poor stratum, thereby
increasing dependency burden and inequality. Investment in human capital can be expected to
reduce income gaps as higher education improves skills, productivity and labour income.
2
7
3. Methodology
In this section, this study introduces a methodological framework for inequality. Following
conventional wisdom of the literature on inequality, initially Kuznets curve has been modelled
followed by trade, which is the prime motive of this study, and some key variables.
) ...( ... ...
... ...
... ...
log log
logGiniit it 1 Yit 2 Y2it it I
) ,... 1
; ,... 1
(i N t T
Log Giniit = it refers to the natural logarithm of the Gini Index.
Log Yit = it refers to the natural logarithm of income per capita, adjusted with PPP.
Log Y2it= square term controls nonlinear conditional convergence across the countries.
εit = it is a disturbance term
Equation (I) is conventionally used to test for the Kuznets hypotheses. The expected signs for γ1 and γ2 are positive and negative respectively.
Equation II includes trade which is main focus of this study.
) ....( ... ... ... ... ... ... ]
/ [
log log
logGiniit
it
1 Yit
2 Y2it
3 Tradeit Y
it IIAccording to Stolper-Samuelson theorem the expected sign for γ3 depends on the comparative
advantage of an economy relative to its trading partners.
) ...( ]
/ *
[ ] / [
log log
logGiniit
it
1 Yit
2 Y2it
3 Tradeit Y
4 Tradeit Developmnetit Y
it IIIEquation III introduces an interactive term for trade and development to asses whether the affect
of trade varies depending upon the level of development.
Cross-country inequality variation depends on other factors such as government size, education
8
that rent seeking activities are avoided and government spending enhances the possibilities and
opportunities for the poor. A rise in human capital can be expected to narrow down the gap
between poor and rich as people with high investment in human capital have less chances to fall
in poverty trap. Equation (III) can be rewritten as
) ..( log
log ] / *
[ ] / [ log
log
log 2 3 4 5 6 7
2
1 Y Y Trade Y Trade Developmnet Y G HK Pop IV
Giniit it it it it it it it it it it
Git = It is natural log of government spending as proxy for government spending on social setor
HKit =It is measured as secondary school enrolment rate.
ΔPopit=It is percentage change in total population.
εit = it is a disturbance term
4. Data and Estimation Procedure
The income inequality data may not be comparable across countries due to differences in
definitions and methodologies. I use Gini coefficient to measure income inequality, which is one
of the most popular representations of income inequality. It is based on Lorenz Curve, which
plots the share of population against the share of income received and has a minimum value of 0
(case of perfect equality) and maximum value of 1 (perfect inequality).
To make the data more comparable, this study takes data on variables in the form of averages
between two survey years. Per capita real GDP growth rates are annual averages between two
survey years. A panel data for 65 developing countries for the period 1970-2008 has been
assembled with the data averaged over periods of three to seven years, depending on the
availability of inequality data. The minimum number of observations for each country is three
and the maximum, nine.
5. Results
Estimation procedure for this study has been proceeded as follows: First, parameter estimates
9
replicated using alternative econometric techniques to address the possible presence of
endogeneity problem and to assess the robustness of results. Third, interactive effect of
[image:10.612.68.526.172.557.2]inequality and trade investigated.
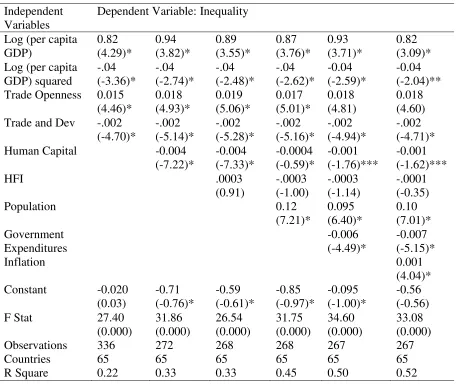
Table1: Inequality, Trade and Development in all Developing Countries
Independent Variables
Dependent Variable: Inequality
Log (per capita GDP) 0.82 (4.29)* 0.94 (3.82)* 0.89 (3.55)* 0.87 (3.76)* 0.93 (3.71)* 0.82 (3.09)* Log (per capita
GDP) squared -.04 (-3.36)* -.04 (-2.74)* -.04 (-2.48)* -.04 (-2.62)* -0.04 (-2.59)* -0.04 (-2.04)** Trade Openness 0.015
(4.46)* 0.018 (4.93)* 0.019 (5.06)* 0.017 (5.01)* 0.018 (4.81) 0.018 (4.60) Trade and Dev -.002
(-4.70)* -.002 (-5.14)* -.002 (-5.28)* -.002 (-5.16)* -.002 (-4.94)* -.002 (-4.71)* Human Capital -0.004
(-7.22)* -0.004 (-7.33)* -0.0004 (-0.59)* -0.001 (-1.76)*** -0.001 (-1.62)***
HFI .0003
(0.91) -.0003 (-1.00) -.0003 (-1.14) -.0001 (-0.35)
Population 0.12
(7.21)* 0.095 (6.40)* 0.10 (7.01)* Government Expenditures -0.006 (-4.49)* -0.007 (-5.15)*
Inflation 0.001
(4.04)* Constant -0.020
(0.03) -0.71 (-0.76)* -0.59 (-0.61)* -0.85 (-0.97)* -0.095 (-1.00)* -0.56 (-0.56) F Stat 27.40
(0.000) 31.86 (0.000) 26.54 (0.000) 31.75 (0.000) 34.60 (0.000) 33.08 (0.000) Observations 336 272 268 268 267 267
Countries 65 65 65 65 65 65
R Square 0.22 0.33 0.33 0.45 0.50 0.52
Table 1 reports results for inequality effect of trade in all selected developing countries. The
parameter estimate on trade is significant with positive sign implying that trade exerts adverse
influence on inequality in developing countries. This finding is consistent with the perditions of
theoretical models of technological diffusion and skill premium. However, this positive influence
disappears when interactive effect of trade and development is estimated. The combined effect of
trade and development is negative and significant implying that trade helps to reduce inequalities
10
government spending help to decrease inequalities while population growth and inflation tend to
[image:11.612.71.522.149.635.2]worsen inequalities.
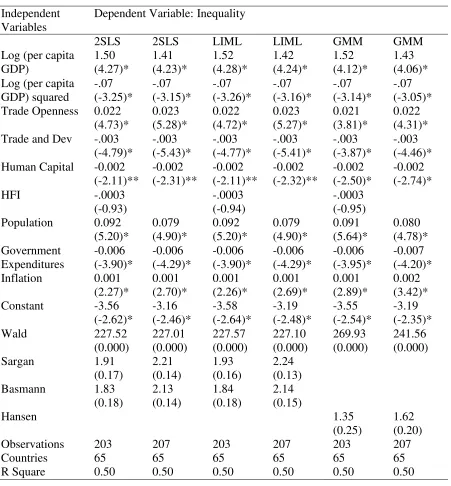
Table2: Inequality all developing Countries with Alternative Econometrics Techniques
Independent Variables
Dependent Variable: Inequality
2SLS 2SLS LIML LIML GMM GMM Log (per capita
GDP) 1.50 (4.27)* 1.41 (4.23)* 1.52 (4.28)* 1.42 (4.24)* 1.52 (4.12)* 1.43 (4.06)* Log (per capita
GDP) squared -.07 (-3.25)* -.07 (-3.15)* -.07 (-3.26)* -.07 (-3.16)* -.07 (-3.14)* -.07 (-3.05)* Trade Openness 0.022
(4.73)* 0.023 (5.28)* 0.022 (4.72)* 0.023 (5.27)* 0.021 (3.81)* 0.022 (4.31)* Trade and Dev -.003
(-4.79)* -.003 (-5.43)* -.003 (-4.77)* -.003 (-5.41)* -.003 (-3.87)* -.003 (-4.46)* Human Capital -0.002
(-2.11)** -0.002 (-2.31)** -0.002 (-2.11)** -0.002 (-2.32)** -0.002 (-2.50)* -0.002 (-2.74)*
HFI -.0003
(-0.93)
-.0003 (-0.94)
-.0003 (-0.95) Population 0.092
(5.20)* 0.079 (4.90)* 0.092 (5.20)* 0.079 (4.90)* 0.091 (5.64)* 0.080 (4.78)* Government Expenditures -0.006 (-3.90)* -0.006 (-4.29)* -0.006 (-3.90)* -0.006 (-4.29)* -0.006 (-3.95)* -0.007 (-4.20)* Inflation 0.001
(2.27)* 0.001 (2.70)* 0.001 (2.26)* 0.001 (2.69)* 0.001 (2.89)* 0.002 (3.42)* Constant -3.56
(-2.62)* -3.16 (-2.46)* -3.58 (-2.64)* -3.19 (-2.48)* -3.55 (-2.54)* -3.19 (-2.35)* Wald 227.52
(0.000) 227.01 (0.000) 227.57 (0.000) 227.10 (0.000) 269.93 (0.000) 241.56 (0.000) Sargan 1.91
(0.17) 2.21 (0.14) 1.93 (0.16) 2.24 (0.13) Basmann 1.83
(0.18) 2.13 (0.14) 1.84 (0.18) 2.14 (0.15)
Hansen 1.35
(0.25)
1.62 (0.20) Observations 203 207 203 207 203 207
Countries 65 65 65 65 65 65
R Square 0.50 0.50 0.50 0.50 0.50 0.50
Table 2 replicates the benchmark findings using alternative econometrics techniques. The
coefficient on trade enters with positive sign in all columns (2-7) implying that independent
11
economic development turns out to be favourable for trade integrating economies. The inequality
effect of trade varies depending upon the existing level of economic development. Thus, trade
exerts adverse influence on inequality in countries where development levels are lower while it
exerts favourable effects in economies, which are relatively developed. Therefore, our
benchmark findings are robust to alternative econometrics techniques.
Table 3 replicates the benchmark findings using regional dummy variables. Although trade
causes adverse effect on income inequalities, it is possible that this effect is not consistent across
regions. Similarly, combined effect of trade and development may not be consistent across
regions. In order to assess the robustness of results to the regional effects seven regional
dummies are introduced that are East Asia and Pacific, Europe and Central Asia, Middle East
and North Africa, Latin America and Carbine, South Asia and Sub Saharan Africa. Our
12
Table3: Inequality all developing Countries: controlling for regions
Independent Variables
Dependent Variable: Inequality
2SLS 2SLS LIML LIML GMM GMM Log (per capita
GDP) 1.61 (5.32)* 1.45 (4.62)* 1.61 (5.33)* 1.48 (4.64)* 1.62 (6.39)* 1.43 (5.19)* Log (per capita
GDP) squared -.08 (-4.27)* -.08 (-4.14)* -.08 (-4.28)* -.08 (-4.15)* -.08 (-5.14)* -.08 (-4.65)* Trade Openness 0.02
(6.07)* 0.014 (3.51)* 0.02 (6.05)* 0.014 (3.50)* 0.02 (5.73)* 0.01 (3.32)* Trade and Dev -.003
(-6.04)* -.002 (-3.52)* -.003 (-6.02)* -.002 (-3.52)* -.003 (-5.78)* -.002 (-3.31)* Human Capital -0.001
(-0.83) -0.0001 (-0.17)* -0.001 (-0.84) -0.0001 (-0.17) -0.001 (-1.36) -0.0003 (-0.47) Population 0.04
(2.07)* 0.025 (1.51) 0.04 (2.07)* 0.025 (1.51) 0.03 (2.39)* 0.02 (1.41) Government Expenditure -0.003 (-2.39)* -0.003 (-2.21)* -0.003 (-2.39)* -0.003 (-2.22)* -0.004 (-2.75)* -0.004 (-2.75)* Inflation 0.001
(2.67)* 0.001 (1.80)*** 0.001 (2.66)* 0.001 (1.79)*** 0.001 (3.55)* 0.001 (2.55)* Constant -3.77
(-3.21)* -2.57 (-2.03)* -3.82 (-3.23)* -2.63 (-2.06)* -3.77 (-3.85)* -2.47 (-2.20)* East Asia &
Pacific -0.19 (-6.31)* -0.20 (-2.26)* -0.18 (-6.32)* -0.20 (-2.27)* -0.19 (-6.65)* -0.19 (-2.99)* Europe &
Central Asia -0.28 (-7.41)* -0.29 (-3.56)* -0.28 (-7.39)* -0.29 (-3.57)* -0.27 (-9.54)* -0.27 (-5.63)* Middle East &
North Africa -0.25 (-5.56)* -0.26 (-2.58)* -0.25 (-5.57)* -0.26 (-2.59)* -0.25 (-6.97)* -0.24 (-3.28)* Lat America &
Caribbean 0.04 (0.47) 0.04 (0.45) 0.06 (0.85) South Asia -0.23
(-2.58)* -0.23 (-2.34)* -0.21 (-2.82)* Sub-Saharan Africa -0.02 (-0.17) -0.02 (-0.16) -0.01 (-0.10) Wald 441.12
(0.000) 560.15 (0.000) 411.71 (0.000) 559.71 (0.000) 619.88 (0.000) 917.89 (0.000) Sargan 3.82
(0.15) 3.26 (0.20) 3.90 (0.14) 3.31 (0.19) Basmann 3.64
(0.16) 3.04 (0.22) 1.83 (0.16) 1.53 (0.22)
Hansen 3.81
(0.15)
3.13 (0.21) Observations 207 207 207 207 207 207
Countries 65 65 65 65 65 65
13
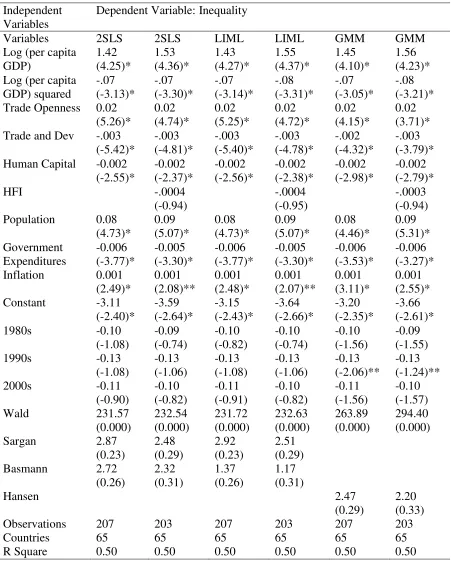
Table4: Inequality all developing Countries: controlling for regions and time
Independent Variables
Dependent Variable: Inequality
Variables 2SLS 2SLS LIML LIML GMM GMM Log (per capita
GDP) 1.42 (4.25)* 1.53 (4.36)* 1.43 (4.27)* 1.55 (4.37)* 1.45 (4.10)* 1.56 (4.23)* Log (per capita
GDP) squared -.07 (-3.13)* -.07 (-3.30)* -.07 (-3.14)* -.08 (-3.31)* -.07 (-3.05)* -.08 (-3.21)* Trade Openness 0.02
(5.26)* 0.02 (4.74)* 0.02 (5.25)* 0.02 (4.72)* 0.02 (4.15)* 0.02 (3.71)* Trade and Dev -.003
(-5.42)* -.003 (-4.81)* -.003 (-5.40)* -.003 (-4.78)* -.002 (-4.32)* -.003 (-3.79)* Human Capital -0.002
(-2.55)* -0.002 (-2.37)* -0.002 (-2.56)* -0.002 (-2.38)* -0.002 (-2.98)* -0.002 (-2.79)*
HFI -.0004
(-0.94)
-.0004 (-0.95)
-.0003 (-0.94) Population 0.08
(4.73)* 0.09 (5.07)* 0.08 (4.73)* 0.09 (5.07)* 0.08 (4.46)* 0.09 (5.31)* Government Expenditures -0.006 (-3.77)* -0.005 (-3.30)* -0.006 (-3.77)* -0.005 (-3.30)* -0.006 (-3.53)* -0.006 (-3.27)* Inflation 0.001
(2.49)* 0.001 (2.08)** 0.001 (2.48)* 0.001 (2.07)** 0.001 (3.11)* 0.001 (2.55)* Constant -3.11
(-2.40)* -3.59 (-2.64)* -3.15 (-2.43)* -3.64 (-2.66)* -3.20 (-2.35)* -3.66 (-2.61)* 1980s -0.10
(-1.08) -0.09 (-0.74) -0.10 (-0.82) -0.10 (-0.74) -0.10 (-1.56) -0.09 (-1.55) 1990s -0.13
(-1.08) -0.13 (-1.06) -0.13 (-1.08) -0.13 (-1.06) -0.13 (-2.06)** -0.13 (-1.24)** 2000s -0.11
(-0.90) -0.10 (-0.82) -0.11 (-0.91) -0.10 (-0.82) -0.11 (-1.56) -0.10 (-1.57) Wald 231.57
(0.000) 232.54 (0.000) 231.72 (0.000) 232.63 (0.000) 263.89 (0.000) 294.40 (0.000) Sargan 2.87
(0.23) 2.48 (0.29) 2.92 (0.23) 2.51 (0.29) Basmann 2.72
(0.26) 2.32 (0.31) 1.37 (0.26) 1.17 (0.31)
Hansen 2.47
(0.29)
2.20 (0.33) Observations 207 203 207 203 207 203
Countries 65 65 65 65 65 65
R Square 0.50 0.50 0.50 0.50 0.50 0.50
Table 4 replicates the benchmark finding using time related fixed effects. Time dummy variables
14
consistent across different decades. In order to control these effects four dummy variables-1970s,
1980s, 1990s, and 2000s- have been controlled. Our results are robust to the inclusion of time
specific effects. The independent effect of trade on inequality is inequality widening while
combined effect of trade is inequality narrowing. Therefore, relatively developed economies are
in better position to take the favourable effects of trade.
6. Conclusion
This study examines the impact of trade on cross-country inequality using a panel data set from
65 developing counties over a long period 1970-2008. This study differs from the existing
literature on distribution impact of trade by explicitly noting the importance of different
development levels in shaping the link.
Is trade in developing countries a blessing or a curse? The evidence presented in this paper suggests that the answer to this question is that it is ‗‗mixed blessing‖: on average trade does widen inequality in our sample of developing countries. However, the good news of the paper is
that the size and sign of the impact depends on a level of development that is amenable to policy
action.
The results reported in this paper show that the effect of trade on inequality could be either way
depending upon the level of development of a trade integrating economy. Those countries that
have a high level of economic development seem to acquire a favourable effect while
underdeveloped economies suffer. Thus, trade accentuates not ameliorate inequality in countries
with low level of economic development.
The analysis implies that poor of the underdeveloped countries suffer from trade and therefore,
these countries need more protectionist policies to safeguard the interests of poor while countries
at higher levels of economic development may follow more trade-liberalized policies as trade is
15
References
Acemoglu, D. (2003). Patterns of skill premia. Review of Economic Studies, 70, 199-230.
Ahluwalie M. S. (1976). Income distribution and development: Some stylized facts.
American Economic Review, 66, 1-28.
Autor, D., Katz, L., & Krueger, A. B. (1998). Computing inequality: have computers changed the labor market? Quarterly Journal of Economics, 113, 1169–1214.
Barba Navaretti, G., & Solaga, I. (2002). Weightless machines and costless knowledge—An empirical analysis of trade and technology diffusion. CEPR Discussion Paper No. 3321, Centre for Economic Policy Research, London.
Berman, E., & Machin, S. (2004). Globalization, skill-biased technological change and labour demand. In E. Lee, & M. Vivarelli (Eds.),Understanding Globalization, Employment and Poverty Reduction (pp. 39–66). New York: Palgrave Macmillan.
Berman, E., Bound, J., & Griliches, Z. (1994). Changes in the demand for skilled labor within U.S. manufacturing industries. Quarterly Journal of Economics, 109, 367–398.
Deaton, Angus S. and Christina H. P. (1997). The effect of economic and population growth on the national saving and inequality. Demography, 34, 97-114.
Hanson, G. and A. Harrison (1999). Trade and wage inequality in Mexico. Industrial and Labor Relations Review, 52 (2), 271-288.
Kuznet, S. (1955), Economic growth and income inequality. American Economic Review, 1-28.
MacDonald, Ronald and M. T. Majeed (2010). Distributional and poverty consequences of globalization: a dynamic comparative analysis for developing countries. Working Paper, University of Glasgow, 2010–22.
Majeed, M. T. (2010a). Inequality, trade openness and economic growth in Asia. Applied Econometrics and International Development, 10 (2).
Majeed, M. T. (2010b). Poverty and Employment: Empirical evidence from Pakistan. The Forman Journal of Economic Studies, Vol. (6).
16
Majeed, M. Tariq and Ronald MacDonald (2011). Corruption and financial intermediation in a panel of regions: cross-border effects of corruption. Working Paper, University of Glasgow, 2011–18.
Majeed, M. T. (2013). Inequality, Financial Development and Government: Evidence from Low-Income Developing Countries. MPRA Paper No. 50296, Online available at http://mpra.ub.uni-muenchen.de/50296/
Papanek, Gustav F., and O. Kyn (1986). The effect on income distribution of development, the growth rate, and economic strategy. Journal of Development Economics, 23, 55-65.
Perkins, R., & Neumayer, E. (2005). International technological diffusion, latecomer advantage and economic globalization: A multi-technology analysis. Annals of the American Association of Geographers, 95(4), 789–808.
Robbins, D. (2003). The impact of trade liberalization upon inequality in developing countries—A review of theory and evidence. ILO Working Paper, No. 13, International Labour Organization, Geneva.
Yeaple, S. R. (2005). A simple model of firm heterogeneity, international trade and wages.
Journal of International Economics, 65, 1–20.
Appendix
Table 5: Description of Variables
Variable name Definitions and Sources
Per capita real GDP Per capita real GDP growth rates are annual averages between two survey years and are derived from the IMF, WDI and International Financial Statistics (IFS) databases.
Gini coefficient It is a measure of income inequality based on Lorenz curve, which plots the share of population against the share of income received and has a minimum value of zero (reflecting perfect equality) and a maximum value of one (reflecting total inequality). The inequality data (Gini coefficient) are derived from World Bank data, UNDP and the IMF staff reports.
Secondary school enrolment
The secondary school enrolment as % of age group is at the beginning of the period. It is used as a proxy of investment in human capital and derived from World Bank database. Inflation Inflation rates, annual averages between two survey years, are calculated using the IFS‘s
CPI data.
Credit as % of GDP Credit as % of GDP represents Claims on the non-financial private sector/GDP and is derived from 32d line of the IFS.
M2 as % of GDP It represents Broad money/GDP, and is derived from lines 34 plus 35 of the IFS. Trade Liberalization It is the sum of exports and imports as a share of real GDP. Data on exports, imports and
real GDP are in the form of annual averages between survey years.