Munich Personal RePEc Archive
The immigrant-native pay gap in
Germany
Humpert, Stephan
BAMF Leuphana University Lueneburg
October 2013
The immigrant-native pay gap in Germany
Stephan Humpert1
Federal Office for Migration and Refugees, Nuremberg / Germany
and Leuphana University Lueneburg / Germany
October 2013
Abstract:
This note analyzes income differences between foreigners and natives in Germany. Using social
survey data (ALLBUS) for 2012, I use Mincer style quantile regressions and Oaxaca-Blinder
decompositions to estimate the size of the income differential. People not born in Germany, have an
income lose for about 6,5 to 10 per cent. People with a foreign citizenship have even higher income
losses. They face penalties between 8 to 14 percent. Decomposition shows a 9,2 percent difference
for immigrants, while most of the gap is unexplained. Individuals without German citizenship have
a 15,8 percent difference. Here more of the half remain unexplained.
Keywords: immigration, income, pay gap, Germany, ALLBUS,
JEL Classification: F22, F66, J24, J31, J61
Introduction
This note analyzes income differences between foreigners and natives in Germany. Following
Borjas (1994) and Altonji and Blank (1999), differences in income or wages of immigrants are
mostly explained by differences in productivity aspects. Here a general lower human capital such as
lower levels of education or less language skills, a mismatch situation of offered and demanded
qualifications, or sorting in low income occupations and sector, or selection into self emplyoment,
all these explanations lead on average to lower earnings of immigrants. However parts of the
income penalties can be driven by discrimination.
I use recently published social survey data (ALLBUS) for the year 2012 to perform Mincer style
quantile regressions and Oaxaca-Blinder decompositions to estimate the size of the income
differential. This paper is organized as follows: First, the overview of the research literature on the
subject of our research will be presented. Second, the ALLBUS data and the empirical model will
be described. Third, the models will be run and the results duly presented and interpreted. Finally,
in the conclusions the outcomes of our research will be clearly stated.
Overview of the research literature
Paper such as Jandová (2012) or Švec (2013) discuss that Germany has turned from a
non-migration country into an open country, that welcome higher net non-migration rates. Along with that,
papers discuss income differentials between natives and foreigners. Aldashev et. al (2012) use
German SOEP data to analyze the income gaps between German with and without foreign
background and foreigners. With decomposition techniques they report 11,3 to 20 percent gaps
between foreign and native men and women. The size of the gaps are similar between Germans
with and without migration background. Here 16,5 and 14,8 percent are reported for men and
women. The authors claim that only a small part of the gap is explained by endowment differences.
German social security data to decompose country specific income gaps for male immigrants and
natives. They show that some heterogeneity exist between different countries. Compared to
Germans immigrants differ in income from 8 (Spanish citizen) to 44 percent (Polish citizen). Using
the same approach for income quantiles, Lehmer and Ludsteck show that for most countries of
origin the size of the gap diminish along the income distribution. Bertolucci (2013) use German
linked employer-employee data and regression techniques to analyze income differentials within
firms. He presents a 12.8 to 16.8 percent income loss for immigrants. However not only immigrants
suffer from income penalties, most part of the literature deals with the gender gap for women or
gay men (e.g. Humpert, 2012).
The data set and methodological issues
I use the recently published wave (2012) of the German social survey ALLBUS (GESIS, 2012). For
a discussion of the data set. The majority of the 1,654 individuals are native Germans. While 10
percent (169 persons) of the entire population is not born in Germany, only 5 percent of them (76)
has no German citizenship. This two foreign subgroups include more than sixteen different
nationalities, mostly from Europe. I observe individuals who earn income from work. They are
between 18 and 65 years old. I control for the usual determinants: age, age square, working hours,
employment, part time work, union membership, education level family formation , children and
German federal states. See table 1 for descriptive Statistics.
Table 1: Descriptive Statistics
Variable Obs. Mean Std. Dev. Min Max
Working Hours 1,654 40.00423 10.77892 5 96 Work 1,654 5.009674 1.038824 1 7 Part Time Employment 1,654 0.1777509 0.3824185 0 1 Union Membership 1,654 0.1862152 0.389398 0 1 Education 1,654 2.114873 0.7354864 1 3 Family Formation 1,654 2.633011 1.868036 1 5 Children 1,654 0.643289 0.4791733 0 1 Federal State 1,654 87.23035 41.6947 1 16 Source:own calculation
I use Mincer style quantile regressions (with 10 to 90 percent) and the Oaxaca-Blinder
decomposition technique (Oaxaca, 1973; Blinder, 1973) to estimate the size of the income
differential.2 The logarithm of individual gross monthly income is used to perform the analysis. The
general estimation is like the following:
log yi = a0 + a1Foreigner i+ a2Xi + Ɛi
For every individual i the logarithm of the monthly income is regressed on a dummy for being
foreign (birthplace / citizenship) and on a vector of individual social-economic characteristics.
Epsilon describes the residuum.
Results
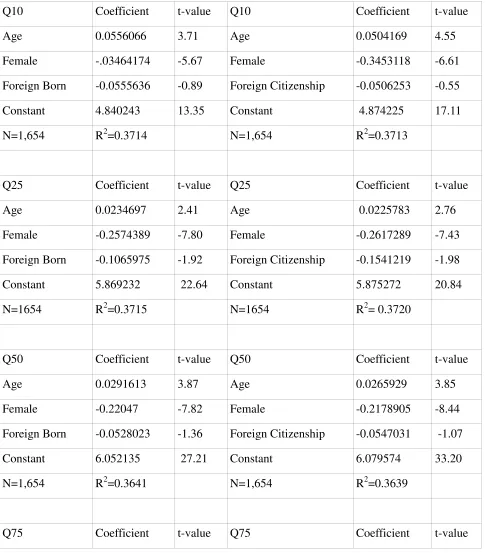
At first I analyze differences in immigrant income along the income distribution. Table 2 shows the
results of the quantile income regressions. Both groups face similar income penalties compared to
the German population. The results shows, that both groups are doing relatively better at the higher
part than at the lower of the income distribution. Immigrants, people who were not born in
Germany, have on average an income lose for about 6,55 to 10,11 percent. Foreigners, people with a
foreign citizenship born in Germany or abroad, have even higher income losses. They face penalties
on average between 8,22 to 14,28 percent. Although all coefficients for immigrants and foreigners
have negative signs, only two of the five quantiles have significant results. The other variables
reported have the expected signs, while log income increase with age, women face significant
negative income gaps between 20 and 30 percent. The results for the other coefficients are reported
by the author upon request. To sum up the direction and the size of the income penalty is similar to
[image:6.595.57.543.221.774.2]the results of Bertolucci (2013).
Table 2: Quantile Regression for foreign born (left) and a foreign citizenship (right)
Q10 Coefficient t-value Q10 Coefficient t-value
Age 0.0556066 3.71 Age 0.0504169 4.55
Female -.03464174 -5.67 Female -0.3453118 -6.61
Foreign Born -0.0555636 -0.89 Foreign Citizenship -0.0506253 -0.55
Constant 4.840243 13.35 Constant 4.874225 17.11
N=1,654 R2=0.3714 N=1,654 R2=0.3713
Q25 Coefficient t-value Q25 Coefficient t-value
Age 0.0234697 2.41 Age 0.0225783 2.76
Female -0.2574389 -7.80 Female -0.2617289 -7.43
Foreign Born -0.1065975 -1.92 Foreign Citizenship -0.1541219 -1.98
Constant 5.869232 22.64 Constant 5.875272 20.84
N=1654 R2=0.3715 N=1654 R2= 0.3720
Q50 Coefficient t-value Q50 Coefficient t-value
Age 0.0291613 3.87 Age 0.0265929 3.85
Female -0.22047 -7.82 Female -0.2178905 -8.44
Foreign Born -0.0528023 -1.36 Foreign Citizenship -0.0547031 -1.07
Constant 6.052135 27.21 Constant 6.079574 33.20
N=1,654 R2=0.3641 N=1,654 R2=0.3639
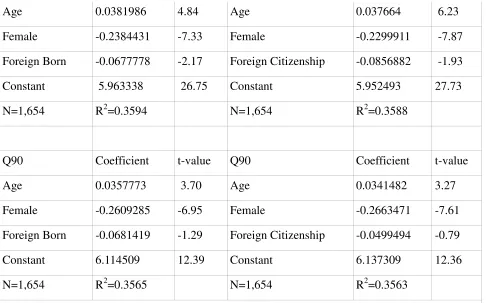
Age 0.0381986 4.84 Age 0.037664 6.23
Female -0.2384431 -7.33 Female -0.2299911 -7.87
Foreign Born -0.0677778 -2.17 Foreign Citizenship -0.0856882 -1.93
Constant 5.963338 26.75 Constant 5.952493 27.73
N=1,654 R2=0.3594 N=1,654 R2=0.3588
Q90 Coefficient t-value Q90 Coefficient t-value
Age 0.0357773 3.70 Age 0.0341482 3.27
Female -0.2609285 -6.95 Female -0.2663471 -7.61
Foreign Born -0.0681419 -1.29 Foreign Citizenship -0.0499494 -0.79
Constant 6.114509 12.39 Constant 6.137309 12.36
N=1,654 R2=0.3565 N=1,654 R2=0.3563
Controlled for age squared, working hours, work (ref: farmer), part time work (ref: full time), union membership (ref: no), education level (ref: low), family formation (ref: married), children (ref: no), federal state (ref: Schleswig-Holstein)
Source: own calculation
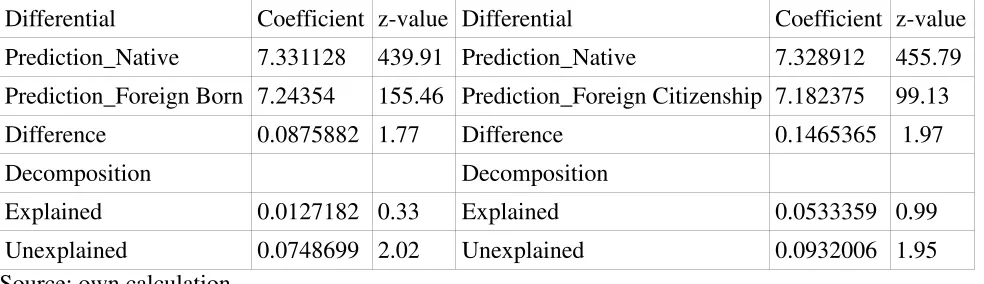
Now, I use Oaxaca- Blinder decomposition to estimate how much of the gap is explainable by
[image:7.595.57.543.55.358.2]differences in endowment, such as differences in age, education, or work. The results are reported in
table 3. For immigrants, people who are not born in Germany, decomposition shows a difference of
8,7 log points or 9,2 percent between natives and immigrants. Adjusting immigrants endowment to
the native one would increase immigrant income by 1,3 percent, but a gap of 7,8 percent point
remain unexplained. In other words 84,8 percent of the gap itself remains unexplained by
differences in endowments. In the second model, called foreigners or people without German
citizenship, the differences are even larger. There is a difference of 14,6 log points or 15,8 percent
between natives and foreigners. Adjusting foreigners endowment to the native one would increase
immigrant income by 5,5 percent, but a gap of 9,8 percent point remain unexplained. Here 62,0
percent of the gap itself remains unexplained by endowment. Again these results for the
literature, such as Aldashev et al. (2012) and Lehmer and Ludsteck (2011).
Table 3: Oaxaca Decomposition for foreign born (left) and a foreign citizenship (right)
Differential Coefficient z-value Differential Coefficient z-value Prediction_Native 7.331128 439.91 Prediction_Native 7.328912 455.79 Prediction_Foreign Born 7.24354 155.46 Prediction_Foreign Citizenship 7.182375 99.13 Difference 0.0875882 1.77 Difference 0.1465365 1.97 Decomposition Decomposition
Explained 0.0127182 0.33 Explained 0.0533359 0.99 Unexplained 0.0748699 2.02 Unexplained 0.0932006 1.95 Source: own calculation
Conclusion
This research note I analyzes income differences between foreigners and natives in Germany.
With German social survey data (ALLBUS) for the year 2012, I perform Mincer style quantile
regressions and Oaxaca-Blinder decompositions to estimate the size of the income differential.
The results are in line with earlier work on German native-immigrant income gap. People who were
not born in Germany, have on average an income lose for about 6,5 to 10 percent. People with a
foreign citizenship have even higher income losses. They face penalties on average between 8 to 14
percent. Decomposition shows a 9,2 percent difference, while 84,8 percent of the gap itself remains
unexplained by differences in endowments. Individuals without German citizenship have a 15,8
percent difference. Here 62,0 percent of the gap itself remains unexplained.
To sum up immigrants face income losses relative to the German working population. It is an
interesting result, that differences exist in the size of the income gap bet ween foreign born
individuals and foreign citizenship. However the rather small numbers of observes immigrants is a
limitation of this note.
Aldashev, A, Gernandt , J, Thomsen S.L. (2012). The immigrant-native wage gap in Germany,
Journal of Economics and Statistics (Jahrbuecher fuer Nationaloekonomie und Statistik) 232(5):
490-517.
Altonji, J, Blank, R. M. (1999) Race and gender in the labor market, in:Ashenfelter, O., Card, D.
(ed.), Handbook of Labor Economics, 3(3), Elsevier.
Bertolucci, C. (2013) Understanding the native-immigrant wage-gap using matched
employer-employee data: Evidence from Germany, Industrial and Labor Relations Review, forthcoming.
Blinder, A. (1973) Wage discrimination: reduced form and structural estimates, Journal of Human
Resources, 8(4): 436-455.
Borjas, G.E. (1994) The economics of immigration, Journal of Economic Literature 32(4),
1667-1717.
GESIS - Leibniz Institute for the Social Sciences (2012): ALLBUS/GGSS 2012 (Allgemeine
Bevölkerungsumfrage der Sozialwissenschaften/German General Social Survey 2012). GESIS Data
Archive, Cologne. ZA4614 Data file Version 1.0.0
Humpert, S. (2012) Somewhere over the Rainbow: Sexual Orientation Discrimination in Germany,
University of Lüneburg Working Paper Series in Economics 245
Jandová, P. (2012) Migration and economic condition in the EU: A case study of immigrants in
Jann, Benn (2008) The Blinder-Oaxaca decomposition for linear regression models, STATA Journal
8(4): 453-479.
Lehmer, F., Ludsteck, J. (2011) The immigrant wage gap in Germany: Are East Europeans worse
off? International Migration Review 45(4): 872-906.
Oaxaca, R. (1973), Male-female wage differentials in urban labor markets, International Economic
Review 14 (3): 693-709.
Švec, O. (2013). Labor migration in the EU: An empirical evidence, International Economics