Munich Personal RePEc Archive
Co-Movement of Pakistan Stock
Exchange with India, SP 500 and Nikkei
225: A Time-frequency (Wavelets)
Analysis
Shahzad, Syed Jawad Hussain and Zakaria, Muhammad and
Rehman, Mobeen ur and Ahmed, Tanveer and Khalid,
Saniya
10 December 2014
Online at
https://mpra.ub.uni-muenchen.de/60579/
Co-Movement of Pakistan Stock Exchange with India, S&P 500 and Nikkei
225: A Time-frequency (Wavelets) Analysis
Syed Jawad Hussain Shahzad
Lecturer, COMSATS Institute of Information Technology E-mail: [email protected]
Muhammad Zakaria
Assistant Professor, COMSATS Institute of Information Technology
Mobeen Ur Rehman
Lecturer, COMSATS Institute of Information Technology
Tanveer Ahmed
Lecturer, COMSATS Institute of Information Technology
Saniya Khaild
Lecturer, COMSATS Institute of Information Technology
Abstract
This study examines the co-movement between the Pakistan, Indian, S&P 500 and Nikkei 225 stock markets using weekly data from 1998 to 2013. The time-frequency relationship between the selected stock markets is conducted by using measures of continuous wavelet power spectrum, cross-wavelet transform and cross (squared) wavelet coherency. The empirical evidence suggests strong dependence between Pakistan and Indian stock markets. The co-movement of Pakistani index with U.S and Japanese, the developed markets, varies over time and frequency where the long-run relationship is dominant. The results of cross wavelet and wavelet coherence analysis indicate moderate covariance and correlation between stock indexes and the markets are in phase (i.e. cyclical in nature) over varying durations. Pakistan stock market was lagging during the entire period in relation to Indian stock market, corresponding to the 8~32 and then 64~256 weeks scale. Similar findings are evident for S&P 500 and Nikkei 225 indexes, however, the relationship occurs during the later period of study. All three wavelet indicators suggest strong evidence of higher co-movement during 2008-09 global financial crises. The empirical analysis reveals a strong evidence that the portfolio diversification benefits vary across frequencies and time. This analysis is unique and have several practical implications for regional and international investors while assigning the optimal weightage of different assets in portfolio formulation.
Introduction
The flow of capital from one country to another country is beneficial for both the source and host country and a rapid growth in international investment have recently been observed. The reason behind this could be the relaxation of controls on foreign exchange transaction and capital movements, decrease in cost of information and transaction due to improvement in technology, and because of expansion in the multinational operations of major companies (listing of firm on multiple stock exchanges). Contrary to that, restrictions will decrease these flows.
The risk of a portfolio can be decreased by diversifying the portfolio internationally in sock markets which are not perfectly correlated and where the correlation structure is stable. This diversification advantage has led finance researchers to investigate whether international stock markets are interdependent or not? Higher interdependence among stock exchanges would suggest less diversification advantage for investors. However, an investor from outside the region would find it easier and justifiable to invest in an integrated regional stock exchange. In addition to stock investors, managers would need to evaluate capital investment in different countries. If capital markets are segmented then investment projects with similar risks must be treated differently. In addition to the diversification and integration, Engle and Yoo (1987) and Clements and Hendry (1995) have further identified the importance of investigating cointegration among international equity markets i.e. if there exist a cointegration then it would mean predictability of at least one of the dependent variable in the set of cointegrated variables. The higher the cointegration between the set of variable implies that the dependent variable is highly predictable.
Previous studies have mainly focused on developed and European markets through different econometric techniques. These studies have used Johanson cointegration and Vector Error Correction (VECM) methods (Chen et al., 2000; Masih & Masih, 2001; Ratanapakorn & Sharma, 2002; Cerny, 2004; Aggarwal & Kyaw, 2005; Ciner, 2006; Egert & Kocenda, 2006; Hooi Lean & Ghosh, 2009; Huyghebaert & Wang, 2010), Vector Auto regressive (VAR) model (Cha & Oh;
2000; Dekker et al., 2001; Besslera & Yang, 2003; Yang et al., 2003; Click & Plummer, 2004; Diamandis; 2008), Generalize Auto-regression Heteroskedasticity (GARCH) model (Lahrech & Sylwester; 2011) and Pooled Mean Group (PMG) methodology (Boubaker & Jouini, 2014) among others. None of these studies have considered the developing markets like Pakistan besides that it was declared as the best market in the world based on its performance by Business Week, in 2002.
Given the divergent conclusions1 of the researches in this field and emergence of Pakistan stock exchange, it is important to investigate the co-movement of KSE 100 index with regional and international developed markets. The features of emerging markets are different because of their lower correlation with the developed markets. Adding stocks from emerging markets to the portfolio of developed markets will be beneficial for the efficient diversification of portfolio (Ajayi & Mehdian, 1995; Bowman & Comer, 2000). It is important that increasing interest and investment of international investors in these under developed/developing markets may also cause fluctuations in regional and international equity markets may make these markets vulnerable to international shocks. Finally, an insight into relationship between local and global markets can be utilized by investors for potential benefits and by policy makers for regulatory framework keeping in view
1There are inconclusive empirical studies on the cointegration relationship between many emerging and developed
the linkage between South Asian, and developed markets. We used weekly closing values of stock market indices for Pakistan, India, US and Japan. Wavelet approach, recently used by Aloui et al, (2014) to investigate the co-movement between sharia stocks and sukuk in GCC markets, is used to uncover the potential linkages between these stock markets. In the next section of the paper the data, methodology and results are discussed. Concluding remarks are provided in the last section.
3. Data, Methodology and Findings
3.1. Stock Market Data
This study examines the co-movement of Karachi Stock Exchange (KSE-100) Index of Pakistan with S&P Bombay Stock Exchange Sensitive Index (BSE 30), the Standard & Poor’s (S&P) 500 and Nikkei 225 Index. BSE 30, S&P 500 and Nikkei 225 indexes are considered the best representative benchmarks of Indian, US and Japanese equity markets. The data of weekly stock prices are taken from Econ Stats: The Economic Statistics and Indicators Database (Economy Watch) for a period 1 January 1998 to 31 December 2013 based on data availability. The period considered for empirical analysis is not only recent but is also sufficiently large to indicate long-run relationship between the variables and the impact of recent international events. We have used weekly price date instead of calculating the stock market returns as wavelet analysis has the advantage to decompose the time-series into its time and frequency components. Pre-filtering and stationarity is not required as the time series data is translated and scaled in the wavelet analysis. Floros (2005), Charles and Darne´ (2006), and Masih and Majid (2013) have also used price data instead of returns. The variables have been transformed to logarithmic form so the coefficients may be interpreted as the elasticity.
3.2. Time series properties
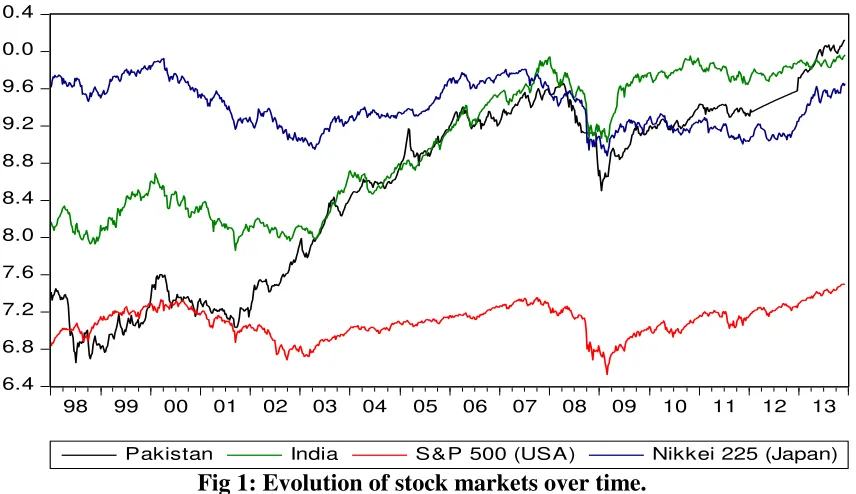
6.4 6.8 7.2 7.6 8.0 8.4 8.8 9.2 9.6 10.0 10.4
98 99 00 01 02 03 04 05 06 07 08 09 10 11 12 13
[image:5.612.95.523.71.318.2]Pakistan India S&P 500 (USA) Nikkei 225 (Japan)
Fig 1: Evolution of stock markets over time.
[image:5.612.89.528.587.709.2]Table 1 provides some descriptive statistics of the selected time series. Nikkei 225 has the highest average value, whereas, risk measured in term of standard deviation is highest for Pakistan. Similarly the difference between maximum (10.12) and minimum (6.655) values is also large for Pakistan. The value of Pakistan stock exchange has increased more than selected stock markets and hence display higher deviation from its mean. Further, in all indices, the skewness statistic is negative except for Japan. The reported statistics also show that the excess kurtosis statistic is higher for all indices, revealing the existence of leptokurtic distributions. The Jarque–Bera test with a p-value of zero strongly rejects the null hypothesis of normal distribution for all time series, indicating the non-normality. Pearson’s correlation coefficients of pairs reveal that correlation coefficient between Pakistan and Indian stock markets is high (0.92) and positively signed which also statistically significant at the 1% level. There is low positive and statistically significant correlation (0.33) between Pakistan and S&P 500 index. Pakistan stock exchange has a week negative (-0.22) but significant correlation with Nikkei 225 index of Japan. These findings are not surprising because regional markets are usually impacted by similar events and economic conditions in the region. The nature of relationship between with more distant markets is usually low and that makes Pakistan a potential diversification investment for international investors.
Table 1: Descriptive Statistics (1998W1 - 2013W52).
Pakistan India S&P 500 (USA) Nikkei 225 (Japan)
Mean 8.552 9.006 7.101 9.407
Std. Dev. 0.981 0.702 0.169 0.250
Min. 6.655 7.863 6.527 8.878
Max. 10.121 9.964 7.498 9.924
Skewness -0.425 -0.091 -0.363 0.109
Ex. Kurtosis 1.691 1.366 2.925 1.798
Pearson’s Correlation Coefficients
Pakistan 1
India 0.921𝑎 1
S&P 500 (USA) 0.331𝑎 0.436𝑎 1
Nikkei 225 (Japan) -0.222𝑎 -0.136𝑎 0.595𝑎 1
Sample period is from January 1, 1998 to December 31, 2013, with weekly frequency, and is totaling 832 weekly observations. J–B represents the Jarque–Bera normality test.
𝑎 indicates 1% level of significance. All stock series are non-stationary and all correlation
coefficients are significant at 1%.
[image:6.612.86.531.78.185.2]The stationarity of the times series has been examined by applying ADF (Dickey and Fuller, 1979) and PP (Philips and Perron, 1988). The results of unit root tests for are given in Table 2. Table 2 shows that all the index time series have unit root behavior at level and become stationery when first differenced without intercept and trend.
Table 2: ADF and PP Unit Root Test Results.
ADF Unit Root Test PP Unit Root Test
Variables Level 1st difference Level 1st difference
Pakistan -1.680 -24.248𝑎 -1.841 -24.316𝑎
India -1.948 -18.178𝑎 -2.086 -28.044𝑎
S&P 500 (USA) -2.053 -30.872𝑎 -1.974 -30.857𝑎 Nikkei 225 (Japan) -1.527 -29.428𝑎 -1.565 -29.419𝑎 ADF & PP present Augmented Dickey-Fuller and Phillips-Perron unit root tests, respectively. Lag order for all test is 14. Reported values are of t statistics, 𝑎 indicates 1% level of
significance. All series are I (I).
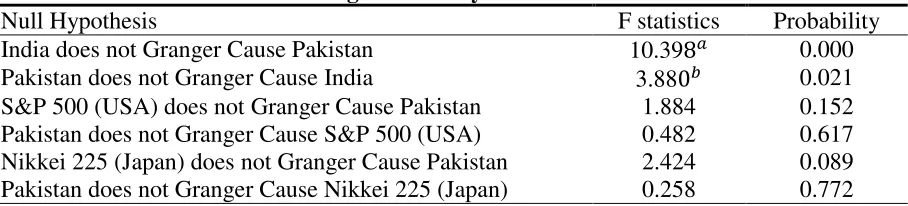
As a prolog to examine the dependencies between Pakistan, Indian, S&P 500 and Nikkei 225 indexes, Granger (1969) causality test is applied to assess the causality relationships. Results of the causality analysis are reported in Table 3. The results of weekly time series indicate presence of three causality relations at 1%, 5% and 10% level. There is a strong bidirectional causality between Pakistan and Indian stock markets. In a second relationship, causality runs from Nikkei 225 to Pakistan stock exchange that is significant at 10% level. However, there is no short run relationship between Pakistan and S&P 500 evident through Granger causality. The combined results of both Granger causality and Pearson's pairwise correlation show that in an investment perspective, the regional stock markets i.e. Pakistan and India exhibit a high level of interdependence.
Table 3: Results of Pairwise Granger Causality.
Null Hypothesis F statistics Probability
India does not Granger Cause Pakistan 10.398𝑎 0.000 Pakistan does not Granger Cause India 3.880𝑏 0.021 S&P 500 (USA) does not Granger Cause Pakistan 1.884 0.152 Pakistan does not Granger Cause S&P 500 (USA) 0.482 0.617 Nikkei 225 (Japan) does not Granger Cause Pakistan 2.424 0.089 Pakistan does not Granger Cause Nikkei 225 (Japan) 0.258 0.772
[image:6.612.77.531.601.704.2]3.3. Zhou’s (1996) long horizon regression
To expound the co-movement between Pakistan, India, S&P 500 and Nikkei 225 indexes for the short and long-time horizons, we have applied long-horizon regressions following Zhou (1996), Kim and In (2007) and a recent work of Aloui, et al (2014) on relationship between sharia stocks and sukuk in the GCC markets. Following specification is regressed to estimate the coefficients:
∆𝑃𝑡,𝑡+𝑁 = 𝛽0+ 𝛽1∆𝐼, 𝑆𝑃, 𝑁𝑡,𝑡+𝑁+ 𝜇𝑡,𝑡+𝑁
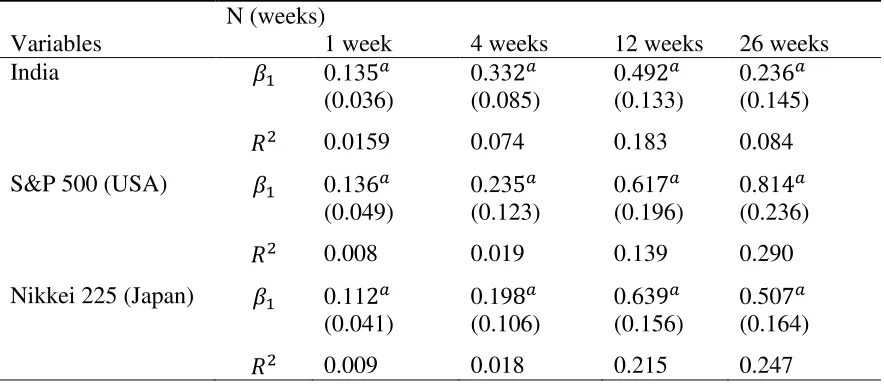
[image:7.612.86.528.506.698.2]In the above equation, ∆𝑃𝑡,𝑡+𝑁 are the changes in the natural log of weekly Pakistan stock index from time (t) to (t + N), ∆𝐼, 𝑆𝑃, 𝑁𝑡,𝑡+𝑁are the changes in natural log of weekly India, S&P 500 and Nikkei 225 indexes from (t) to (t + N), respectively. 𝜇𝑡,𝑡+𝑁 indicates the stochastic innovation in the change of the Pakistan stock index. Results of the estimation over different time periods are reported in Table 4. Firstly, the relationship between Pakistan and other regional i.e. India as well as international developed markets i.e. S&P 500 and Nikkei 225 indicated through 𝑅2 statistic increases as the time-horizon goes up in weeks. This finding implies that the predictive power of changes in the regional and developed indexes in explaining the Pakistan stock index increases with the time period. For example, 𝑅2 increases from 1.5% for the 1 week-time horizon to 13.3% for the 12 weeks (quarter) time horizon in case of India. Second, the slope coefficients for all stock markets is positive and highly significant. Additionally, the slope coefficients increase, in terms of absolute values, with the increase of time-horizon. These findings suggest that the degree of co-movement of Pakistan stock market increases with India, S&P 500 and Nikkei 225 as the time period increases. Hence, we can infer that the long term relationship should be considered while performing co-movement analysis. The change in co-movement over time can be attributed as a shifts in investors' behavior with the passage of time. Newey and West (1987) method is used to insure asymptotically valid standard errors and a positive definite variance-covariance matrix.
Table 4: Results of Zhou’s (1986) Regression Estimates.
N (weeks)
Variables 1 week 4 weeks 12 weeks 26 weeks
India 𝛽1 0.135𝑎 0.332𝑎 0.492𝑎 0.236𝑎
(0.036) (0.085) (0.133) (0.145)
𝑅2 0.0159 0.074 0.183 0.084
S&P 500 (USA) 𝛽1 0.136𝑎 0.235𝑎 0.617𝑎 0.814𝑎 (0.049) (0.123) (0.196) (0.236)
𝑅2 0.008 0.019 0.139 0.290
Nikkei 225 (Japan) 𝛽1 0.112𝑎 0.198𝑎 0.639𝑎 0.507𝑎 (0.041) (0.106) (0.156) (0.164)
Regressions are according to Eq. (1). Values in the parentheses are of Newey-west corrected standard errors. 𝑎 indicates 1% level of significance.
3.4. Wavelet Analysis
Aguiar-Conraria et al. (2008) have pointed out the two very important features of the wavelets analysis. First, the (discrete) wavelet transform has often been applied in the in most of the economic applications as a low and high pass filter. The economist find it hard to believe that these methods can provide better understanding of the data in comparison to the traditional techniques i.e. band pass filtering technique. Secondly, it is difficulty to analyze two or more time series simultaneously. Most of the previous economic studies have either used this technique to examine individual time series or several time series individually. And the decomposition is then further studied by using the using the traditional time series methodologies e.g. correlation or Granger causality analysis (Aguiar-Conraria et al; 2008, p. 2865). The wavelet power spectrum deals with a single time series and helps to examine the variations in a time series at different frequencies and periods over different scales.
The inability of wavelet power spectrum to deal with two time series have been overcome by Hudgins et al. (1993) and Torrence and Compo (2013) by developing the cross wavelet power and cross (squared) wavelet coherency, and phase difference. These techniques can deal with two time series by accommodating the time frequency analysis. These methods shows the curbed covariance and correlation coefficient between different series in the time frequency space. The addition of phase term help to examine the occurrence of pseudo cycle over the time. This phase difference also provide information regarding the lead-lag relationship between fluctuations of the two time series (Aguiar-Conraria et al.; 2008, p. 2867)2.
Figure 2 shows the continuous wavelet power spectrum of Pakistan, Indian, S&P 500 and Nikkei 225 indexes in sequence. These images indicate presence of some common islands in case of Indian, S&P 500 and Nikkei 225 Indexes. Specifically, these common trend in three wavelet power spectrums are occurring during 2008 to 2009 over different scales. These pattern reveal that global financial crises had a significant impact of Indian and developed stock markets. However, the Pakistan stock market is an exception. As mentioned previously, continuous wavelet power transform does not reveal a more precise picture on co-movement between the markets. Thus, we have further examined the cross relationship through cross wavelet transform.
Fig. 2: The continuous wavelet power spectrum of Pakistan, India, S&P 500 and Nikkei 225 Indexes.
Note: The dense black outline indicates the 5% significance level against the red noise. The lighter shade cone shows the edge effect also named as cone of influence (COI). Color code is indicated to the right of each picture where blue indicates the low power and red shows high power. Y-axis measures the frequencies or scale and X-axis represent the time in weeks.
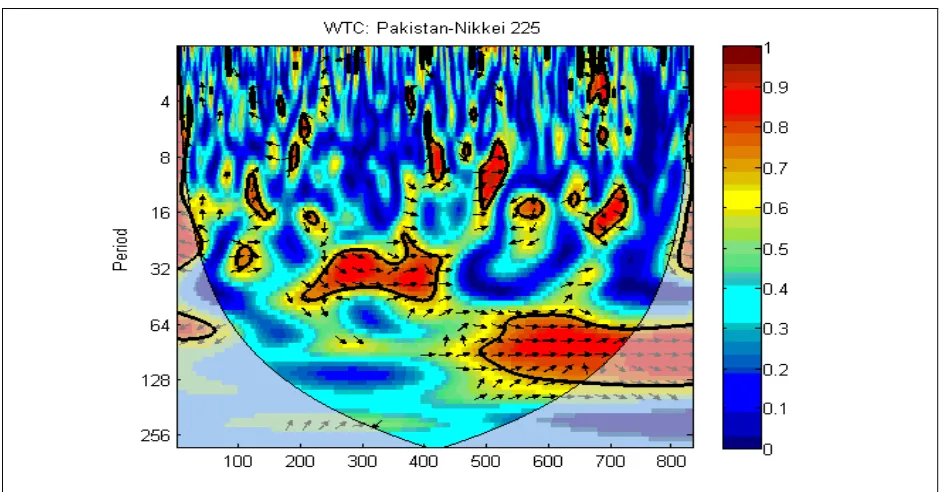
Fig. 3: Cross wavelet transform of the Pakistan, India, S&P 500 and Nikkei 225 time series.
The dense black outline indicates the 5% significance level against the red noise. The lighter shade cone shows the edge effect also named as cone of influence (COI). Color code is indicated to the right of each picture where blue indicates the low power and red shows high power. Y-axis measures the frequencies or scale and X-Y-axis represent the time in weeks. Arrows indicate the phase difference between the two series. Interpretation of the direction is a follow:
(→) = variables are in phase (cyclical effect on each other); (↗) = Pakistan is lagging; (↘) = Pakistan is leading; (←) = variables are out of phase (anti-cyclical effect); (↖) = Pakistan is leading; (↙) Pakistan is lagging.
Fig. 4: Cross-wavelet coherency or squared wavelet coherence.
The dense black outline indicates the 5% significance level against the red noise. The lighter shade cone shows the edge effect also named as cone of influence (COI). Color code is indicated to the right of each picture where blue indicates the low power and red shows high power. Y-axis measures the frequencies or scale and X-Y-axis represent the time in weeks. Arrows indicate the phase difference between the two series. Interpretation of the direction is a follow:
(→) = variables are in phase (cyclical effect on each other); (↗) = Pakistan is lagging; (↘) = Pakistan is leading; (←) = variables are out of phase (anti-cyclical effect); (↖) = Pakistan is leading; (↙) Pakistan is lagging.
Conclusion
This study examined the linkages of Pakistan stock exchange with Indian, US and Japan stock markets. KSE 100, BSE 30, S&P 500 and Nikkei 225 weekly data from period 1998 to 2013 is used for the empirical work. ADF and PP tests are used to ascertain the stationarity of the price series in natural logarithm form. Short- and long-run relationship is determined through Granger-causality and Zhou’s (1996) long horizon equation, respectively. The time-frequency relationship between the stock markets is analyzed by continuous wavelet, cross wavelet and wavelet coherency approaches.
cyclical and anti-cyclical) relationship over different durations can be drawn. Finally, the cross (squared) wavelet coherency, an indicator of possible correlation, indicate that all the markets are in phase with Pakistan stock exchange during the entire sample period to the 32~128 week scale for S&P 500 & Nikkei 225 and 64~256 weeks scale for India. These findings suggest that causal relationship of Pakistan with regional and developed international markets vary across scale. There is strong evidence of cyclical relationship between the markets however, in most of the period studied other markets were leading and passing cycle effects on Pakistan stock exchange.
The empirical analysis reveals a strong evidence that the portfolio diversification benefits vary across frequencies and time. This analysis is unique and have several practical implications for regional and international investors while assigning the optimal weightage of different assets in portfolio formulation. Local and international investors should also consider the short- and long-run co-movements between the markets while formulating their portfolios and keep in mind that the long-run relationship is dominant.
References
Aggarwal, R., & Kyaw, N. A. (2005). Equity market integration in the NAFTA region: Evidence from unit root and cointegration tests. International Review of Financial Analysis, 14(4), 393-406.
Aguiar-Conraria, L., Azevedo, N., & Soares, M. J. (2008). Using wavelets to decompose the time– frequency effects of monetary policy. Physica A: Statistical mechanics and its Applications, 387(12), 2863-2878.
Ajayi, R. A., & Mehdian, S. M. (1995). Global reaction of security prices to major US-induced surprises: an empirical investigation. Applied Financial Economics, 5(4), 203-218.
Aloui, C., Hammoudeh, S., & Hamida, H. B. (2014). Co-movement between sharia stocks and sukuk in the GCC markets: A time-frequency analysis. Journal of International Financial Markets, Institutions and Money. 34, 69-79.
Bessler, D. A., & Yang, J. (2003). The structure of interdependence in international stock markets. Journal of international money and finance, 22(2), 261-287.
Boubaker, S., & Jouini, J. (2014). Linkages between emerging and developed equity markets: Empirical evidence in the PMG framework. The North American Journal of Economics and Finance, 29, 322-335.
Bowman, R. G., & Comer, M. R. (2000). The reaction of world equity markets to the Asian economic crisis. Working paper, University of Auckland.
Cerny, A. (2004). Stock market integration and the speed of information transmission. Charles University. Center for Economic Research and Graduate Education.
Cha, B., & Oh, S. (2000). The relationship between developed equity markets and the Pacific Basin's emerging equity markets. International Review of Economics & Finance, 9(4), 299-322.
Chen, G. M., Firth, M., & Meng Rui, O. (2002). Stock market linkages: evidence from Latin America. Journal of Banking & Finance, 26(6), 1113-1141.
Ciner, C. (2006). A further look at linkages between NAFTA equity markets. The Quarterly Review of Economics and Finance, 46(3), 338-352.
Clements, M. P., & Hendry, D. F. (1995). Forecasting in cointegrated systems. Journal of Applied Econometrics, 10(2), 127-146.
Click, R. W., & Plummer, M. G. (2005). Stock market integration in ASEAN after the Asian financial crisis. Journal of Asian Economics, 16(1), 5-28.
Dekker, A., Sen, K., & Young, M. R. (2001). Equity market linkages in the Asia Pacific region: a comparison of the orthogonalised and generalised VAR approaches. Global Finance Journal, 12(1), 1-33.
Diamandis, P. F. (2008). Financial liberalization and changes in the dynamic behaviour of emerging market volatility: Evidence from four Latin American equity markets. Research in International business and Finance, 22(3), 362-377.
Dickey, D., Fuller, W.A., (1979). Distribution of the estimates for autoregressive time series with unit root. Journal of the American Statistical Association, 74(366), 427–431.
Égert, B., & Kočenda, E. (2007). Interdependence between Eastern and Western European stock
markets: Evidence from intraday data. Economic Systems, 31(2), 184-203.
Engle, R. F., & Yoo, B. S. (1987). Forecasting and testing in co-integrated systems. Journal of econometrics, 35(1), 143-159.
Floros, C. (2005). Price linkages between the US, Japan and UK stock markets. Financial Markets and Portfolio Management, 19(2), 169-178.
Granger, C. W. (1969). Investigating causal relations by econometric models and cross-spectral methods. Econometrica: Journal of the Econometric Society, 424-438.
Hooi Lean, H., & Ghosh, B. N. (2010). Economic Integration in Asia: Quo Vadis Malaysia?. International Economic Journal, 24(2), 237-248.
Hudgins, L., Friehe, C. A., & Mayer, M. E. (1993). Wavelet transforms and atmopsheric turbulence. Physical Review Letters, 71(20), 3279.
Huyghebaert, N., & Wang, L. (2010). The co-movement of stock markets in East Asia: Did the 1997–1998 Asian financial crisis really strengthen stock market integration?. China Economic Review, 21(1), 98-112.
Kearney, C., & Lucey, B. M. (2004). International equity market integration: Theory, evidence and implications. International Review of Financial Analysis, 13(5), 571-583.
Lahrech, A., & Sylwester, K. (2011). US and Latin American stock market linkages. Journal of International Money and Finance, 30(7), 1341-1357.
Masih, M., & Majid, H. A. (2013). Comovement of Selected International Stock Market Indices: A Continuous Wavelet Transformation and Cross Wavelet Transformation Analysis. http://mpra.ub.uni-muenchen.de/58313/.
Masih, R., & Masih, A. M. (2001). Long and short term dynamic causal transmission amongst international stock markets. Journal of international Money and Finance, 20(4), 563-587.
Phillips, P. C., & Perron, P. (1988). Testing for a unit root in time series regression. Biometrika, 75(2), 335-346.
Ratanapakorn, O., & Sharma, S. C. (2002). Interrelationships among regional stock indices. Review of Financial Economics, 11(2), 91-108.
Shahbaz, M., Tiwari, A. K., & Tahir, M. I. (2013). Analyzing Time-Frequency Relationship between Oil Price and Exchange Rate in Pakistan through Wavelets. Journal of Applied Statistics, DOI: 10.1080/02664763.2014.980784.
Torrence, C., & Compo, G. P. (1998). A practical guide to wavelet analysis. Bulletin of the American Meteorological society, 79(1), 61-78.
Yang, J., Kolari, J. W., & Min, I. (2003). Stock market integration and financial crises: the case of Asia. Applied Financial Economics, 13(7), 477-486.