DOI: http://dx.doi.org/10.26483/ijarcs.v8i7.4221
Volume 8, No. 7, July – August 2017
International Journal of Advanced Research in Computer Science
RESEARCH PAPER
Available Online at www.ijarcs.info
ISSN No. 0976-5697
EFFICIENT IMAGE SEGMENTTION OF BRAIN TUMOR DETECTION USING
FUZZY C-MEAN AND MEAN-SHIFT
Mandip kaur
Department of computer Engineering and Technology, Guru Nanak Dev University Amritsar, Punjab
Prabhpreet kaur
Department of computer Engineering and Technology, Guru Nanak Dev University Amritsar, Punjab
Abstract: The brain tumor detection is a very important application of medical image processing, where clustering techniques are used to detect the brain tumor diagnosis with magnetic resonance imaging (MRI). In the MRI has been considered because it provides accurate visualization of anatomical structure of tissues. In this paper initially, noise is removed from the input image using a fuzzy filter. A mean shift based fuzzy c-means algorithm is then utilized to segment the tumor. Experimental results show that the proposed Segmentation method applying on brain tumor MRI images which demonstrates that the presented method detects the brain tumor accurately and efficiently.
Keywords: Brain tumor,Magnetic resonance image, mean-shift, fuzzy c-mean.
I. INTRODUCTION
Image segmentation is an important step in medical imaging analysis. The goal of segmentation is to partition an image into a set of disjoint regions that have similar characteristics such as intensity, color and texture. In medical image segmentation, dissimilar image components are used for analysis of different structures, tissues and pathological regions [1]. Brain tumor segmentation is primarily used for diagnosis, patient monitoring, treatment planning, neurosurgery planning and radiotherapy planning. The task of brain tumor segmentation is to locate the tumor and delineate different sub-regions of the tumor, namely edema, non-enhanced, and enhanced regions. A standard way to diagnose a brain tumor is by using magnetic resonance
imaging (MRI) [2]. MRI is normally used in biomedical
field to perceive and visualize finer details in the internal structure of the human body. This technique is basically used to detect the variances in the tissues which have remote better technique and methods as compared to computed tomography. So, this notion makes this technique a very special one for the brain tumor detection. MRI was announced into clinical medicine and it is extremely used to detect the problems and calcifications in brain images5. [3]. Clustering approach is widely used in biomedical applications particularly for brain tumor detection in abnormal magnetic resonance (MR) images. In the segmentation of medical images, the objective is to identify different regions, organs and anatomical structures from data acquired via MRI [5].
Mellisa Pratiwia et al. [5] proposed a Radial Basis Function Neural Network (RBFNN) for mammograms classification based on Gray-level Co-occurrence Matrix (GLCM) texture based features. Marcin Szczuka et al. [6] proposed a possible extension of the classical multilayer artificial neural network model to the situation when the signals processed by the network are by definition compound and possibly structured. G. Vishnuvarthanana et al. [7] proposed a hybrid SOM-FKM algorithm assists the radio surgeon by providing an automated tissue segmentation and tumor identification, thus enhancing radio
the paretic procedures. B.K. Tripathy et al. [8] introduce the integrate notion with map-reduce paradigm of Hadoop and put forth three novel algorithms; Hadoop based possibilistic kernelized rough c-means (HPKRCM), Hadoop based possibilistic kernelized rough fuzzy c-means (HPKRFCM) and Hadoop based possibilistic kernelized rough intuitionistic fuzzy c-means (HPKRIFCM). V. P. Ananthi et al. [9] proposed the uncertainty in the allotment of values to
the membership function of the uncertain pixels. JiHoon
Kim et al [10] proposed the detect brain tumor with the K-means clustering method was able to provide for an efficient image data processing with reduced file sizes.
The proposed technique is implemented by integrated MRI brain tumor image classification using combine mean shift and fuzzy c-mean techniques has been utilized for that detection of MRI brain tumor images . It improves the better results are obtained.
This paper is arranged as follows: section 2 represents the proposed techniques. The section 3 represents the proposed methodology. The experiment results are presented in section 4. Section 5 represents the overall performance evaluation and Graphs; finally, section 6 concludes the paper.
II. PROPOSED TECHNIQUES
A. Fuzzy c-mean
Fuzzy c-means (FCM) is a method of clustering, which allows one piece of data to belong to two or more clusters The Fuzzy C-Means (FCM) clustering algorithm was first introduced by Dunn and later was extended by Bezdek. The FCM algorithm is mainly an iterative clustering method, which results an optimal c partition by minimizing the weighted within group sum of squared error objective function L. Normally, the FCM algorithm requires the number of clusters as an input. The fuzzy clustering techniques usually produce fuzzy partitions of the data instead of hard partitions. As a result, data patterns may be a member of several clusters with different membership values in each cluster. FCM uses fuzzy partitioning such that a given data point can belong to several groups with the degree of belongings specified by membership values between 0 and 1. For a given set of n data patterns, x= x1,…..xk,…..xn,, the fuzzy clustering technique minimizes the objective function, L.
The objective function of FCM is usually designed the following:
(1)
here N represent the number of shapes, C as a number of clusters, m is a every actual number (>1), that handles the fuzziness from the resulting partition , the degree of represent the quality of fuzzy regular membership associated pixel ya from the bth cluster, and ||·|| is any norm expressing the similarity measure. Fuzzy partitioning is performed by using an iterative optimization for mentioned objective function.
That objective function can be reduced if pixels at the centroid of the clusters tend to be allocated higher member valuation when pixels far from the centroid tend to be allocated lower regular membership valuation. Upgrading with regular membership along with the cluster centres ca is performed as follows:
(2)
(3)
B. Mean-shift
Kernel density estimation is the most popular density estimation method. Given n data points xi, i =1,….,n in the d –dimensional space Rd, the multivariate kernel density estimator with kernel K(x) and a symmetric positive definite
bandwidth matrix H, computed in the point X is given by.
(4)
where
(5)
Where n as a numerous samples, xi represents the sample by the unidentified density function f.
K(x) as a d-variate kernel function with compact support fulfilling the regularity limitation and ℋ is the symmetric positive particular bandwidth matrix [11]
(6)
where ck as a constant. The multivariate kernel can be generated from a symmetric univariate kernel K1(x) in two different ways
= (7)
Where is obtained from the product of the univariate kernels and from the rotating in Rd, is radially symmetric. The constant a-1k,d=
Assures that integrates to one, though this condition can be relaxed in our context. Either type of multivariate kernel obeys (6), but, for our purposes, the radially symmetric kernels are often more suitable.
We are interested only in a special class of radially symmetric kernel satisfying
) = (8)
In which case suffices to define the function k(x) called profile of the kernel, only for the normalization constant ck,d, which makes k(x) integrate to one, is assumed strictly positive.
Using fully parameterized increase the complexity of the estimation [11] and, in practice, the bandwidth matrix is chosen either as diagonal or proportional to the identity matrix . The clear advantage of the latter case is that only one bandwidth parameter h>o must be provided; however, as can be seen from (5), then the validity of a Euclidean metric for feature space should be confirmed first. Employing only one bandwidth parameter, the kernel density estimator (4) becomes the well-known expression
(9)
(10)
Which produce the radially symmetric kernel
(11)
Here cd is a volume of the unit d-dimensional sphere. Note that the Epanechnikov profile is not differentiating at the boundary. The profile
(12)
Produce the normal multivariate kernel
(13)
for both types of composition(7). The normal kernel is often symmetrically truncated to have a kernel with finite support. While these two kernels will suffice for most application we are interested in, all the results presented are below valid arbitrary kernels within the condition to be stated. Employing the profile notation, the density estimator (9) can be rewritten as
(14)
C. Density Gradient estimator based mean-shift
The density gradient estimator is obtained as the gradient of the density estimator by exploiting the linearity of (14)
(15)
We define the function
(16)
assuming that the derivative of the kernel profile k exists for all except for a finite set of points. Now, g(x) for profile, the kernel G(x) defined as
(17)
where is the corresponding normalization constant. The kernel k(x) was called the shadow of G(x) in [13] in a slightly different context. Note that the Epanechnikov kernel is the shadow of the uniform kernel that the d-dimensional units sphere, while the normal kernel and its shadow have the same expression.
Introducing g(x) into (15) produce
(18)
(19)
Where is assumed to be positive number. This condition is easy to satisfy for all the profiles met in
practice. Both term of the product in (19) have special significance. From (14), the first term is proportional to the density estimate at x computed with kernel G.
(20)
The second term is the mean shift
(21)
that the difference between the weighted mean, using the kernel G for weights, and x, the center of the kernel(window). From (20) and (21), (19) becomes
(22)
(23)
The expression (23) show that, at location x, the mean shift vector computed with kernel G is proportional to the normalized density gradient estimate obtained with kernel K. The normalization is by the density estimate in x computed with kernel G. The mean shift vector thud always points toward the direction of maximum increase in the density. This is more general formulation of the property first remarked by Fukunaga and Hostetler [14, 15], and discussed in [13].
The relation captured in (23) intuitive, the local mean is shifted toward the region in which the majority of the points reside. Since the mean shift vector is aligned with the local gradient estimate, it can define a path leading to a stationary point of the estimated density. The mean- shift procedure thus an adaptive gradient ascent method.
D. Proposed algorithm
In the proposed method we merge fuzzy c-mean and mean-shift segmentation. The main difference between our method and other similar techniques is that our methods continuously inherits and update the states, dependent upon the discussion of FCM and mean-shift. The proposed mean shift and FCM preformed as a follows steps
1. Initialize randomly the centres of clusters ci(0) 2. Let the iteration count number t=0.
3. Initialize the fuzzy partitions applying equation (2). 4. Increment t=t+1and compute cb applying equation
(3) or all those clusters.
5. Replace using equations (2). It becomes an FCM process.
kernel. To get ease of use ℋaα is a simply just use change in the diagonal item compared to other 0 components. Observe that mean shift must be used after that FCM stage.
7. Evaluate a mean-shift vector and after that iterate up until the mean-shift, Ms+(ya)-Ms-(ya) is the lower than 0.01 taking into consideration the last location and the normalized location change.
8. Combine pixels that process less Mahalanbis distance compared to pre-defined thresholds. 9. Repeat step 3 to 7 up until ˂Ɛ 0
(Ɛ0 is a pre-set threshold).
III. PRPOSED METHODOLOGY
Fig.2. Flowchart of proposed methodology
1. Initialize the system
2. The input MRI brain tumor image passed to system. 3. The input MRI images obtained for brain tumor detection are generally pre-processed to enhance the accuracy
associated with tumor detection. Fuzzy grayscale improvement filter for low contrast image corrupted through Gaussian noise. The degradation of the low contrast image is primarily caused by insufficient light during image taking and thus finally resulted in non uniform illumination from the image. Almost all of the created development filters enhanced image quality without considering the non uniform lighting from the image.
The Gaussian noise is Gaussian white noise using constant mean and variance. The most basically developing noise is additive Gaussian noise. The PDF of the Gaussian random variable, g is provided by
(24)
here g represent the grey level, as a mean of average value of g, and represent the standard derivation.
Fuzzy filters give ensuring result in image processing process manage with a few drawbacks of traditional filter. Fuzzy filter is capable of managing fuzzy and uncertain information. Sometime, that required to recover the heavily noise corrupted image where many uncertainties can be found and in cases fuzzy set theory extremely useful. Every pixel in the image is represented by a membership function and that considers the neighborhood information or other information, traditional filters eliminate the noise with blurry edges but fuzzy filter perform both edge preservation and smoothing.
4. Apply modified mean-shift and fuzzy c-mean is normally used by that segmentation process. Hybrid segmentation performs as follows:
(25)
5. Detect brain tumor specified area on the image.
6. Evaluate parameter, such as accuracy, bit error rate, peak signal to noise.
IV.EXPERIMENTALRESULTS
This section demonstrate the experimental results from the proposed Segmentation method applying brain tumor MRI images, for that experimental purposes, the images applied within this experiment were acquired from 2014.ncigt.org/publication/item/view/541 this source. The results are designed and implemented by using MATLAB and tested for detection of brain tumor MRI images.
Read input brain tumor MRI image
Preprocessing using a fuzzy filter
Apply hybrid segmentation using mean-shift and fuzzy c-mean
Evaluation of brain tumor specified area on the image
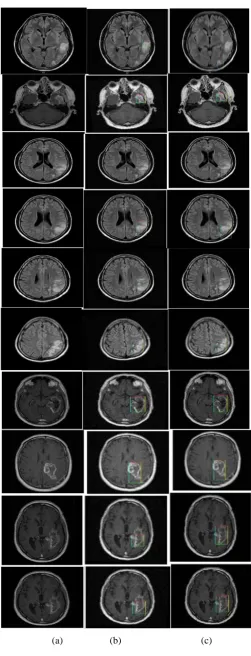
(a) (b) (c)
Fig.3. (a) Input brain tumor MRI image (b) k-mean (c) proposed method
A. Performance evaluation
The proposed method is applied to brain tumor MRI images. The proposed method is examined based on some
parameters, i.e. Peak Signal to Noise Ratio (PSNR), accuracy, Bit Error Rate (BER) and f-measure. A comparison is drawn between all the parameters and figures shows all the results.
1. Accuracy
Patient: positive for disease Healthy: negative for disease
True positive (TP) = the number of case accurately defined as patient
False negative (FN) = the number of case inaccurately defined as healthy
The accuracy with the test is its capability to identify the patient and healthy cases accurately. To calculate the accuracy of the test, we have estimate the quantity of true positive and true negative to all evaluated cases. Mathematically, this is state as:
(26)
Sensitivity: The sensitivity of the test is its capability to identify the patient cases accurately. To calculate it, we have calculated the quantity of true positive in patient cases. Mathematically, this is state as:
(27)
Specificity: The specificity of the test is its ability to identify the healthy cases accurately. To calculate it, we have calculated the quantity of true negative in healthy cases. Mathematically, this is state as:
(28)
Table 1
Accuracy evaluation
Brain tumor detection image no
Existing method (k-mean )
Proposed methods (hybrid fuzzy c-mean and c- mean-shift)
1 0.8005 0.9976
2 0.8906 0.9917
3 0.8997 0.9961
4 0.8493 0.9961
5 0.8252 0.9955
6 0.8142 0.9916
7 0.8469 0.9919
8 0.8299 0.9923
9 0.8126 0.9951
10 0.8029 0.9928
[image:5.595.37.289.53.711.2]
Graph.1. Accuracy of existing approach and proposed approach for different images
Graph.1. shows the analysis from the accuracy with various images. It’s apparent on the graph there exists a rise in accuracy value of images by using around existing methods. That improve shows the enhancement with the goal quality of the image.
2. Bit-error rate
This is described as the rate at which errors appear in the transmission system. This is directly translated into the number of errors in which appear in the string of the expressed number of bits. The bit error rate is calculated as follows:
(29) In case medium involving the transmitter and receiver is good and the signal to noise ratio is high, then the bit error rate is a very small - possibly insignificant and without detectable impact on the overall system. However, in case noise can be detected, there is probability in which the bit error rate must be considered. Bit error rate need to be reduce for better result. Hence proposed algorithm gives better result than existing approaches when bit error rate is much less in each image.
Table 2
Bit error rate evaluation
Brain tumor detection image no
Existing method (k-mean )
Proposed methods (hybrid fuzzy c-mean and c- mean-shift)
1 6.7906 1.2317
2 13.3725 5.8206
3 8.3333 3.5299
4 6.1392 2.2191
5 5.6422 3.3737
6 7.1217 3.1826
7 7.2549 3.5342
8 9.1930 1.9923
9 9.1930 3.4053
10 7.9122 2.5967
Graph.2. Bit error rate of existing and proposed method for various images
Graph 2 shows the analysis of the bit error rate of various images applying existing (blue color) methods and also proposed method (red color). It’s apparent with the graph there exists a reduction in bit error value of images by using the proposed method more than the existing techniques. That reduces a performance with the goal quality of the image.
V. CONCLUSION
This paper has proposed a novel brain tumor detection technique using the fuzzy filter. The proposed method has also proposed a fuzzy c-means based mean-shift segmentation algorithm. The proposed method designed as well as implemented with MATLAB 2010 utilizing image processing tool. Several evaluate with parameters has been considered for experimental purpose i.e. bit error rate, and accuracy. The MRI image data set that used in the proposed image segmentation method is extracted from the particular Google search engine. The proposed techniques show a better result and has no uncertainty associated with it. In near future we will try to enhance further by using the different fuzzy membership function. Also further enhancement can also be done by utilizing type 2 fuzzy membership function so that more uncertainty can be handled.
REFERENCES
[1] Sudip Kumar AdhikariaQ1, Jamuna Kanta Singb, Dipak Kumar Basub, Mita Nasipuri, Conditional spatial fuzzy C-means clustering algorithmfor segmentation of MRI images, Applied Soft Computing xxx (2015) xxx–xxx.
[2] Mohammad Havaei1 · Hugo Larochelle, Philippe Poulin1 · Pierre-Marc Jodoin, Within-brain classification for brain tumor segmentation, Int J CARS DOI 10.1007/s11548-015-1311-1,2015
Indian Journal of Science and Technology, Vol 8(29), DOI: 10.17485/ijst/2015/v8i29/83379, November 2015
[4] Suchita S.Mesakar, M.S.Chaudhari, image segmentation by fuzzy clustering algorithm for brain tumor detection, Proceedings of IRAJ International Conference, 21st July 2013, Pune, India, ISBN:
978-93-82702-22-[5] Mellisa Pratiwi, Alexander, Jeklin Harefa, Sakka Nanda, Mammograms Classification using Gray-level Co-occurrenc Matrix and Radial Basis Function Neural Network, Procedia Computer Science 59 ( 2015 ) 83 – 91.
[6] Marcin Szczuka, Dominik Ślęzak, Feedforward neural networks for compound signals,Theoretical Computer Science 412 (2011) 5960–5973, doi:10.1016/j.tcs.2011.05.046
[7] G. Vishnuvarthanana, M. Pallikonda Rajasekaranb, P. Subbarajc, Anitha Vishnuvarthanan An unsupervised learning method with a clustering approach fortumor identification and tissue segmentation in magnetic resonancebrain images Applied Soft Computing 38 (2016) 190–212,
[8] B.K. Tripathy∗, Dishant Mittal, Hadoop based uncertain possibilistic kernelized c-means algorithmsfor image segmentation and a comparative analysisB, Applied Soft
Computing 46 (2016) 886–923.
[9] V. P. Ananthi1 · P. Balasubramaniam1 · T. Kalaiselvi, A new fuzzy clustering algorithm for the segmentation of brain tumor, Soft Comput (2016) 20:4859–4879 DOI 10.1007/s00500-015-1775-5 methodologies and application [10] J. Kim, S. Lee, G. Lee, Using a Method Based on Modified
clustering and Mean Shift Segmentation to Reduce file size and Detect Brain Tumor from Magnetic Resonance Image(MRI)2016.
[11] M.P.Wand, M.Jones, Kernel Smoothing, Chapman and Hall,1995.
[12] D.W. Scott, Multivariate , Density Estimation ,Wilely,1992. [13] Y.Cheng, “Mean shift, Mode Seeking, and clustering ,IEEE
Trans.PPatern Analysis and Medicine Intelligence,vol.17 no. pp.790-799,aug 1995.
[14] K.Funaga, “ introduction to statistical patteren recoginition second ed. Academic Press.