Soil Carbon Changes Influenced by Soil Management and
Calculation Method
Maysoon M. Mikha1*, Joseph G. Benjamin1, Ardell D. Halvorson2, David C. Nielsen1
1US Department of Agricultural, Agricultural Research Service, Central Great Research Station, Akron, USA; 2US Department of
Agricultural, Agricultural Research Service, Northern Plains Soil Plant Nutrient Research, Fort Collins, USA. Email: *[email protected]
Received March 12th, 2013; revised April 13th, 2013; accepted April 21st, 2013
Copyright © 2013 Maysoon M. Mikha et al. This is an open access article distributed under the Creative Commons Attribution Li-cense, which permits unrestricted use, distribution, and reproduction in any medium, provided the original work is properly cited.
ABSTRACT
Throughout the years, many studies have evaluated changes in soil organic carbon (SOC) mass on a fixed-depth (FD) basis without considering changes in soil mass caused by changing bulk density (ρb). This study evaluates the temporal
changes in SOC caused by two factors: 1) changing SOC concentration; and 2) changing equivalent soil mass (ESM) in comparison with FD. In addition, this study evaluates calculating changes in SOC stock over time using a minimum equivalent soil mass (ESMmin) basis from a single sampling event compared with the FD scenario. A tillage [no-tillage
(NT) and chisel plow (CP)]-crop rotation (multiple crop and continuous corn), and irrigation (full and delayed)) study was initiated in 2001 on Weld silt loam soil. After seven years, SOC concentration in the 0 - 30 cm depth was 19.7% greater in 2008 compared with 2001. Standardizing the soil mass of 2001 to the ESM of 2008 for each individual treat-ment showed an average gain in SOC of 5.8 Mg C·ha−1 in 2008 compared with 2001. However, the increase in SOC
using ESM was twice the SOC gained with the FD calculation, where some treatments lost SOC after seven years of management. Estimating SOC levels using the ESMmin and, thereby, eliminating the confounding effect of soil ρb
indi-cated that SOC stock was influenced by crop species and their interaction with irrigation, but not by tillage practices. Over all, the ESM calculation appears to be more effective in evaluating SOC stock than the FD calculation.
Keywords: Soil Organic Carbon Stock; Equivalent Soil Mass; Minimum Equivalent Soil Mass; Fixed-Depth; Management Practices
1. Introduction
Numerous studies [1-8] have assessed management prac-tice-induced changes in SOC due to anthropogenic and environmental effects. The majority of previous research [1-6] evaluated SOC mass using SOC concentration and soil bulk density (ρb) associated with a specific soil depth.
However, management practices that influence SOC concentration may also affect soil ρb [5,9-12].
Conse-quently, researchers have argued that changes in soil ρb
and its effect on unequal soil mass associated with the fixed depth have a confounding effect on SOC mass es-timation when comparing changes in SOC associated with different management practices [13-17]. With an acknowledgment that SOC storage depends on soil mass and soil ρb, recent research estimated SOC and other soil
nutrients based on their concentration, soil thickness, and soil ρb [13-18]. Researchers have suggested alternative
methods to calculate SOC and other soil nutrients to ac-count for the changes in soil volume under different management practices [13,14,16].
The equivalent soil mass (ESM) is one of the methods being used to assess SOC and other soil nutrients on a normalized soil mass per unit area basis to account for differences in soil masses caused by soil management [13-16,18]. In the ESM calculation scenario, soil masses associated with different management practices are stan-dardized to a particular soil mass per unit area of a speci-fied layer and the equivalent soil C mass is adjusted to the ESM [13,16,19]. The goal of using the ESM and its associated equivalent C mass calculation is to reduce the SOC error calculated in soil profiles due to changing soil
ρb under different management practices [13,16]. Lee et
al. [16] proposed two other scenarios for SOC estimation associated with a single sampling event when the initial SOC or initial (ρb) values were not available. The first
method was based on using the minimum equivalent soil
mass (ESMmin) measured and the second alternative
measurement was based on using the maximum equiva-lent soil mass (ESMmax) measured. The ESMmin uses the
lowest soil mass measured, on an FD basis, to standard-ize other soil masses associated with different manage-ment practices. The ESMmax uses the greatest soil mass
measured, on an FD basis, among the different manage-ment practices as the standard [16].
The concept of soil mass and expressing SOC on an equivalent mass basis has been adopted by researchers for more than a decade, but this approach has not been readily applied to evaluate different management prac-tices [13,16]. There has been limited research on the in-fluence of different management practices on the stan-dardized soil ρb, soil mass, and the associated SOC using
field measured SOC and soil ρb. This type of research is
vital due to the fact that, in recent years, there has been a great interest for evaluating SOC stock and improving soil C sequestration as influenced by different manage-ment practices. Preventing SOC losses due to soil man-agement practices, especially tillage, and increasing crop residue return to the soil are important parameters in im-proving soil quality and sustainability. However, the confounding effect of soil ρb variability and the accuracy
the soil ρb measurement are influencing the perceived
temporal changes in SOC stock or SOC content in any given sampling period.
This study aims to evaluate different scenarios of SOC calculation where the confounding effect of soil ρb
vari-ability and its associated soil mass could be eliminated or reduced. We hypothesize that eliminating the differences in soil ρb and standardizing the soil masses into an ESM
basis may be more effective in predicting the temporal changes in SOC stock or in SOC content at any given time period compared with FD scenario. Therefore, the objectives of this study were to: 1) evaluate the temporal changes in SOC concentration to eliminate the temporal variation in soil ρb; 2) evaluate the temporal changes in
SOC stock as influenced by the FD and the ESM calcula-tion methods; and 3) evaluate treatment effects on SOC using the ESMmin basis of standardization. Overall, this
study identifies the temporal changes in SOC stock as influenced by different calculation scenarios after seven years of different management practices and subsequent changes in soil ρb and soil mass.
2. Materials and Methods
1 2.1. Site DescriptionAn irrigation-tillage-crop rotation study was established
in 2001 with an individual plot size of 18 m × 9 m at the USDA-ARS Central Great Plains Research Station near Akron, CO [6]. The research station is located within a semiarid climate region with approximate mean annual precipitation of 418 mm. The study site is located at 40˚8'N latitude and, 103˚9'W longitude with elevation of 1384 m. The soil type is a Weld silt loam (fine, smectitic, mesic Aridic Argiustolls). Treatments were arranged in a split-plot design with three replications. The main plot was an irrigation treatment and the subplot was the till-age and crop system that were randomized within the main irrigation plots. Details of tillage practices, irriga-tion treatment, previous and current cropping history, and site management were reported in detail by Benjamin et al. [6]. Briefly, tillage treatments included NT (directly planting into the previous crop residues; no-till) and CP (fall chisel plow at 35 cm depth with a parabolic-shank deep ripper and spring pass with a mulch treader disrupt-ing the approximately 0 - 5 cm depth). The irrigation treat- ment consisted of either full or delayed irrigation. The crop system treatments consisted of either continuous corn (CC) or a rotation (Rot) of a variety of crops throughout the study period, red kidney bean (Phaseolus vulgaris L.), spring barley (Hordeum vulgare L.), sunflower ( Helian-thus annuus L.), corn (Zea mays L.), spring pea (Pisum sativum L.), winter wheat (Triticum aestivum L.).
2.2. Soil Sampling
Soil samples were collected from non-wheel-tracked areas from the 0 - 15 and 15 - 30 cm depths in the spring of 2001 and 2008 before planting. The soil samples were collected from each plot using a 5 cm diam. probe at-tached to a Giddings hydraulic soil sampler (Giddings Machine Co., Windsor, CO). Soil samples were stored in sterile polypropylene bags placed coolers during field sampling and then stored at 4˚C in a walk-in cooler for about a week before processing. Soil samples were pre-screened through a 2 mm sieve to remove large pieces of plant material before being air dried and ground to pass through a 2 mm screen using a flail-type soil grinder. Soil samples for determining soil bulk density (ρb) were also
collected at the same sampling dates in 2001 and 2008. Soil ρb samples were collected for each plot using a 7.5
cm diam. by 60 cm long probe containing 7.5 cm diam. by 7.5 cm deep aluminum rings. The probe was attached to a Giddings hydraulic soil sampler for insertion into the soil. The rings were sectioned in the field to ensure an undisturbed soil sample with depth. Data were averaged for the 0 - 15 cm and 15 - 30 cm depths used in this study.
1Mention of commercial products and organization in this paper is
solely to provide specific information. It does not constitute endorse-ment by USDA-ARS over other products and organization not men-tioned. The US Department of Agriculture, Agricultural Research Ser-vice, is an equal opportunity/affirmative action employer and all agen-cy services are available without discrimination.
2.3. Soil Total C, Soil Inorganic C, and Soil Organic Carbon
ground to pass a 150 μ screen, and analyzed for different forms of soil carbon. Soil total C (STC) contents from the 0 - 15 and 15 - 30 cm depth were determined by dry combustion using a Carlo Erba C-N analyzer (Haake Buchler Instruments, Inc., Saddle Brook, NJ) at a com-mercial lab (Ward Laboratories, Kearney, NE). Soil in-organic C (SIC) content was evaluated using a modified pressure-calcimeter method reported by Sherrod et al.
[20]. Soil organic C (SOC) content was calculated from the differences between STC and SIC. The SOC at 0 - 30 cm depth presented in this study is a sum of SOC associ-ated with 0 - 15 and 15 - 30 cm depths. Data at 0 - 15 and 15 - 30 cm depths for SOC on a fixed depth basis were explained in details by Benjamin et al. [6].
2.4. Expression of Soil Organic Carbon (SOC) The SOC associated with an ESM was calculated using the approach outlined by Ellert and Bettany [13] and Lee
et al. [16]. The calculations presented in this study rep-resent three scenarios for SOC evaluation. The first sce-nario estimates the temporal changes only in SOC con-centration (g·C·kg−1 soil) from 2001 to 2008 (Table 1).
The second scenario estimates the temporal changes in SOC stock from 2001 to 2008 adjusted to the ESM of 2008 for every treatment combination in the 0 - 30 cm depth. The third scenario evaluates treatment effects on SOC after 7 yrs of differing management practices ad-justed to the ESMmin as if there was a single sampling in
2008. In addition, changes in SOC in the 0 - 30 cm depth using the second calculation scenario (ESM) will be compared to SOC calculated by the FD method reported by Benjamin et al. [6].
2.5. Equivalent Soil Mass (ESM) Scenario
To evaluate the temporal changes in SOC stock between 2001 and 2008 in the 0 - 30 cm depth, soil mass of 2001 was adjusted to the soil mass of 2008 (ESM) as influ-enced by management practices. In 2001, soil at this study site exhibited a high bulk density, ranging between 1.46 to 1.51 Mg·m−3 at the 0 - 30 cm depth. In 2008, soil
bulk density at the 0 - 30 cm depth ranged between 1.21 to 1.37 Mg·m−3 (Table 2). The soil mass in 2008
[image:3.595.58.536.394.717.2]associ-ated with each treatment was considered the baseline for the ESM calculation.
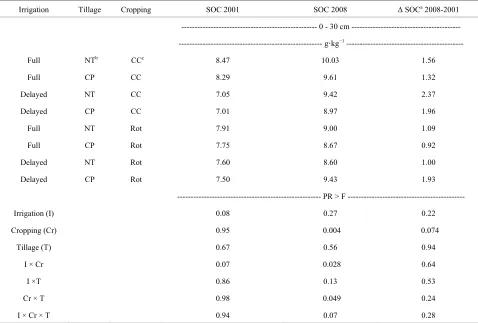
Table 1. The 2001 and 2008 soil organic C (SOC) concentration (g·kg−1) and the changes in SOC from 2001 to 2008 at 0 - 30 cm depth as influenced by irrigation, cropping, and tillage practices.
Irrigation Tillage Cropping SOC 2001 SOC 2008 Δ SOCa 2008-2001
--- 0 - 30 cm ---
--- g·kg−1 ---
Full NTb CCc 8.47 10.03 1.56
Full CP CC 8.29 9.61 1.32
Delayed NT CC 7.05 9.42 2.37
Delayed CP CC 7.01 8.97 1.96
Full NT Rot 7.91 9.00 1.09
Full CP Rot 7.75 8.67 0.92
Delayed NT Rot 7.60 8.60 1.00
Delayed CP Rot 7.50 9.43 1.93
--- PR > F ---
Irrigation (I) 0.08 0.27 0.22
Cropping (Cr) 0.95 0.004 0.074
Tillage (T) 0.67 0.56 0.94
I × Cr 0.07 0.028 0.64
I ×T 0.86 0.13 0.53
Cr × T 0.98 0.049 0.24
I × Cr × T 0.94 0.07 0.28
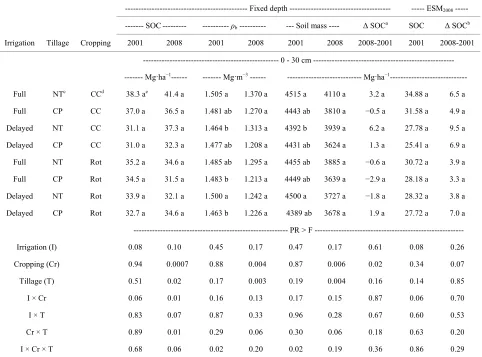
Table 2. The 2001 and 2008 soil organic C (SOC) mass (Mg·ha−1), soil bulk density (ρ
b) in Mg·m−3, soil mass (Mg·ha−1), and changes in SOC from 2001 to 2008 at 0 - 30 cm depth evaluated on a fixed depth (FD) basis and on an equivalent soil mass of the 2008 (ESM2008) as influenced by irrigation, cropping, and tillage practices.
--- Fixed depth --- --- ESM2008 ---
--- SOC--- --- ρb --- --- Soil mass ---- Δ SOCa SOC Δ SOCb
Irrigation Tillage Cropping 2001 2008 2001 2008 2001 2008 2008-2001 2001 2008-2001
--- 0 - 30 cm ---
--- Mg·ha−1--- --- Mg·m−3 --- --- Mg·ha−1---
Full NTc CCd 38.3 ae 41.4 a 1.505 a 1.370 a 4515 a 4110 a 3.2 a 34.88 a 6.5 a
Full CP CC 37.0 a 36.5 a 1.481 ab 1.270 a 4443 ab 3810 a −0.5 a 31.58 a 4.9 a
Delayed NT CC 31.1 a 37.3 a 1.464 b 1.313 a 4392 b 3939 a 6.2 a 27.78 a 9.5 a
Delayed CP CC 31.0 a 32.3 a 1.477 ab 1.208 a 4431 ab 3624 a 1.3 a 25.41 a 6.9 a
Full NT Rot 35.2 a 34.6 a 1.485 ab 1.295 a 4455 ab 3885 a −0.6 a 30.72 a 3.9 a
Full CP Rot 34.5 a 31.5 a 1.483 b 1.213 a 4449 ab 3639 a −2.9 a 28.18 a 3.3 a
Delayed NT Rot 33.9 a 32.1 a 1.500 a 1.242 a 4500 a 3727 a −1.8 a 28.32 a 3.8 a
Delayed CP Rot 32.7 a 34.6 a 1.463 b 1.226 a 4389 ab 3678 a 1.9 a 27.72 a 7.0 a
--- PR > F ---
Irrigation (I) 0.08 0.10 0.45 0.17 0.47 0.17 0.61 0.08 0.26
Cropping (Cr) 0.94 0.0007 0.88 0.004 0.87 0.006 0.02 0.34 0.07
Tillage (T) 0.51 0.02 0.17 0.003 0.19 0.004 0.16 0.14 0.85
I × Cr 0.06 0.01 0.16 0.13 0.17 0.15 0.87 0.06 0.70
I × T 0.83 0.07 0.87 0.33 0.96 0.28 0.67 0.60 0.53
Cr × T 0.89 0.01 0.29 0.06 0.30 0.06 0.18 0.63 0.20
I × Cr × T 0.68 0.06 0.02 0.20 0.02 0.19 0.36 0.86 0.29
aΔ SOC = Changes in SOC from 2001 to 2008 calculated on a fixed depth basis (FD) as reported by [6]; bΔ SOC = Changes in SOC from 2001 calculated on ESM2008 basis to 2008 calculated on a fixed depth basis; cNT = No-tillage; CP = Chisel plow; dCC = Continuous corn; Rot = mixed grass and broadleaf crops; eDifferent letter represents significant (P < 0.05) differences among the treatments within the same measurement and year.
Soil masses for each treatment in 2001 and 2008 were calculated on an FD basis using soil depth at 0 - 30 cm and field measured bulk density (Table 2) as
4
soil b
M d 10 (1) where Msoil represents soil mass measured in (Mg·ha−1),
d represents soil depth measured in (m), ρb represents soil
bulk density measured in (Mg·m−3) at the FD, and 104 is
the conversion factor (m2·ha−1). The SOC mass for the
FD of 0 - 30 cm was calculated from field measured SOC concentration as
3
C soil cons
M M C 10 (2) where MC represents soil C mass (Mg·C·ha−1) at the
fixed-depth, Ccons represents SOC concentration (kg·Mg−1),
and 10−3 is the conversion factor (Mg·kg−1).
To account for the difference in soil masses and bulk densities between 2001 and 2008, the soil mass and
as-sociated SOC in 2001 were adjusted to the ESM deter-mine in 2008 using a calculation procedure similar to Ellert and Bettany [13] and Lee et al. [16]. The equiva-lent soil mass for each treatment (i) [ESM(i)] in 2008 was
considered to be the baseline soil mass in 2001 for the same treatment. For each treatment (i) in 2001, the SOC content on an ESM(i) basis was calculated as shown in
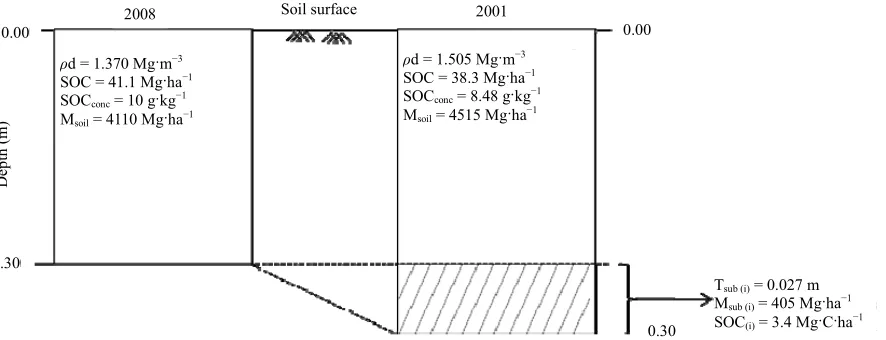
Figure 1. The example calculation in Figure 1 represents the data from the first treatment in Table 2 in the 0 - 30 cm depth, Full irrigation with NT and continuous corn (CC) cropping system. In this example, the soil mass in 2001 at 0 - 30 cm depth on a FD basis was reduced by 405 Mg·ha−1 due to different management practices
compared with the baseline of the same treatment (4110 Mg·ha−1) in 2008 (Table 2), calculated as
sub(i) soil 2001 (i) (i)
M M ESM (3)
2008 2001 0.00
0.30
0.00
ρd = 1.370 Mg·m−3
SOC = 41.1 Mg·ha−1
SOCconc = 10 g·kg−1
Msoil = 4110 Mg·ha−1
0.30 Soil surface
ρd = 1.505 Mg·m−3
SOC = 38.3 Mg·ha−1
SOCconc = 8.48 g·kg−1
Msoil = 4515 Mg·ha−1
Tsub (i) = 0.027 m
Msub (i) = 405 Mg·ha−1
SOC(i) = 3.4 Mg·C·ha−1
D
ept
h (
m
[image:5.595.86.529.87.257.2])
Figure 1. Example calculation for 2001 soil organic C (SOC) on an equivalent soil mass (ESM) basis of the 2008 soil mass at 0 - 30 cm depth. Msoil represents soil mass in Mg·ha−1 on a fixed-depth basis (FD) for 2001 and 2008, ρb represents soil bulk density in Mg·m−3, and SOC value represents soil C concentration (SOCconc) in g·kg−1 and SOC mass in Mg·ha−1. The shaded area associated in 2001 represents the soil thickness (Tsub(i)) measured in m, soil mass (Msub(i)) measured in Mg·ha−1, and its corresponding SOC(i) measured in Mg·ha−1 that needs to be subtracted from the 2001 value associated with the treatment (i) to standardized to the 2008 soil masses.
2001 (Mg·ha−1) for specific treatment (i), M
soil (2001) (i)
represents soil mass on an FD basis (Mg·ha−1) in 2001
associated with a specific treatment (i), ESM(i) represents
an equivalent soil mass on an FD basis (Mg·ha−1) in 2008
associated with the same specific treatment (i). The SOC associated with the subtracted layer of 2001 was equiva-lent to 3.4 Mg·ha−1 and was calculated using SOC
con-centration following Equation (2). Therefore, the SOC in 2001 was reduced to ~34.9 Mg·ha−1 to adjust to the
ESM(i) for the same treatment (Table 2). In addition, as
the soil mass of treatment (i) in 2001 was reduced, the soil thickness in 2001 for the same treatment was also reduced. The specific soil thickness (0.02691 m) associ-ated with Msub(i) was also subtracted from 30 cm depth in
2001 (Figure 1) calculated as follows:
sub(i) 4
sub(i)
b 2001 (i) M T
10 (4)
where Tsub(i) represents the soil thickness (m) that needs
to be subtracted from 2001 for a specific treatment (i), Msub(i) represents the soil mass subtracted from 2001
(Mg·ha−1) to adjust to the soil mass of 2008 for a specific
treatment (i), ρb (2001) (i) represents the 2001 bulk density
(Mg·m−3) of treatment (i), and 10−4 represents the
con-version factors (ha·m−2).
2.6. Minimum Equivalent Soil Mass Basis (ESMmin) Scenario
To estimate changes in SOC in 2008 among different management practices in the 0 - 30 cm depth, SOC was evaluated on the ESMmin as proposed by Lee et al. [16].
This type of SOC evaluation can be used when the initial conditions (SOC or bulk density) are not available. In this method, all soil masses associated with different treatments will be adjusted to the minimum observed soil mass and its associated ρb measured in 2008 in the 0 - 30
cm depth. The ESMmin chosen from the 2008 was 3624
Mg·ha−1 that represents the minimum ρ
b (Table 2). In
this approach, since the minimum soil mass was chosen, a specific amount of soil mass, with its associated SOC, was subtracted from each treatment in 2008 to equal the ESMmin (Table 3). For each treatment in 2008, the SOC
on an ESMmin basis was calculated as in Equation (1) and
Equation (2), except that Msub(i) was calculated as
sub(i) soil(i) min
M M ESM (5)
where Msub(i) represents the soil mass subtracted (Mg ha-1)
from each treatment (i) in 2008, Msoil(2008)(i) represents
soil mass on an FD basis (Mg·ha−1) in 2008 associated
with a specific treatment (i), and ESMmin represents the
chosen minimum equivalent soil mass (Mg·ha−1) in 2008.
The specific soil thickness associated with Msub(i) was
also subtracted from 30 cm depth in 2008 calculated as follows:
sub(i) 4
sub(i) b(i) M T
10 (6)
where Tsub(i) represents the soil thickness (m) that needs
to be subtracted from a specific treatment (i) in 2008, Msub(i) represents the soil mass subtracted from 2008
(Mg·ha−1) to adjust to the ESM
min, ρb(i) represents the
2008 bulk density (Mg·m−3) of treatment (i), and 10−4
2.7. Statistical Analyses
Analyses of variance were calculated using SAS Version 9.2 [21] to determine statistically significant effects of irrigation, tillage, and crop system on SOC content. The data were analyzed as a split plot design, with irrigation being the main effect and the factorial tillage and crop rotation treatments being sub plots within the main plots. The F-test was used to evaluate the treatment factors main effects and interactions. An F-protected t-test was used on a pair-wise comparison to follow up any signifi-cant findings. All results were considered signifisignifi-cantly different at p < 0.05 unless noted otherwise.
3. Results and Discussions
3.1. Soil Organic Carbon on the Concentration Basis
The first scenario, where SOC and changes in SOC are presented on a concentration basis (g·C·kg−1 soil) is used
to eliminate the temporal variation and the error associ-ated with soil ρb measurements [22,23]. This scenario
could be used as an option if the temporal changes in soil
ρb are high or if the soil ρb was not measured.
Average SOC in the 0 - 30 cm depth, expressed on a concentration basis, was 19.7% greater in 2008 compared with 2001 (Table 1). These data also show that SOC concentration was higher in 2008 than 2001 for every treatment combination, indicating that all management practices improved SOC at this study site. There were no treatment differences in SOC concentrations in 2001, because 2001 represents the initial condition for this study. However, SOC in 2008 was influenced by crop-ping system (p = 0.004), where SOC associated with CC system was 6.5% greater than the Rot system. All treat-ments gained SOC between 2001 and 2008, and the in-crease ranged between 0.13 to 0.34 g·kg−1·yr−1 (Table 1).
The increase of SOC with CC plots was, on average 23%, where the increase of the Rot plots was 16%.
3.2. Soil Organic Carbon Stocks on the
Equivalent Soil Mass of 2008 Basis (ESM) Soil ρb in the 0 - 30 cm depth significantly decreased
with time (p < 0.0001) by an average of 14.6% in 2008 compared with 2001 (Table 2). Averaged across all the treatment combinations, there was insignificant change in SOC, as evaluated by the FD basis, between 2008 and 2001. The SOC in the CC cropping system increased an average 7.4%, compared with an average of 2.3% with Rot system. Benjamin et al. [6] also concluded that SOC, measured on an FD basis, in NT plots gained an average of 2.1 Mg·ha−1, whereas the CP plots lost an average of
0.1 Mg·ha−1 at the 0- to 30-cm soil depth during the
sev-en-year study period. Many researchers argue the fact
that changes in soil ρb, and its effect on unequal soil mass
associated with the FD, has a confounding effect on the SOC mass estimation [12-14,16,17]. The changes in ρb
between 2001 and 2008 (Table 2) influenced soil mass, SOC, and the temporal change in SOC in the 0 - 30 cm layer, calculated on a fixed-depth basis. The principle behind the ESM calculation scenario is to evaluate the temporal changes in SOC mass by eliminating the changes in soil ρb caused by time and different
manage-ment practices. In this scenario, the soil masses of 2001 were standardized to the soil masses of 2008 for each treatment. The decision to normalize soil mass of 2001 to the mass of 2008 was influenced by two facts: 1) the soil
ρb and, consequently, the soil masses associated with
2001 were higher than 2008; and 2) no soil samples were measured below 30 cm depth, which provided no addi-tional information about soil ρb and SOC below 30 cm
for the 2008 sampling period. This is important because to adjust the low soil mass of 2008 to the high soil mass of 2001, a specific soil mass and SOC need to be added to soil mass of 2008 from the layer below 30 cm.
The reduction in soil masses from 2001 to 2008 ranged between 405 Mg·ha−1 to 810 Mg·ha−1. Likewise, the
re-duction in SOC from 2001 to 2008 ranged between 3.3 Mg·ha−1 to 6.3 Mg·ha−1 (Table 2). Using ESM as the
calculation scenario showed that management practices throughout the seven year period significantly (p < 0.0001) increased SOC by an average of 19.7% in 2008 compared with 2001. The NT plots gained an average of 5.9 Mg·ha−1 of SOC, whereas the CP plots gained an
average of 5.6 Mg·ha−1 of SOC between 2008 and 2001.
Similarly, the CC treatment gained an average of 21% SOC, and the Rot plots gained an average of 16% SOC between 2008 and 2001. In fact, SOC stock and percent SOC increased over time calculated with this scenario are similar to what we observed previously when SOC was evaluated on a concentration basis.
Using the ESM scenario produced SOC increases in all of the treatments between 2001 and 2008. The SOC gained with this scenario was parallel to what we previ-ously observed with SOC measured on a concentration basis. However, the SOC change between 2001 and 2008 with the ESM calculation scenario averaged 0.47 to 1.36 Mg C ha−1·yr−1, compared with that of Benjamin et al.
[6], which averaged −0.41 to 0.89 Mg·C·ha−1·yr−1, (
Ta-ble 2). Apparently, the soil ρb in both time periods had a
confounding effect on the changes in how SOC was evaluated. These data agree with our hypothesis that normalizing the soil mass of 2001 to the ESM of 2008 for each treatment reduced the confounding effect of a changing soil ρb. Also these data revealed that different
3.3. Soil Organic Carbon Stocks on the Minimum Equivalent Soil Mass Basis (ESMmin)
The minimum equivalent soil mass (ESMmin) is an
ap-proach for estimating SOC levels when the initial data were not previously measured [16]. The ESMmin
ap-proach is useful when soil ρb has decreased with time. In
this method, all soil masses from different management practices are standardized to the lowest soil mass and lowest ρb across the treatments of interest. The lowest
soil mass sampled in 2008, averaged across replications, was 3624 Mg·ha−1 (Table 3), and, therefore, was
consid-ered the ESMmin. The ESMmin was observed with delayed
irrigation with CP tillage and CC rotation. Since the
ESMmin was the lowest soil mass compared with any
other treatment, the soil mass and associated SOC were subtracted from the 0 - 30 cm from all other treatments to adjust for ESMmin.
In this scenario, the soil masses were reduced by an average of 0.0 Mg·ha−1 to 486 Mg·ha−1 compared to soil
masses calculated on an FD basis (Table 3). The reduc-tion in soil mass, after the ESMmin adjustment, was
greater with NT practice (300 Mg·ha−1) and CC system
(246 Mg·ha−1) compared with CP practice (73 Mg·ha−1)
and Rot system (127 Mg·ha−1). The greater amount of
soil mass that was subtracted from NT practice was a consequence of higher soil ρb compared with CP practice
(Table 2). After 7 yr of NT, soil ρb was 6.5% greater (p =
[image:7.595.60.532.327.698.2]0.003) in those plots than in the CP plots, which may be due to yearly soil disturbance associated with CP treat-ment. Adjusting the soil masses to the ESMmin reduced
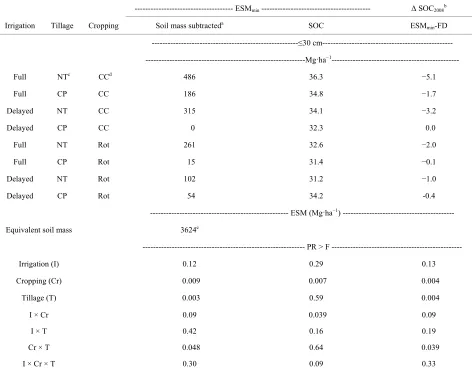
Table 3. Soil mass (Mg·ha−1) subtracted from the original soil mass of 2008 to adjust to the minimum equivalent soil mass (ESMmin) of 2008, soil organic C (SOC) mass (Mg·ha−1), and changes in SOC between 2008 calculated at ESMmin and SOC and on a fixed depth (FD) basis at 0 - 30 cm depth as influenced by irrigation, cropping system, and tillage practices.
--- ESMmin --- Δ SOC2008b
Irrigation Tillage Cropping Soil mass subtracteda SOC ESMmin-FD
---≤30 cm---
---Mg·ha−1---
Full NTc CCd 486 36.3 −5.1
Full CP CC 186 34.8 −1.7
Delayed NT CC 315 34.1 −3.2
Delayed CP CC 0 32.3 0.0
Full NT Rot 261 32.6 −2.0
Full CP Rot 15 31.4 −0.1
Delayed NT Rot 102 31.2 −1.0
Delayed CP Rot 54 34.2 -0.4
--- ESM (Mg·ha−1) ---
Equivalent soil mass 3624e
--- PR > F ---
Irrigation (I) 0.12 0.29 0.13
Cropping (Cr) 0.009 0.007 0.004
Tillage (T) 0.003 0.59 0.004
I × Cr 0.09 0.039 0.09
I × T 0.42 0.16 0.19
Cr × T 0.048 0.64 0.039
I × Cr × T 0.30 0.09 0.33
SOC an average of 0.0 Mg·ha−1 to 5.1 Mg·ha−1 (Table 3).
The reduction in SOC was influenced by tillage (p = 0.004), cropping system (p = 0.004), and the two way interaction of tillage x cropping system (p = 0.039). Eliminating the variability of soil ρb by adjusting the soil
masses associated with different treatment combinations to an ESMmin reduced the influence of tillage practices
(Tables 2 and 3) on changes in SOC. The differences in SOC between tillage practices disappeared because a significant amount of SOC was subtracted from the NT practices to adjust all treatments to the ESMmin standard.
SOC evaluated on an ESMmin basis was 4.8% lower (p =
0.005) than SOC evaluated on an FD basis. However, the effect of cropping system and the two way interaction, irrigation x cropping system, had the same influence on SOC (Tables 2 and 3) calculated with ESMmin and FD
scenarios. Apparently, standardizing soil masses to an ESMmin eliminated the influence of tillage practices on
SOC evaluation. These data agree with our previous hy-pothesis that evaluating SOC from a single sampling event on an ESMmin was more effective compared with
FD scenario basis due to the elimination of the soil ρb
variation associated with different management practices. It is important to recognize that there is another sce-nario of SOC calculation based on a maximum equiva-lent soil mass (ESMmax) proposed by Lee et al. [16] for
SOC changes from a single sampling event. Briefly, the ESMmax is based on using the greatest soil mass, on the
fixed-depth basis, among the different management prac-tices to which the other soil masses were normalized [16]. A specific soil mass, soil thickness, and its associated SOC are then added to the treatment that exhibits smaller soil mass than ESMmax chosen. The ESMmax calculation
scenario may give us a different perspective of SOC in-fluenced by different management practices, but this type of calculation was not performed for this data set due to the sampling depth limitations In this study, the lack of available SOC information associated with soil below 30 cm depth made it difficult to adjust soil masses to the ESMmax.
4. Conclusion
Evaluation of the temporal changes in SOC stock was influenced by calculation scenarios as a consequence of changes in soil ρb. The SOC estimation depends on how
one calculates changes in soil mass associated with dif-ferent sampling periods or management practices. Changes in SOC evaluated on the FD basis could be influenced by soil ρb variability. The temporal changes in the percent
SOC gained when using the ESM calculation scenario were similar to what we observed when SOC change was calculated on a concentration basis. These data indicate that the ESM was more effective in evaluating SOC stock due to the similarity to the temporal changes in
SOC concentration compared with the FD scenario. The ESMmin method appears to be an effective scenario for
SOC evaluation from a single sampling event. We were unable to compare the ESMmin method with other
evalua-tion scenarios due to the sampling depth limitaevalua-tions. Therefore, it is advisable to sample several centimeters below the chosen depth of interest to allow for SOC evaluation with different scenarios. Over all, the ESM scenario, where the temporal changes in soil ρb and soil
mass were adjusted for each individual treatment, ap-pears to be an effective scenario for evaluating SOC changes under these study conditions. We recommend, however, that the FD scenario also be included in future SOC evaluations so that comparisons with historical studies on changes in SOC with management and time can be made.
REFERENCES
[1] G. A. Peterson, A. D. Halvorson, J. L. Havlin, O. R. Jones, D. J. Lyon and D. L. Tanaka, “Reduced Tillage and In- creasing Cropping Intensity in the Great Plains Conserves Soil C,” Soil and Tillage Research, Vol. 47, No. 3-4, 1998, pp. 207-218. doi:10.1016/S0167-1987(98)00107-X [2] A. D. Halvorson, G. A. Peterson and C. A. Reule, “Till-
age System and Crop Rotation Effects on Dryland Crop Yield and Soil Carbon in the Central Great Plains,” Agronomy Journal, Vol. 94, No. 6, 2002, pp. 1429-1436. doi:10.2134/agronj2002.1429
[3] M. M. Mikha and C. W. Rice, “Tillage and Manure Ef- fects on Soil and Aggregate-Associated Carbon and Ni- trogen,” Soil Science Society of American Journal, Vol. 68, No. 3, 2004, pp. 809-816. doi:10.2136/sssaj2004.0809 [4] K. A. McVay, J. A. Budde, K. Fabrizzi, M. M. Mikha, C.
W. Rice, A. J. Schlegel, D. E. Peterson, D. W. Sweeney and C. Thompson, “Management Effects on Soil Physical Properties in Long-Term Tillage Studies in Kansas,” Soil Science Society of American Journal, Vol. 70, No. 2, 2006, pp. 434-438. doi:10.2136/sssaj2005.0249
[5] M. M. Mikha, M. F. Vigil, M. A. Liebig, R. A. Bowman, B. McConkey, E. J. Deibert and J. L. Pikul Jr., “Cropping System Influences on Soil Chemical Properties and Soil Quality in the Great Plains,” Renewable Agricultural and Food System, Vol. 21, No. 1, 2006, pp. 26-35.
doi:10.1079/RAFS2005123
[6] J. G. Benjamin, A. D. Halvorson, D. C. Nielsen and M. M. Mikha, “Crop Management Effects on Crop Residue Production and Changes in Soil Organic Carbon in the Central Great Plains,” Agronomy Journal, Vol. 102, No. 3, 2010, pp. 990-997. doi:10.2134/agronj2009.0483
[7] C. P. Jantalia and A. D. Halvorson, “Nitrogen Fertilizer Effects on Irrigated Conventional Tillage Corn Yields and Soil Carbon and Nitrogen Pools,” Agronomy Journal, Vol. 103, No. 3, 2011, pp. 871-878.
doi:10.2134/agronj2010.0455
Carbon and Nitrogen,” Agronomy Journal, Vol. 103, No. 5, 2011, pp. 1423-1431. doi:10.2134/agronj2011.0102 [9] A. D. Halvorson, C. A. Reule and R. F. Follett, “Nitrogen
Fertilization Effects on Soil Carbon and Nitrogen in a Dryland Cropping System,” Soil Science Society of Ame- rican Journal, Vol. 63, No. 4, 1999, pp. 912-917. doi:10.2136/sssaj1999.634912x
[10] J. A. Amador, Y. Wang, M. C. Savin and J. H. Görres, “Fine-Scale Spatial Variability of Physical and Biological Soil Properties in Kingston, Rhode Island,” Geoderma, Vol. 98, No. 1-2, 2000, pp. 83-94.
doi:10.1016/S0016-7061(00)00053-7
[11] J. G. Benjamin, M. M. Mikha, A. D. Nielsen, M. F. Vigil, F. Calderon and W. B. Henry, “Cropping Intensity Ef- fects on Physical Properties of No-Till Silt Loam,” Soil Science Society of American Journal, Vol. 71, No. 4, 2007, pp. 1160-1165. doi:10.2136/sssaj2006.0363
[12] M. M. Mikha, M. F. Vigil and J. G. Benjamin, “Long- Term Tillage Impacts on Soil Aggregation and Carbon Dynamics under Wheat-Fallow in the Central Great Plains,” Soil Science Society of American Journal, Vol. 77, No. 2, 2013, pp. 594-605. doi:10.2136/sssaj2012.0125 [13] B. H. Ellert and J. R. Bettany, “Calculation of Organic
Matter and Nutrients Stored in Soil under Contrasting Management Regimes,” Canadian Society of Soil Science, Vol. 75, No, 4, 1995, pp. 529-538.
doi:10.4141/cjss95-075
[14] X.-M. Yang and M. M. Wander, “Tillage Effects on Soil Organic Carbon Distribution and Storage in a Silt Loam Soil in Illinois,” Soil and Tillage Research, Vol. 52, No. 1-2, 1999, pp. 1-9. doi:10.1016/S0167-1987(99)00051-3 [15] R. M. Gifford and N. L. Roderick, “Soil Carbon Stocks
and Bulk Density: Special or Cumulative Mass Coordi- nates as a Basis for Expression?” Global Change Biology, Vol. 9, No. 11, 2003, pp. 1507-1514.
doi:10.1046/j.1365-2486.2003.00677.x
[16] J. Lee, J. W. Hopmans, D. E. Rolston, S. G. Baer and J. Six, “Determining Soil Carbon Stock Changes: Simple Bulk Density Fail,” Agriculture, Ecosystems and Envi- ronment, Vol. 134, No. 3-4, 2009, pp. 251-256.
doi:10.1016/j.agee.2009.07.006
[17] S. B Wuest, “Correction of Bulk Density and Sampling Method Biases Using Soil Mass per Unit Area,” Soil Sci- ence Society of American Journal, Vol. 73, No. 1, 2009, pp. 312-316. doi:10.2136/sssaj2008.0063
[18] A. Gál, T. J. Vyn, E. Michéli, E. J. Kladivko and W. W. McFee, “Soil Carbon and Nitrogen Accumulation with Long-Term No-Till Versus Mouldboard Plowing Overes- timated with Tilled-Zone Sampling Depths,” Soil and Tillage Research, Vol. 96, No. 1-2, 2007, pp. 42-51. doi:10.1016/j.still.2007.02.007
[19] B. H. Ellert, H. H. Janzen and B. G. McConkey, “Meas- uring and Comparing Soil Carbon Storage,” In: R. Lal, Ed., Assessment Methods for Soil Carbon, Lewis Pub- lishers, CRC Press, Boca Raton, 2001, pp. 131-144. [20] L. A. Sherrod, G. Dunn, G. A. Peterson and R. L. Kol-
berg, “Inorganic Carbon Analysis by Modified Pressure- Calcimeter Method,” Soil Science Society of American Journal, Vol. 66, No. 1, 2002, pp. 299-305.
doi:10.2136/sssaj2002.0299
[21] R. C. Littell, G. A. Milliken, W. W. Stroup, R. D. Wolf- inger and O. Schabenberger, “SAS for Mixed Models,” SAS Institute Inc., Cary, 2006.
[22] S. D. Logsdon and C. A. Cambardella, “Temporal Changes in Small Depth-Incremental Soil Bulk Density,” Soil Sci- ence Society of American Journal, Vol. 64, No. 2, 2000, pp. 710-714. doi:10.2136/sssaj2000.642710x
[23] A. Kulmatiski and K. H. Beard, “Reducing Sampling Error in Soil Research,” Soil Biology and Biochemistry, Vol. 36, No. 2, 2004, pp. 383-385.