ISSN Online: 2165-3925 ISSN Print: 2165-3917
A Comparison between Major Factor
Extraction and Factor Rotation Techniques in
Q-Methodology
Noori Akhtar-Danesh
School of Nursing, McMaster University, Hamilton, Canada
Abstract
The statistical analysis in Q-methodology is based on factor analysis followed by a factor rotation. Currently, the most common factor extraction methods are centroid and principal component extractions and the common tech-niques for factor rotation are manual rotation and varimax rotation. However, there are some other factor extraction methods such as principal axis factor-ing and factor rotation methods such as quartimax and equamax which are not used by Q-users because they have not been implemented in any major Q-program. In this article we briefly explain some major factor extraction and factor rotation techniques and compare these techniques using three datasets. We applied principal component and principal axis factoring methods for factor extraction and varimax, equamax, and quartimax factor rotation tech-niques to three actual datasets. We compared these techtech-niques based on the number of Q-sorts loaded on each factor, number of distinguishing state-ments on each factor, and excluded Q-sorts. There was not much difference between principal component and principal axis factoring factor extractions. The main findings of this article include emergence of a general factor and a smaller number of excluded Q-sorts based on quartimax rotation. Another interesting finding was that a smaller number of distinguishing statements for factors based on quartimax rotation compared to varimax and equamax rota-tions. These findings are not conclusive and further analysis on more datasets is needed.
Keywords
Q-Methodology, Factor Analysis, Factor Extraction, Factor Rotation
1. Introduction
The statistical analysis in Q-methodology is based on factor analysis, which is How to cite this paper: Akhtar-Danesh, N.
(2017) A Comparison between Major Fac-tor Extraction and FacFac-tor Rotation Tech-niques in Q-Methodology. Open Journal of Applied Sciences, 7, 147-156.
https://doi.org/10.4236/ojapps.2017.74013
Received: March 13, 2017 Accepted: April 25, 2017 Published: April 30, 2017
Copyright © 2017 by author and Scientific Research Publishing Inc. This work is licensed under the Creative Commons Attribution-NonCommercial International License (CC BY-NC 4.0). http://creativecommons.org/licenses/by-nc/4.0/
typically followed by a factor rotation. Currently, the most common factor ex-traction methods are centroid and principal component exex-tractions and the common techniques for factor rotation are manual rotation and varimax rota-tion. Indeed, these factor extraction and factor rotation techniques are the only
methods available in the widely used PQMethod program [1]. However, there
are some other factor extraction methods such as principal axis factoring and factor rotation methods such as quartimax and equamax which are not used by Q-users because they have not been implemented in any major Q-program. In this article we briefly explain some major factor extraction and factor rotation techniques and compare them using three actual datasets.
2. Background
2.1. Q-Methodology
Q-methodology was introduced in 1935 by Stephenson [2] [3] and is used to
identify common attitudes, perceptions, preferences, and feelings among a group of participants. In Q-methodology subjective viewpoints are collected and
ana-lyzed using a combination of qualitative and quantitative techniques [4]. A Q-
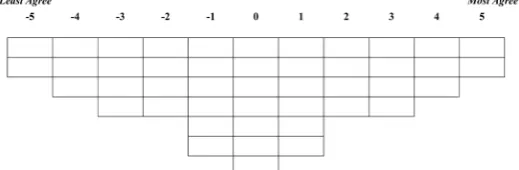
methodological study involves a) development of a sample of statements, Q- sample, related to the topic of interest and b) rank-ordering of the Q-sample by a group of individuals from their points of views about the statements using a
Q-sort table (a grid) with a quasi-normal distribution (see Figure 1). After data
collection using this grid a by-person factor analysis (i.e., the factor analysis is
performed on persons not variables or traits) is used to analyze these Q-sorts where each Q-sort represents one individual rather than one variable or trait. However, for the rest of this article Q-sort and variable are used interchangeably. Using such by-person factor analysis, similar Q-sorts (individuals) are grouped together as factors where each factor represents a group of individuals with sim-ilar views, feelings, or preferences about the theme of the study. One individual
is loaded on one factor if his/her factor loading is statistically significant (p ≤
0.05). A factor loading is simply the correlation between a Q-sort and the factor
itself. Then, each factor is interpreted based on its distinguishing statements and
statements with high or low factor scores. Distinguishing statements usually de-fine the uniqueness of each factor.
2.2. Factor Extraction Methods
[image:2.595.244.504.626.711.2]General statistical programs such as SPSS, R, Stata, and SAS include several fac-
tor extraction methods such as principal component analysis (PCA), principal axis factoring (PAF), maximum likelihood (ML) factoring, image factoring, and alpha factoring. Each of these methods uses a different orthogonal solution; however with large sample sizes the differences in the extracted factors are usually negligible. Besides, the original extracted factors usually need to be ro-tated to provide interpretable results. In this section a brief review of PCA, PAF, ML, and centroid factor analysis (CFA) and their statistical properties are pro-vided.
Principal component analysis: PCA is the most common factor extraction method and is available in almost every statistical program. It is also commonly used in Q-methodology. PCA extracts uncorrelated linear combinations of the observed Q-sorts. In general, this method analyzes all the variance in the
va-riables (Q-sorts), i.e. it uses 1’s in the diagonal of the correlation matrix for
fac-tor extraction. The first facfac-tor explains the highest level of variance in the dataset and the second factor explains the second highest level of variance; this process continues until 100% of the variance in the dataset is explained by the factors.
Principal axis factoring: The only difference between PAF and PCA is that in PAF in the correlation matrix 1’s in the diagonal are replaced with the estimates of the communalities. For each Q-sort the communality is defined as the pro-portion of the variance that is shared (or explained) with the other variables (Q-sorts) and is estimated through an iterative process with the squared multiple correlation of each variable with all other variables as the starting values and continues until the changes in the communalities satisfy the convergence
crite-rion for extraction [5]. PAF is generally considered to be appropriate for the
ex-ploration of the underlying factors for theoretical purposes [6].
Maximum likelihood factor extraction: In ML approach like PAF, the com-munalities are used instead of 1’s in the diagonal of correlation matrix. This ap-proach is based on the assumption of normal distribution for each variable (Q-sort). However, the main issue with using ML in Q-methodology is that it
results in Heywood case [6] more than other techniques such as PCA and PAF.
A Heywood case can occur in all common factor analysis solutions such as PAF, CFA, and ML, where the iteratively estimated communality becomes unity or
exceeds unity and the variance of some factors become zero or negative [7].
Centroid factor extraction: CFA has been fully described by Thurstone [8] and
a description of its use in Q-methodology has been provided by Brown [9]. It is
known as an approximation of PAF [10] [11]. However, the technical difference
between PAF and CFA is that in PAF the sum of squares of “loadings” is max-imized, but in CFA the average of the “loadings” is maximized. Unlike PCA and PAF, CFA is not implemented in any major statistical program such as SAS, SPSS, Stata, and R but it is available to Q-methodology users through PQMethod
[1] and PCQ [12]. Because CFA is known as an approximation of PAF, we will
be using PAF instead.
2.3. Factor Rotation Techniques
factors are not meaningful or easily interpretable. Factor rotation is a process in which the original factors are rotated about their origin to yield a simple
struc-ture and easily interpretable factors [8]. In the remainder of this section the
common factor rotation techniques are described. Manual rotation, as a com-mon approach in Q-methodology, is not described in this article for two reasons; 1) we intend to compare objective (statistical) rotation solutions and manual ro-tation is rather a more subjective approach, 2) because of its subjective solution it is less reliable and not comparable with other objective approaches. For fur-ther information on manual rotation the readers are referred to Akhtar-Danesh
[13] and Akhtar-Danesh & Mirza [14].
Varimax is the most common rotation method used in statistical analysis. It is an orthogonal rotation technique that minimizes the number of variables with high loadings, either positive or negative, for each factor. In other words, it maximizes the variance of each factor loading by making high loadings higher and low loadings lower to simplify factor interpretation. Mathematically, it redi-stributes the total variance among Q-sorts between a smaller number of factors with relatively equal variances. In this process, the amount of variations among the major unrotated factors will be redistributed among the other smaller factors
[5]. This process generates factors with relatively equal importance. In other
words, it eliminates a “general” factor, even if one exists [15]. In the same way, it
overinflates the smaller factors. Therefore, use of varimax rotation should be avoided if there is a general factor among the Q-sorts and if there are too many factors for rotation. As a result, using varimax may not be suitable for some da-tasets where the aim is to identify the salient factors irrespective of their distri-bution or how many Q-sorts load on each factor.
Quartimax is an orthogonal method that minimizes the number of factors that explain each Q-sort. In other words, each Q-sort is loaded on the minimum number of factors. This is similar to the common practice in Q-methodology in which each Q-sort is preferred to be loaded only on one factor. From this point of view, quartimax rotation seems to be more appropriate in Q-methodology. As a result, it provides a smaller number of confounded Q-sorts where each Q-sort loads on more than one factor. Although technically there should be no problem in having confounded Q-sorts, in the current practice such Q-sorts are excluded from further analysis, specifically for indentifying distinguishing statements; a problem which needs to be addressed in the future versions of Q-programs.
Quartimax simplifies the rows of the factor-loading matrix by loading each Q- sort strongly on a single factor. This process provides a more interpretable factor compared to varimax rotation. This method tends to generate a general factor
among the participants [16]. A general factor usually consists of a large number
of Q-sorts compared to the other factors. Therefore, if the existence of a general factor is expected among the Q-sorts, this method might be the method of choice; however, it may create a general factor even if one does not exist among the Q-sorts.
simplifies both the number of variables that load highly on a factor and the number of factors needed to explain a variable. However, Tabachnick & Fidell
[5] warns that equamax approach might behave erratically. Therefore, a
tho-rough inspection of factors is warranted after factor extraction.
Direct oblimin is an oblique (non-orthogonal) rotation method. This tech-nique minimizes the cross products of loadings to simplify factors. This method permits fairly high correlation between factors, although factors may not neces-sarily correlate if this method is used.
3. Methods
We applied PCA and PAF factor extraction and varimax, equamax, and quarti-max factor rotation techniques to three actual datasets. We compared these techniques based on the number of Q-sorts loaded on each factor, number of distinguishing statements on each factor, and excluded Q-sorts. After factor ex-traction and factor rotation a Q-sort was excluded from further analysis if it was not significantly correlated with any factor or if its squared loading on any factor
was less than half of the communality for that Q-sort [17]. Using this approach
there will be no confounded Q-sort, i.e. no Q-sort loading on more than one
factor. However, we will not discuss the actual distinguishing statements because such a comparison will be quite subjective and extensive and merits a separate article by itself. In the following the three datasets which we used in this analysis are explained.
Dataset 1: Nursing professionalism
In this study, 30 nursing students and 24 faculty members participated to sort 45 statements that were used to identify common viewpoints about professio-nalism held by nursing faculty and students. The study resulted in indentifying 4
common factors named as humanists, portrayers, facilitators, and regulators.
The Q-sort table for this study included seven rows and eleven columns with the
anchors of −5 (least agree or most disagree) and +5 (most agree). The full
de-scription of the study is provided elsewhere [18].
Dataset 2: Childhood obesity
This study was designed to investigate parents’ perceptions on the cause of childhood obesity, its impact on children’s health, and the barriers to successful prevention of childhood obesity. The study participants included parents who attended a clinic for their children’s well-baby check-up. The Q-sample included 42 statements and 33 parents completed the study. The Q-sort table included 8
rows and 11 columns with anchors of −5 (Strongly Disagree) and +5 (Strongly
Agree). The study is fully described by Akhtar-Danesh et al.[19].
Dataset 3: Nursing students perceptions of clinical simulation
col-umns were numbered sequentially from −4 (most disagree or least agree) to +4 (most agree). Three salient viewpoints were identified: Challenge Seekers, Rea-listic Embracers, and Support Seekers. The full study is described by Landeen et al. [20].
Statistical Analysis
We first applied the PCA and PAF for factor extraction to the abovementioned datasets. Then, we used varimax, equamax, and quartimax techniques to rotate the first four factors for Dataset 1 and Dataset 2 and the first three factors for
Dataset 3. The newly developed qfactor program written in Stata (available from
author) was used for analysis.
4. Results
The results of this comparison are presented as the number of Q-sorts loaded on each factor, excluded Q-sorts, and number of distinguishing statements for each factor.
4.1. Number of Loaded and Excluded Q-Sorts
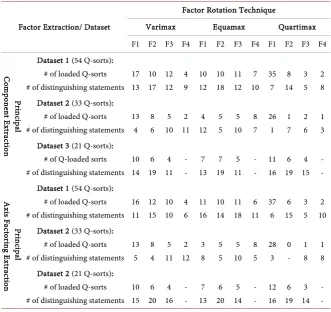
Table 1 represents the number of Q-sorts loaded on each factor for each dataset
[image:6.595.207.539.418.730.2]based on different factor extraction and factor rotation methods. Using PCA
Table 1. Factor characteristics based on different factor extraction and factor rotation
techniques.
Factor Extraction/ Dataset
Factor Rotation Technique
Varimax Equamax Quartimax F1 F2 F3 F4 F1 F2 F3 F4 F1 F2 F3 F4
Pr in cip al C om po nen t E xtr ac tio n
Dataset 1 (54 Q-sorts): # of loaded Q-sorts # of distinguishing statements
17 13 10 17 12 12 4 9 10 12 10 18 11 12 7 10 35 7 8 14 3 5 2 8 Dataset 2 (33 Q-sorts):
# of loaded Q-sorts # of distinguishing statements
13 4 8 6 5 10 2 11 4 12 5 5 5 10 8 7 26 1 1 7 2 6 1 3 Dataset 3 (21 Q-sorts):
# of Q-loaded sorts # of distinguishing statements
10 14 6 19 4 11 - - 7 13 7 19 5 11 - - 11 16 6 19 4 15 - - Pr in cip al A xis Fa ct ori ng E xtr acti on
Dataset 1 (54 Q-sorts): # of loaded Q-sorts # of distinguishing statements
16 11 12 15 10 10 4 6 11 16 10 14 11 18 6 11 37 6 6 15 3 5 2 10 Dataset 2 (33 Q-sorts):
# of loaded Q-sorts # of distinguishing statements
13 5 8 4 5 11 2 12 3 8 5 5 5 10 8 5 28 3 0 - 1 8 1 8 Dataset 2 (21 Q-sorts):
# of loaded Q-sorts # of distinguishing statements
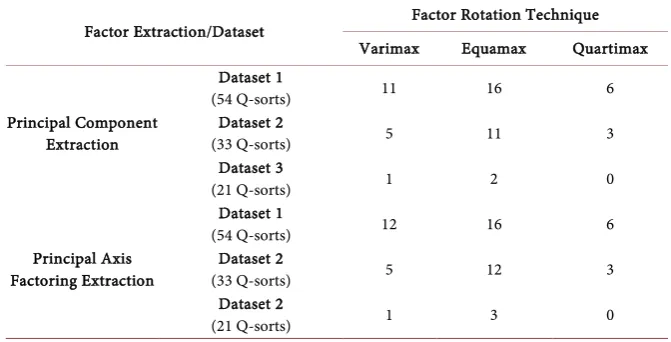
factor extraction and varimax rotation, only 43 (79.6%) and 28 (84.8%) of the Q-sorts were loaded on the first four factors for Dataset 1 and Dataset 2, respec-tively. The corresponding numbers were 38 (70.4%) and 22 (66.7%) for equamax rotation and 48 (88.9%) and 30 (90.9%) for quartimax rotation. Therefore, the number of excluded Q-sorts from Dataset 1 and Dataset 2 were 11 and 5 for va-rimax rotation, 6 and 11 for equamax rotation, and 6 and 3 for quartimax
rota-tion, respectively (Table 2). Using PCA and quartimax rotation, the first factor
includes more than 70% of the loaded Q-sorts for both datasets, which may con-firm the emergence of a general factor. However, Dataset 3 showed a different pattern of results from PCA and different rotation techniques. First, proportion of excluded Q-sorts was much smaller for this dataset compared with other two datasets for all rotation techniques. Second, there was not much difference be-tween number of Q-sorts loaded on each factor bebe-tween varimax and quartimax rotations. Third, the first factor from quartimax rotation includes only about 52% of the Q-sorts. The main differences between equamax and the other two rotation techniques were that, 1) equamax showed a more balanced distribution of Q-sorts among factors and 2) considerably less total number of Q-sorts loaded on the factors. For instance, total number of loaded Q-sorts for Dataset 1 was 43 for varimax and 48 for quartimax rotation, but total number for equamax rotation was 38. These numbers in the same order for Dataset 2 were 28, 30, and 22 and for Dataset 3 are 20, 21, and 19. Similar results were observed for PAF factor extraction based on the three rotation techniques.
4.2. Number of Distinguishing Statements
There was not much change or trend in the number of distinguishing statements between PCA and PAF factor rotations. However, there were interesting differ-ences between varimax, equamax, and quartimax rotations in the number of
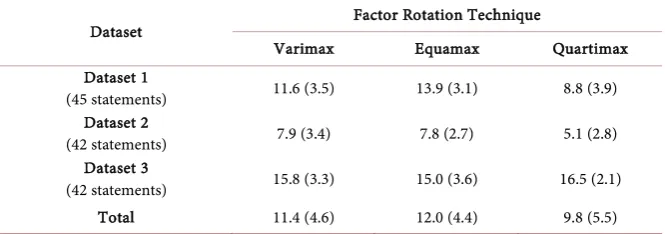
dis-tinguishing statements (Table 1 & Table 3). Quartimax factors tended to have a
[image:7.595.204.540.561.732.2]smaller number of distinguishing statements compared with varimax and equa-max factors for datasets 1 and 2, although this was not the case for Dataset 3. For
Table 2. Number of excluded Q-sorts based on factor extraction and factor rotation
methods.
Factor Extraction/Dataset Factor Rotation Technique Varimax Equamax Quartimax
Principal Component Extraction
Dataset 1
(54 Q-sorts) 11 16 6
Dataset 2
(33 Q-sorts) 5 11 3
Dataset 3
(21 Q-sorts) 1 2 0
Principal Axis Factoring Extraction
Dataset 1
(54 Q-sorts) 12 16 6
Dataset 2
(33 Q-sorts) 5 12 3
Dataset 2
Table 3. Number (SD) of distinguishing statements based on dataset and factor rotation methods.
Dataset Factor Rotation Technique
Varimax Equamax Quartimax
Dataset 1
(45 statements) 11.6 (3.5) 13.9 (3.1) 8.8 (3.9) Dataset 2
(42 statements) 7.9 (3.4) 7.8 (2.7) 5.1 (2.8) Dataset 3
(42 statements) 15.8 (3.3) 15.0 (3.6) 16.5 (2.1)
Total 11.4 (4.6) 12.0 (4.4) 9.8 (5.5)
instance, the mean (SD) number of distinguishing statements for varimax fac-tors were 11.6 (3.5), 7.9 (3.4), and 15.8 (3.3) for Dataset 1, Dataset 2, and Dataset 3, respectively. These numbers for quartimax rotation were 8.8 (3.9), 5.1 (2.8), and 16.5 (2.1). On average quartimax rotation resulted in a smaller distinguish-ing statements compared to varimax and equamax rotations.
5. Discussion
For the past eight decades the statistical analysis of Q-methodology has been li-mited to centroid and principal component factor extraction methods and two
factor rotation techniques, i.e. varimax rotation and manual rotation. However,
many more factor extraction and factor rotation techniques have been developed since the inception of Q-methodology in 1935 and each of these techniques might be more appropriate in certain conditions. We intend to examine differ-ent methods of analysis in Q-methodology in a series of articles. In this article, we compared the applications of PCA and PAF factor extractions as well as va-rimax, equamax, and quartimax rotations in Q-methodology using three data-sets.
From a theoretical point of view, quartimax rotation seems to be more appro-priate if we expect to have a general factor among the participants. However, using this technique a general factor in the data may emerge as an artifact of
quartimax rotation [21]. On the other hand, varimax rotation eliminates a
gen-eral factor even if one exists. Therefore, sufficient knowledge of the topic of in-terest might become helpful when deciding on the method of rotation. Although equamax is defined as a combination of varimax and quartimax we did not ob-serve an intermediating role for equamax in the three datasets which might be due to small sample sizes in the datasets.
number of distinguishing statements might make the interpretation much simp-ler but it may come in the expense of losing richness of interpretation with larger number of distinguishing statements.
Acknowledgements
I am thankful to Dr. Janet Landeen for using Dataset 3.
References
[1] Schmolck, P. (2014) PQ Method. Version 2.35. University of the Bundeswehr Mu-nich, Neubiberg. http://schmolck.org/qmethod/
[2] Stephenson, W. (1935) Correlating Persons Instead of Tests. Character and
Perso-nality, 4, 17-24.https://doi.org/10.1111/j.1467-6494.1935.tb02022.x
[3] Stephenson, W. (1935) Technique of Factor Analysis. Nature, 136, 297. https://doi.org/10.1038/136297b0
[4] Akhtar-Danesh, N., Baumann, A. and Cordingley, L. (2008) Q-Methodology in Nursing Research: A Promising Method for the Study of Subjectivity. Western
Journal of Nursing Research, 30, 759-773.
https://doi.org/10.1177/0193945907312979
[5] Tabachnick, B.G. and Fidell, L.S. (2001) Using Multivariate Statistics. Allyn and Bacon, Boston.
[6] Pett, M.A., Lackey, N.R. and Sullivan, J.J. (2003) Making Sense of Factor Analysis: The Use of Factor Analysis for Instrument Development in Health Care Research. Sage, Thousand Oaks.https://doi.org/10.4135/9781412984898
[7] Heywood, H.B. (1931) On Finite Sequence of Real Numbers. Proceedings of the
Royal Society of London. Series A, Containing Papers of a Mathematical and
Physi-cal Character, 134, 486-501.https://doi.org/10.1098/rspa.1931.0209
[8] Thurstone, L.L. (1947) Multiple Factor Analysis. University of Chicago, Chicago. [9] Brown, S.R. (1980) Political Subjectivity: Application of Q Methodology in Political
Science. Yale University Press, New Haven.
[10] Holzinger, K.J. (1946) A Comparison of the Principal Axis and Centroid Factors.
Journal of Educational Psychology, 36, 449-472.https://doi.org/10.1037/h0056539
[11] Mulaik, S.A. (2009) Factor Scores and Factor Indeterminacy. Foundations of Factor Analysis. 2nd Edition, Chapman and Hall/CRC, London, 369-404.
[12] Stricklin, M. (1996) PCQ: Factor Analysis Program for Q-Technique.
[13] Akhtar-Danesh, N. (2017) An Overview of the Statistical Techniques in Q-Metho- dology: Is There a Better Way of Doing Q-Analysis? Operant Subjectivity.
http://www.operantsubjectivity.org/pub/845
[14] Akhtar-Danesh, N. and Mirza, N. (2017) Relation between Manual Rotation and Abductive Reasoning in Q-Methodology. Open Journal of Social Sciences, 5, 198-
204.https://doi.org/10.4236/jss.2017.53017
[15] Gorsuch, R.L. (1983) Factor Analysis. Lawrence Erlbaum, Hillsdale.
[16] Hair, J.F., Anderson, R.E., Tatham, R.L. and Black, W.C. (1995) Multivariate Data Analysis with Readings. Prentice Hall, Englewood Cliffs.
[17] Schmolck, P. (2014) PQ Method Manual.
http://schmolck.userweb.mwn.de/qmethod/pqmanual.htm
Stu-dents. Western Journal of Nursing Research, 35, 248-271. https://doi.org/10.1177/0193945911408623
[19] Akhtar-Danesh, N., Dehghan, M., Morrison, K.M. and Fonseka, S. (2011) Parents' Perceptions and Attitudes on Childhood Obesity: A Q-Methodology Study. Journal
of the American Association of Nurse Practitioners, 23, 67-75.
https://doi.org/10.1111/j.1745-7599.2010.00584.x
[20] Landeen, J., Pierazzo, J., Akhtar-Danesh, N., Baxter, P., Van, E.S. and Evers, C. (2015) Exploring Student and Faculty Perceptions of Clinical Simulation: A Q-Sort Study. Journal of Nursing Education, 54, 485-491.
https://doi.org/10.3928/01484834-20150814-02
[21] Kline, P. (1994) An Easy Guide to Factor Analysis. Routledge, New York.
Submit or recommend next manuscript to SCIRP and we will provide best service for you:
Accepting pre-submission inquiries through Email, Facebook, LinkedIn, Twitter, etc. A wide selection of journals (inclusive of 9 subjects, more than 200 journals)
Providing 24-hour high-quality service User-friendly online submission system Fair and swift peer-review system
Efficient typesetting and proofreading procedure
Display of the result of downloads and visits, as well as the number of cited articles Maximum dissemination of your research work
Submit your manuscript at: http://papersubmission.scirp.org/