http://www.scirp.org/journal/ym ISSN Online: 2475-7349
ISSN Print: 2475-7330
Comparative Analysis of the Exon-Intron
Structure in Eukaryotic Genomes
Yongfa Li
1,2, Yanhua Xu
1,3, Zhaowu Ma
1,21The second School of Clinical Medicine, Yangtze University, Jingzhou, China
2Laboratory of Oncology, Center for Molecular Medicine, School of Medicine, Yangtze University, Jingzhou, China 3Department of Oncology, Central Hospital of Jingzhou, Jingzhou, China
Abstract
The exon numbers and lengths vary in different eukaryotic species. With in-creasing completed genomic sequences, it is indispensable to reanalyze the gene organization in diverse eukaryotic genomes. We performed a large-scale comparative analysis of the exon-intron structure in 72 eukaryotic organisms, including plants, fungi and animals. We confirmed that the exon-intron structure varies massively among eukaryotic genomes and revealed some li-neage-specific features of eukaryotic genes. These include a teleost-specific exon-intron structure pattern, relatively small introns and large exons in fungi and algae, and a gradual expansion of introns in vertebrates. Furthermore, the conservation analysis of exon-intron boundaries indicates that several bases near splice site junctions are different in introns with variable length among different species. After comparison, we identified a trend showing increases in intron densities and lengths in diverse species from fungi, plants, inverte-brates to verteinverte-brates, while it was the opposite in relation to exon lengths. The statistical properties of eukaryotic genomic organization suggest that ge-nome-specific features are preserved by diverse evolutionary processes, which paves way for further research on the diversification of eukaryotic evolution.
Keywords
Exon-Intron Structure, Eukaryotic Genome, Evolution
1. Introduction
A typical eukaryotic gene consists of multiple exons interrupted by introns and their numbers vary tremendously between eukaryotic species [1]. Introns are removed by RNA splicing while the final mature transcript product is being generated. Alternative splicing (AS) is a posttranscriptional process in
eukaryo-How to cite this paper: Li, Y.F., Xu, Y.H. and Ma, Z.W. (2017) Comparative Analysis of the Exon-Intron Structure in Eukaryotic Genomes. Yangtze Medicine, 1, 50-64. https://doi.org/10.4236/ym.2017.11006
Received: February 27, 2017 Accepted: March 27, 2017 Published: March 30, 2017
Copyright © 2017 by authors and Scientific Research Publishing Inc. This work is licensed under the Creative Commons Attribution International License (CC BY 4.0).
tic organisms by which multiple distinct transcripts are produced from a single gene [2]. Previous studies using high-throughput sequencing technology have reported that up to 92% - 94% of human multi-exon genes undergo AS [3][4], often in a tissue/developmental stage-specific manner [3][5]. The splice sites are recognized across a highly conserved region of nucleotides (nt) and the intron length significantly influences the efficiency of pre-mRNA splicing and alterna-tive splice site choice [6].
In vertebrates, there are relatively long introns and short exons, while it is in-verse in lower eukaryotes [7]. Comparative eukaryote genomics have suggested that intron evolution is a dynamic process in eukaryotes, and introns have been gained and lost in different genomes in response to strong selective pressures
[8]. Although the basic ability of eukaryotes to splice introns is conserved, the splicing signals are evolved and shaped to different splicing mechanisms in di-verse speciation [9][10]. A comparative analysis of the basic splicing signals in-dicated that short intron recognition was rather susceptible to evolutionary changes in eukaryotes, but the overall pattern of intron recognition was well conserved in mammals [11]. It is suggested that there is a species-specific associ-ation between the exon and intron length variassoci-ation in genomes. Roy et al. found that newly originated exons were more common within longer introns (>1000 nt) compared with short introns (<400 nt) in vertebrate genomes [12]. Large in-trons could be a reservoir of genetic diversity, and they can promote AS via ex-on-skipping and exon turnover during evolution [13]. The availability of ge-nomic sequences and annotations makes it feasible to examine many funda-mental evolutionary questions on the genome scale. The diversity of exon-intron structures among eukaryotic genomes makes them extremely attractive for ex-ploring questions of exon-intron structure evolution.
In this study, we performed a comprehensive survey of the exon-intron struc-ture in 72 eukaryotic organisms, including 17 plants, 11 fungi, 12 invertebrates and 32 vertebrates. Our results confirm that the lengths and numbers of introns vary among different eukaryotic genomes. Both general and genome-specific features of the exon-intron organization were found in eukaryotic genes. This statistical anal-ysis of the exon-intron structure revealed some diverse characteristics in eukaryo-tic genomes. These results may provide clues to elucidate mechanisms involved in the organization of eukaryotic genomes and also gene structure evolution.
2. Materials and Methods
2.1. Data Sources and Statistical Analysis
re-liable data, we applied the following relatively stringent criteria for the quality of the alignment. 1) The intron must be longer than 5 nt, as intron splicing requires a “minimum” of five nucleotides (GU-AG plus an A for the branch point) [14]. 2) For genes with many alternative splicing isoforms, we retained the isoform which produces the longest mRNA for statistical analysis.
2.2. Comparison of Exon-Intron Boundaries
In addition to the overall exon/intron numbers and lengths data created from the available sequences, we also obtained exon/intron boundary data for 6 or-ganisms; Homo sapiens, Danio rerio, Drosophila melanogaster, Caenorhabditis elegans, Saccharomyces cerevisiae and Arabidopsis thaliana. We constructed the motif profiles in these 6 representative species, using the extracted intron se-quences. Sequence motifs for 5’ splice site (5’ss) and 3’ splice site (3’ss) are de-picted as sequence logos by the WebLogo http://weblogo.berkeley.edu/. We also extracted the adjacent 10 nucleotides (nt) of the upstream and downstream of each splice site, and analyzed the conservation of 5’ss and 3’ss splice-site signals.
3. Results
3.1. Comparative Analysis of Eukaryotic Genes with Exons
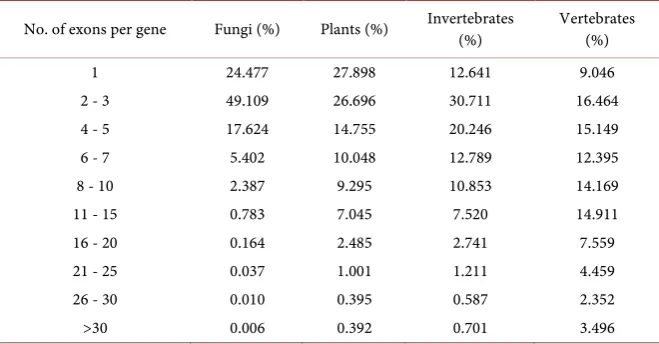
[image:3.595.208.538.560.732.2]A comprehensive survey of the 72 eukaryotic organisms shows that most euka-ryotic genes contain less than 5 exons across different groups. Basically, the ratio of gene numbers decreases as the exon number increases (Table 1). In summary, the proportion of genes containing one exon varies from 28% to 9% in four groups. In fungi, the percentage of genes with 1 - 5 exons is 91.21%, which indi-cates that fungal genes are simpler than the other groups. The percentages of genes with 1 - 5 exons in plants and invertebrates account for approximately two-thirds. On the contrary, of those genes that contain more than five exons, their proportions are incremental from fungi to vertebrates. An extreme case is that almost all genes in S. cerevisiae contain 1 - 5 exons (99.97%), compared with only 33.85% in meleagris (meleagris gallopavo, vertebrate)
Table 1. Comparative analysis of eukaryotic genes with exons.
No. of exons per gene Fungi (%) Plants (%) Invertebrates (%) Vertebrates (%)
1 24.477 27.898 12.641 9.046
2 - 3 49.109 26.696 30.711 16.464
4 - 5 17.624 14.755 20.246 15.149
6 - 7 5.402 10.048 12.789 12.395
8 - 10 2.387 9.295 10.853 14.169
11 - 15 0.783 7.045 7.520 14.911
16 - 20 0.164 2.485 2.741 7.559
21 - 25 0.037 1.001 1.211 4.459
26 - 30 0.010 0.395 0.587 2.352
(Table S2). Taken together, these results indicate that the genes have more ex-ons in vertebrates than in non-vertebrates.
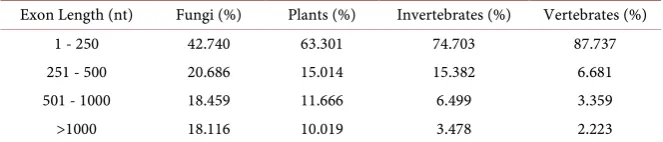
[image:4.595.207.539.660.731.2]3.2. Analysis of the Exon Length Distribution
Table 2 shows the varied distributions of exon length in the four groups. It is clear that short exons (<250 nt) are widespread across various eukaryotes. In fungi, the percentage of short exons is only 42.740% and the mean length of fungal exons is larger (589 nt) than in the other three groups (188 nt, 257 nt and 386 nt, respectively). In vertebrates, most of the exons (87.737%) are less than 250 nt in length (Table 2 and Table S1). The percentage of long exons (>500 nt) is 36.575% in fungi, while the corresponding proportions decrease from 21.685%, 9.977% to 5.582% in plants, invertebrates and vertebrates respectively. These re-sults indicate that exon lengths vary across the eukaryotic kingdom with more short exons in vertebrates.
3.3. Analysis of the Intron Characteristics
According to the data we used (Ensembl release 67), the human genome con-tains 20,687 protein coding genes with introns and 1713 (7%) intron-free pro-tein coding genes. Altogether, there are 200,220 introns in human propro-tein cod-ing genes, so the average number of introns per gene is 8.94 in human genome. The number of introns per gene varies dramatically among diverse eukaryotes, including fungi (0.05 - 3.43 introns per gene), plants (0.33 - 7.30 introns per gene), invertebrates (2.92 - 7.42 introns per gene) and vertebrates (7.35 - 10.09 introns per gene) (Table S1). This statistical analysis showed that there is a wide variety of intron-densities in eukaryotic genomes; complex genomic organiza-tions are much more common in the higher eukaryotes than lower eukaryotes.
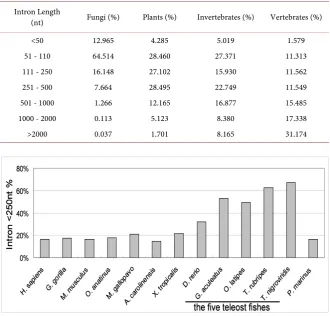
Consistent with other studies [15][16], our results show that abundant long introns are present in vertebrates. Approximately 48.512% of the introns in ver-tebrates are >1000 nt in length (Table 3). In general, fungal introns are relatively short, 93.627% of the introns in fungi are shorter than 250 nt. In invertebrates and plants, the average percentages of short introns (<250 nt) are 48.320% and 59.847% respectively. Exceptionally, there is a specific distribution of short in-trons in teleosts. The average length of inin-trons in teleost fishes was significantly smaller than that of other vertebrates. Furthermore, the percentage of short in-trons (<250 nt) is in the range of 32.17% - 67.06% (with an average of 52.89%) in the five teleost fishes, but only ~18% in all other vertebrates (Figure 1 and Table S1).
Table 2. Comparison of exon length among different species.
Exon Length (nt) Fungi (%) Plants (%) Invertebrates (%) Vertebrates (%)
1 - 250 42.740 63.301 74.703 87.737
251 - 500 20.686 15.014 15.382 6.681
501 - 1000 18.459 11.666 6.499 3.359
Table 3. Comparison of intron length among different species.
Intron Length
(nt) Fungi (%) Plants (%) Invertebrates (%) Vertebrates (%)
<50 12.965 4.285 5.019 1.579
51 - 110 64.514 28.460 27.371 11.313
111 - 250 16.148 27.102 15.930 11.562
251 - 500 7.664 28.495 22.749 11.549
501 - 1000 1.266 12.165 16.877 15.485
1000 - 2000 0.113 5.123 8.380 17.338
>2000 0.037 1.701 8.165 31.174
Figure 1. The distribution of short introns in teleosts and some representative verte-brates. The percentage of short introns (<250 nt) in the five teleost fishes is about twice of that in other vertebrates. H. sapiens: Human; G. gorilla: Gorilla; M. musculus: Mouse; O. anatinus: Platypus; M. gallopavo: Turkey; A. carolinensis: Anole lizard; X. tropicalis: Xe-nopus; D. rerio: Zebrafish; G. aculeatus: Stickleback; O. latipes: Medaka; T. rubripes: Fu-gu; T. nigroviridis: Tetraodon; P. marinus: Lamprey.
In all observed species, as an extreme example, the smallest percentage of short introns is only 5% in invertebrate (Strongylocentrotus purpuratus, sea urchin). However, the number of introns (157,214) in sea urchin is exceedingly large, which is about twice of other invertebrates (82,398). In the plant group the length of introns was small (183 nt) in three algae of Ostreococcus, with signifi-cantly smaller than the average value of other plants (329 nt), while exons were much larger (912 nt) than other plants (386 nt) (Table S1).
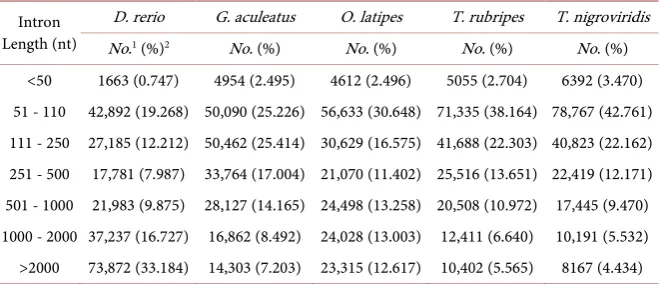
Table 4. Comparison of intron length among the teleost fishes.
Intron Length (nt)
D. rerio G. aculeatus O. latipes T. rubripes T. nigroviridis
No.1 (%)2 No. (%) No. (%) No. (%) No. (%)
<50 1663 (0.747) 4954 (2.495) 4612 (2.496) 5055 (2.704) 6392 (3.470) 51 - 110 42,892 (19.268) 50,090 (25.226) 56,633 (30.648) 71,335 (38.164) 78,767 (42.761) 111 - 250 27,185 (12.212) 50,462 (25.414) 30,629 (16.575) 41,688 (22.303) 40,823 (22.162) 251 - 500 17,781 (7.987) 33,764 (17.004) 21,070 (11.402) 25,516 (13.651) 22,419 (12.171) 501 - 1000 21,983 (9.875) 28,127 (14.165) 24,498 (13.258) 20,508 (10.972) 17,445 (9.470) 1000 - 2000 37,237 (16.727) 16,862 (8.492) 24,028 (13.003) 12,411 (6.640) 10,191 (5.532) >2000 73,872 (33.184) 14,303 (7.203) 23,315 (12.617) 10,402 (5.565) 8167 (4.434) 1No.: Number of introns; 2(%): The percentage of introns.
3.4. Comparative Analysis of Exon-Intron Boundaries in
Eukaryotes
We analyzed the classical splicing signal motifs for each organism. The results of six representative species from four groups (H. sapiens, D. rerio, D. melanogas-ter, C. elegans, S. cerevisiae and A. thaliana) reveal well-known highly conserved motif profiles for introns within the range 51 - 70 nt (Figure 2) and longer. Al-though resembling one another, the motif profiles exhibit some differences and specificities among different species. The adjacent nucleotides around each splice site are far from random. They comprise two distinguished consensus se-quences of the 5’ splice site (5’ss) and the 3’ splice site (3’ss) on the exon-intron boundaries [20]. The conservation of the 5’ss and 3’ss is lower in zebrafish and human than in the other species (Figure 2). For the introns with length in 6 - 50 nt, the splice sites are not conserved in yeast, zebrafish and human (Figure S2). Many eukaryotic genomic architectures are typified by small exons and flanking introns with variable length. Splice site recognition is more efficient when in-trons or exons are small, which appears to favor diverse splicing factors for al-ternative splicing [21].
4. Discussion
This work involves statistical analysis of the exon-intron structure in a large number of eukaryotes. We performed detailed comparisons of the exon-intron structures and revealed some complex characteristics of eukaryotic genomes. The exon-intron structures of eukaryote genes vary across the eukaryotic king-dom, and the evolution of such structures increases in complexity from lower eukaryotes to higher eukaryotes. Our observations are largely consistent with and reinforce those reported previously with respect to introns and exons [9] [17][22].
4.1. An Increasing Complexity of Exon-Intron Structures in
Eukaryotic Evolution
Figure 2. Acomparison of splicing signal motifs in six species for 51 - 70 nt introns. Se-quence motifs for 5’ss and 3’ss are depicted as seSe-quence logos.
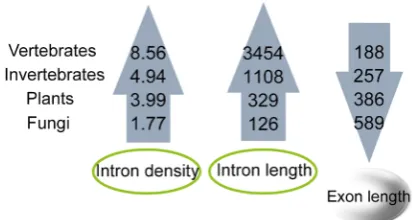
intron densities and lengths in species from fungi, plants, invertebrates to verte-brates. The trend is inverse in relation to exon lengths (Figure 3).
Intron sizes vary widely within each group (fungi, plants, invertebrates and vertebrates). In contrast to intron length, the average lengths of exons are more similar in each group. An increasing body of evidence indicates that introns play a number of functional roles. Many introns contain functional non-coding RNAs, which play vital roles in fine-tuning gene expression [23]. Intron length appears to be positively correlated with expression in unicellular eukaryotes and negatively correlated with expression in multicellular eukaryotes [24]. Further-more, it is a negative correlation between intron size and the level of expression of genes in nematodes and humans, which suggests that natural selection favors short introns in highly expressed genes to minimize the cost of transcription
Figure 3. Trends of exon/intron length and density in eukaryotes.
cycles [8]. This might be a result of selection for rapid cell division or gene ex-pression.
The exon-intron architecture has also been shown to influence splice-site rec-ognition. The splice-site recognition is more efficient when introns or exons are small [21][26]. Lower eukaryotes have a genomic architecture that is typified by small introns and flanking exons with variable lengths, suggesting that splice-site recognition occurs across the intron [27]. Our analysis showed some small in-trons and large exons in most fungi and some algae, which is consistent with a previous report [21]. Jeffares et al. proposed that some genes are apparently un-der selective pressure to minimize introns [8]. As an example, the average intron size is only 124 bp in Ostreococcus tauri, which is the world’s smallest free-living eukaryote known to date [28]. It is a plausiblestrategy that green alga could se-lect small introns to economize energetic cost from decreased transcript length, adapting changing marine environment to bypass the constraints imposed by light or nutrient limitation [29].
4.2. A Lineage-Specific Exon-Intron Structure in Teleosts
4.3. Abundance of Introns Are the Reservoir of AS Patterns in
Eukaryotes
Our analysis showed that introns are arranged non-randomly in diverse euka-ryotes. The vertebrate genes are typically split into numerous small exons inter-rupted by much larger introns. In our statistical analysis, there are relatively long introns and short exons in 32 vertebrate species. It is a trend that intron length has gradually expanded in fish, amphibians, reptiles, aves and mammals (Table S1). Our analysis suggests that vertebrate introns increased in length during ver-tebrate evolution. Previous studies indicated that intron length has gradually expanded among mammals, whereas the length of exons has remained relatively constant [34]. Some findings have led to speculations that the spliceosome in mammals recognizes primarily the exons in a process termed exon definition, as opposed to that in fungi where introns are kept short and are thought to be the recognized unit in a process termed intron definition [34][35].
Intron and exon lengths can reflect the constraints imposed by splicing recog-nition, based on whether the exon is identified through the intron or exon defi-nition mechanism. A large number of long introns could be a reservoir of genet-ic diversity in vertebrates, and they can facilitate the selection of different splgenet-ic- splic-ing factors for AS dursplic-ing evolution. Different intron lengths are associated with different types of AS [36]. Long introns could hinder the activity of the splice-some through interfering with the proper positioning of the splicesplice-some upon exon-intron junctions [36]. Short introns tend to flank weak splice sites and long introns tend to flank exons with strong splice sites [16][37]. AS is more abun-dant in higher eukaryotes than in lower eukaryotes, and the percentage of genes that undergo AS is higher in vertebrates than in invertebrates [7]. Recently, a genome-wide investigation of AS profiles across organs and species in vertebrate species, suggested that AS changes may be a driving force towards an increase in cellular complexity during vertebrate speciation [38]. However, a latest research corroborated that boundary shifts and complete intron sliding are only acciden-tal in eukaryotic genome evolution [39]. The number of introns in vertebrates is more than in the other lineages, so it is reasonable to assume that the prevalence of AS in vertebrates is pivotal for their higher phenotypic complexity [40].
Overall, our results show both general and genome-specific features of the exon-intron structures of eukaryotic genes. The evolution of exon-intron struc-tures increases in complexity from lower eukaryotes to higher eukaryotes. Some species-specific characteristics of genomes were found in many teleosts and lower eukaryotes. This re-analysis of eukaryotic genomic organization revealed some lineage-specific characteristics of exons and introns, which paves way for further research on the conservation and diversification of eukaryotic evolution.
Acknowledgements
References
[1] Roy, S.W. and Gilbert, W. (2006) The Evolution of Spliceosomal Introns: Patterns, Puzzles and Progress. Nature Reviews Genetics, 7, 211-221.
https://doi.org/10.1038/nrg1807
[2] Graveley, B.R. (2001) Alternative Splicing: Increasing Diversity in the Proteomic World. Trends in Genetics, 17, 100-107.
https://doi.org/10.1016/S0168-9525(00)02176-4
[3] Wang, E.T., Sandberg, R., Luo, S., Khrebtukova, I., Zhang, L., Mayr, C., Kingsmore, S.F., Schroth, G.P. and Burge, C.B. (2008) Alternative Isoform Regulation in Human Tissue Transcriptomes. Nature, 456, 470-476. https://doi.org/10.1038/nature07509
[4] Pan, Q., Shai, O., Lee, L.J., Frey, B.J. and Blencowe, B.J. (2008) Deep Surveying of Alternative Splicing Complexity in the Human Transcriptome by High-Throughput Sequencing. Nature Genetics, 40, 1413-1415. https://doi.org/10.1038/ng.259
[5] Stamm, S., Ben-Ari, S., Rafalska, I., Tang, Y., Zhang, Z., Toiber, D., Thanaraj, T.A. and Soreq, H. (2005) Function of Alternative Splicing. Gene, 344, 1-20.
[6] Hertel, K.J. (2008) Combinatorial Control of Exon Recognition. The Journal of Bi-ological Chemistry, 283, 1211-1215. https://doi.org/10.1074/jbc.R700035200
[7] Keren, H., Lev-Maor, G. and Ast, G. (2010) Alternative Splicing and Evolution: Di-versification, Exon Definition and Function. Nature Reviews Genetics, 11, 345-355.
https://doi.org/10.1038/nrg2776
[8] Jeffares, D.C., Mourier, T. and Penny, D. (2006) The Biology of Intron Gain and Loss. Trends in Genetics, 22, 16-22. https://doi.org/10.1016/j.tig.2005.10.006
[9] Schwartz, S.H., Silva, J., Burstein, D., Pupko, T., Eyras, E. and Ast, G. (2008) Large- Scale Comparative Analysis of Splicing Signals and Their Corresponding Splicing Factors in Eukaryotes. Genome Research, 18, 88-103.
https://doi.org/10.1101/gr.6818908
[10] Sheth, N., Roca, X., Hastings, M.L., Roeder, T., Krainer, A.R. and Sachidanandam, R. (2006) Comprehensive Splice-Site Analysis Using Comparative Genomics.
Nucleic Acids Research, 34, 3955-3967.
[11] Iwata, H. and Gotoh, O. (2011) Comparative Analysis of Information Contents Re-levant to Recognition of Introns in Many Species. BMC Genomics, 12, 45.
https://doi.org/10.1186/1471-2164-12-45
[12] Roy, M., Kim, N., Xing, Y. and Lee, C. (2008) The Effect of Intron Length on Exon Creation Ratios during the Evolution of Mammalian Genomes. RNA, 14, 2261- 2273. https://doi.org/10.1261/rna.1024908
[13] Kandul, N.P. and Noor, M.A. (2009) Large Introns in Relation to Alternative Splic-ing and Gene Evolution: A Case Study of Drosophila Bruno-3. BMC Genetics, 10,
67. https://doi.org/10.1186/1471-2156-10-67
[14] Moss, S.P., Joyce, D.A., Humphries, S., Tindall, K.J. and Lunt, D.H. (2011) Com-parative Analysis of Teleost Genome Sequences Reveals an Ancient Intron Size Ex-pansion in the Zebrafish Lineage. Genome Biology and Evolution, 3, 1187-1196.
https://doi.org/10.1093/gbe/evr090
[15] Gelfman, S., Burstein, D., Penn, O., Savchenko, A., Amit, M., Schwartz, S., Pupko, T. and Ast, G. (2012) Changes in Exon-Intron Structure during Vertebrate Evolu-tion Affect the Splicing Pattern of Exons. Genome Research, 22, 35-50.
https://doi.org/10.1101/gr.119834.110
[17] Deutsch, M. and Long, M. (1999) Intron-Exon Structures of Eukaryotic Model Or-ganisms. Nucleic Acids Research, 27, 3219-3228.
https://doi.org/10.1093/nar/27.15.3219
[18] Bon, E., Casaregola, S., Blandin, G., Llorente, B., Neuveglise, C., Munsterkotter, M., Guldener, U., Mewes, H.W., Van Helden, J., Dujon, B. and Gaillardin, C. (2003) Molecular Evolution of Eukaryotic Genomes: Hemiascomycetous Yeast Spliceo-somal Introns. Nucleic Acids Research, 31, 1121-1135.
https://doi.org/10.1093/nar/gkg213
[19] Rodriguez-Medina, J.R. and Rymond, B.C. (1994) Prevalence and Distribution of Introns in Non-Ribosomal Protein Genes of Yeast. Molecular and General Genetics MGG, 243, 532-539. https://doi.org/10.1007/BF00284201
[20] Patel, A.A. and Steitz, J.A. (2003) Splicing Double: Insights from the Second Spli-ceosome. Nature Reviews Molecular Cell Biology, 4, 960-970.
https://doi.org/10.1038/nrm1259
[21] Sterner, D.A., Carlo, T. and Berget, S.M. (1996) Architectural Limits on Split Genes.
Proceedings of the National Academy of Sciences of the United States of America, 93, 15081-15085. https://doi.org/10.1073/pnas.93.26.15081
[22] Lim, L.P. and Burge, C.B. (2001) A Computational Analysis of Sequence Features Involved in Recognition of Short Introns. Proceedings of the National Academy of Sciences of the United States of America, 98, 11193-11198.
https://doi.org/10.1073/pnas.201407298
[23] Rearick, D., Prakash, A., McSweeny, A., Shepard, S.S., Fedorova, L. and Fedorov, A. (2011) Critical Association of ncRNA with Introns. Nucleic Acids Research, 39, 2357-2366. https://doi.org/10.1093/nar/gkq1080
[24] Vinogradov, A.E. (2001) Intron Length and Codon Usage. Journal of Molecular Evolution, 52, 2-5. https://doi.org/10.1007/s002390010128
[25] Castillo-Davis, C.I., Mekhedov, S.L., Hartl, D.L., Koonin, E.V. and Kondrashov, F.A. (2002) Selection for Short Introns in Highly Expressed Genes. Nature Genetics, 31, 415-418. https://doi.org/10.1038/ng940
[26] Berget, S.M. (1995) Exon Recognition in Vertebrate Splicing. The Journal of Bio-logical Chemistry, 270, 2411-2414. https://doi.org/10.1074/jbc.270.6.2411
[27] Ruby, S.W. and Abelson, J. (1991) Pre-mRNA Splicing in Yeast. Trends in Genetics, 7, 79-85.
[28] Derelle, E., Ferraz, C., Rombauts, S., Rouze, P., Worden, A.Z., Robbens, S., Par-tensky, F., Degroeve, S., Echeynie, S., Cooke, R., Saeys, Y., Wuyts, J., Jabbari, K., Bowler, C., Panaud, O., Piegu, B., et al. (2006) Genome Analysis of the Smallest Free-Living Eukaryote Ostreococcus tauri Unveils Many Unique Features. Pro-ceedings of the National Academy of Sciences of the United States of America, 103, 11647-11652. https://doi.org/10.1073/pnas.0604795103
[29] Cardol, P., Bailleul, B., Rappaport, F., Derelle, E., Beal, D., Breyton, C., Bailey, S., Wollman, F.A., Grossman, A., Moreau, H. and Finazzi, G. (2008) An Original Adaptation of Photosynthesis in the Marine Green Alga Ostreococcus. Proceedings of the National Academy of Sciences of the United States of America, 105, 7881- 7886. https://doi.org/10.1073/pnas.0802762105
[30] Lander, E.S., Linton, L.M., Birren, B., Nusbaum, C., Zody, M.C., Baldwin, J., Devon, K., Dewar, K., Doyle, M., FitzHugh, W., Funke, R., Gage, D., Harris, K., Heaford, A., Howland, J., Kann, L., et al. (2001) Initial Sequencing and Analysis of the Hu-man Genome. Nature, 409, 860-921. https://doi.org/10.1038/35057062
Human Genome. Science, 291, 1304-1351. https://doi.org/10.1126/science.1058040
[32] Meyer, A. and Van de Peer, Y. (2005) From 2R to 3R: Evidence for a Fish-Specific Genome Duplication (FSGD). BioEssays, 27, 937-945.
https://doi.org/10.1002/bies.20293
[33] Shepard, S., McCreary, M. and Fedorov, A. (2009) The Peculiarities of Large Intron Splicing in Animals. PLoS ONE, 4, e7853.
https://doi.org/10.1371/journal.pone.0007853
[34] Schwartz, S. and Ast, G. (2010) Chromatin Density and Splicing Destiny: On the Cross-Talk between Chromatin Structure and Splicing. The EMBO Journal, 29, 1629-1636. https://doi.org/10.1038/emboj.2010.71
[35] Ast, G. (2004) How Did Alternative Splicing Evolve? Nature Reviews Genetics, 5, 773-782. https://doi.org/10.1038/nrg1451
[36] Kim, E., Magen, A. and Ast, G. (2007) Different Levels of Alternative Splicing among Eukaryotes. Nucleic Acids Research, 35, 125-131.
https://doi.org/10.1093/nar/gkl924
[37] Weir, M. and Rice, M. (2004) Ordered Partitioning Reveals Extended Splice-Site Consensus Information. Genome Research, 14, 67-78.
https://doi.org/10.1101/gr.1715204
[38] Barbosa-Morais, N.L., Irimia, M., Pan, Q., Xiong, H.Y., Gueroussov, S., Lee, L.J., Slobodeniuc, V., Kutter, C., Watt, S., Colak, R., Kim, T., Misquitta-Ali, C.M., Wil-son, M.D., Kim, P.M., Odom, D.T., Frey, B.J., et al. (2012) The Evolutionary Land-scape of Alternative Splicing in Vertebrate Species. Science, 338, 1587-1593.
https://doi.org/10.1126/science.1230612
[39] Bocco, S.S. and Csűrös, M. (2016) Splice Sites Seldom Slide: Intron Evolution in Oomycetes. Genome Biology and Evolution, 8, 2340-2350.
https://doi.org/10.1093/gbe/evw157
[40] Kornblihtt, A.R., Schor, I.E., Allo, M., Dujardin, G., Petrillo, E. and Munoz, M.J. (2013) Alternative Splicing: A Pivotal Step between Eukaryotic Transcription and Translation. Nature Reviews Molecular Cell Biology, 14, 153-165.
Appendix
Figure S1.The distribution of intron length in the five teleost species.
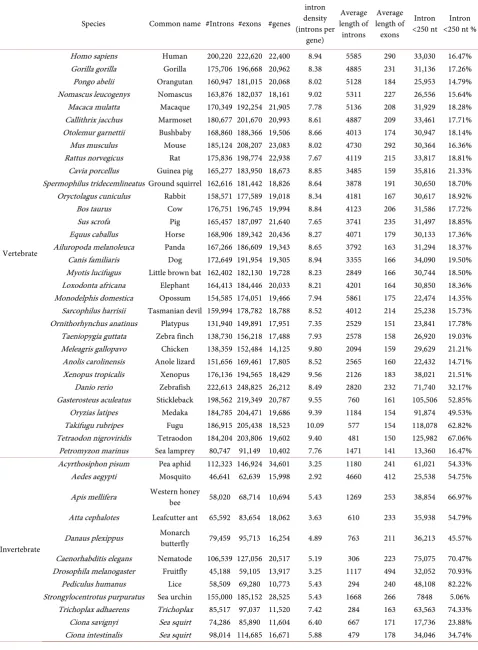
[image:13.595.209.525.264.633.2]Table S1. Synopsis of 72 genomes analyzed.
Species Common name #Introns #exons #genes
intron density (introns per
gene)
Average length of introns
Average length of
exons
Intron
<250 nt <250 nt % Intron
Vertebrate
Homo sapiens Human 200,220 222,620 22,400 8.94 5585 290 33,030 16.47% Gorilla gorilla Gorilla 175,706 196,668 20,962 8.38 4885 231 31,136 17.26% Pongo abelii Orangutan 160,947 181,015 20,068 8.02 5128 184 25,953 14.79% Nomascus leucogenys Nomascus 163,876 182,037 18,161 9.02 5311 227 26,556 15.64% Macaca mulatta Macaque 170,349 192,254 21,905 7.78 5136 208 31,929 18.28% Callithrix jacchus Marmoset 180,677 201,670 20,993 8.61 4887 209 33,461 17.71% Otolemur garnettii Bushbaby 168,860 188,366 19,506 8.66 4013 174 30,947 18.14% Mus musculus Mouse 185,124 208,207 23,083 8.02 4730 292 30,364 16.36% Rattus norvegicus Rat 175,836 198,774 22,938 7.67 4119 215 33,817 18.81% Cavia porcellus Guinea pig 165,277 183,950 18,673 8.85 3485 159 35,816 21.33% Spermophilus tridecemlineatus Ground squirrel 162,616 181,442 18,826 8.64 3878 191 30,650 18.70% Oryctolagus cuniculus Rabbit 158,571 177,589 19,018 8.34 4181 167 30,617 18.92%
Bos taurus Cow 176,751 196,745 19,994 8.84 4123 206 31,586 17.72%
Sus scrofa Pig 165,457 187,097 21,640 7.65 3741 235 31,497 18.85%
Equus caballus Horse 168,906 189,342 20,436 8.27 4071 179 30,133 17.36% Ailuropoda melanoleuca Panda 167,266 186,609 19,343 8.65 3792 163 31,294 18.37% Canis familiaris Dog 172,649 191,954 19,305 8.94 3355 166 34,090 19.50% Myotis lucifugus Little brown bat 162,402 182,130 19,728 8.23 2849 166 30,744 18.50% Loxodonta africana Elephant 164,413 184,446 20,033 8.21 4201 164 30,850 18.36% Monodelphis domestica Opossum 154,585 174,051 19,466 7.94 5861 175 22,474 14.35% Sarcophilus harrisii Tasmanian devil 159,994 178,782 18,788 8.52 4012 214 25,238 15.73% Ornithorhynchus anatinus Platypus 131,940 149,891 17,951 7.35 2529 151 23,841 17.78% Taeniopygia guttata Zebra finch 138,730 156,218 17,488 7.93 2578 158 26,920 19.03% Meleagris gallopavo Chicken 138,359 152,484 14,125 9.80 2094 159 29,629 21.21% Anolis carolinensis Anole lizard 151,656 169,461 17,805 8.52 2565 160 22,432 14.71% Xenopus tropicalis Xenopus 176,136 194,565 18,429 9.56 2126 183 38,021 21.51% Danio rerio Zebrafish 222,613 248,825 26,212 8.49 2820 232 71,740 32.17% Gasterosteus aculeatus Stickleback 198,562 219,349 20,787 9.55 760 161 105,506 52.85% Oryzias latipes Medaka 184,785 204,471 19,686 9.39 1184 154 91,874 49.53% Takifugu rubripes Fugu 186,915 205,438 18,523 10.09 577 154 118,078 62.82% Tetraodon nigroviridis Tetraodon 184,204 203,806 19,602 9.40 481 150 125,982 67.06% Petromyzon marinus Sea lamprey 80,747 91,149 10,402 7.76 1471 141 13,360 16.47%
Invertebrate
Acyrthosiphon pisum Pea aphid 112,323 146,924 34,601 3.25 1180 241 61,021 54.33% Aedes aegypti Mosquito 46,641 62,639 15,998 2.92 4660 412 25,538 54.75%
Apis mellifera Western honey bee 58,020 68,714 10,694 5.43 1269 253 38,854 66.97%
Atta cephalotes Leafcutter ant 65,592 83,654 18,062 3.63 610 233 35,938 54.79%
Danaus plexippus Monarch butterfly 79,459 95,713 16,254 4.89 763 211 36,213 45.57%
Caenorhabditis elegans Nematode 106,539 127,056 20,517 5.19 306 223 75,075 70.47% Drosophila melanogaster Fruitfly 45,188 59,105 13,917 3.25 1117 494 32,052 70.93% Pediculus humanus Lice 58,509 69,280 10,773 5.43 294 240 48,108 82.22% Strongylocentrotus purpuratus Sea urchin 155,000 185,152 28,525 5.43 1668 266 7848 5.06%
Continued
Fungus
Aspergillus fumigatusa1163 Aspergillus 19,138 29,054 9916 1.93 80 496 18,654 97.47% Fusarium oxysporum Ascomycete 30,152 47,848 17,696 1.70 101 498 27,878 92.46% Gaeumannomyces graminis Take-all fungus 24,097 38,286 14,189 1.70 134 652 21,568 89.50% Gibberella moniliformis Gibberella 25,258 39,424 14,166 1.78 96 519 23,581 93.36% Magnaporthe oryzae Rice blast fungus 22,390 34,983 12,593 1.78 122 655 20,593 91.97% Mycosphaerella graminicola Filamentous fungus 17,616 28,547 10,931 1.61 135 530 15,739 89.34% Nectria haematococca Fusarium solani 32,675 48,380 15,705 2.08 82 488 31,528 96.49% Neurospora crassa Fusarium solani 17,113 26,933 9820 1.74 136 559 14,958 87.41% Phaeosphaeria nodorum Fusarium solani 20,609 33,000 12,391 1.66 91 495 19,455 94.40% Puccinia graminis Stem rust 54,258 70,058 15,800 3.43 101 308 52,699 97.13%
Saccharomyces cerevisiae Yeast 313 7005 6692 0.05 313 1284 166 53.04%
Plant
Arabidopsis lyrata Arabidopsis 141,168 174,181 32,670 4.32 396 223 118,348 83.83% Arabidopsis thaliana Arabidopsis 118,104 145,520 27,416 4.31 164 279 99,948 84.63% Brachypodium distachyon Purple false brome 110,080 136,632 26,552 4.15 487 301 67,409 61.24% Chlamydomonas reinhardtii Chlamydomonas 106,451 123,172 16,706 6.37 334 240 59,676 56.06% Chlorella NC64A Green alga 71,514 81,306 9791 7.30 207 170 60,455 84.54% Coccomyxa sp. C-169 Microalga 68,367 78,362 9994 6.84 295 177 34,299 50.17% Glycine max Soybean 231,716 278,083 46,430 4.99 638 258 76,072 32.83% Micromonas pusilla
CCMP1545 Micromonas Micromonas 9331 19,998 10,545 0.88 185 745 8142 87.26% Mimulus guttatus Monkey-flower 137,422 164,923 27,501 5.00 434 201 54,600 39.73% Ostreococcus lucimarinus
CCE9901 Green alga 17,571 70,854 53,282 0.33 219 1047 14,292 81.34% Ostreococcus sp. RCC809 Green alga 2845 10,337 7492 0.38 204 938 2300 80.84% Ostreococcus tauri Green alga 4382 12,107 7725 0.57 124 750 3977 90.76% Physcomitrella patens subsp.
patens Moss 139,017 174,956 35,938 3.87 309 246 85,801 61.72%
[image:15.595.56.539.529.729.2]Ricinus communis Castorbean 98,070 129,291 31,221 3.14 565 242 33,252 33.91% Selaginella moellendorffii Spikemoss 164,972 199,675 34,697 4.75 101 214 157,004 95.17% Sorghum bicolor Sorghum 130,409 164,964 34,496 3.78 425 297 83,573 64.09% Volvox carteri Green alga 105,443 120,987 15,544 6.78 507 236 32,440 30.77%
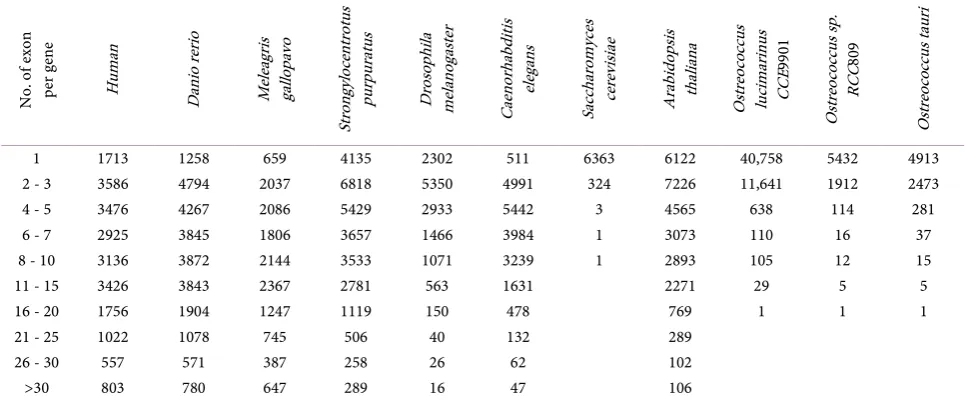
Table S2. Comparative analysis of eukaryotic genes with exons in some representative species.
N o. of ex on per gen e Hu m an D an io re rio M eleagr is gal lo pav o Str on gy lo ce ntr otu s pur pur at us D ros oph ila m elan ogas ter Caen or hab di tis elegan s Sa cc ha ro m yc es cer ev isi ae Ar ab ido ps is th alia na O str eo co ccu s lu cim ar in us CCE 99 01 O str eo co ccu s s p. RC C8 09 O str eo co ccu s ta ur i
1 1713 1258 659 4135 2302 511 6363 6122 40,758 5432 4913
2 - 3 3586 4794 2037 6818 5350 4991 324 7226 11,641 1912 2473
4 - 5 3476 4267 2086 5429 2933 5442 3 4565 638 114 281
6 - 7 2925 3845 1806 3657 1466 3984 1 3073 110 16 37
8 - 10 3136 3872 2144 3533 1071 3239 1 2893 105 12 15
11 - 15 3426 3843 2367 2781 563 1631 2271 29 5 5
16 - 20 1756 1904 1247 1119 150 478 769 1 1 1
21 - 25 1022 1078 745 506 40 132 289
26 - 30 557 571 387 258 26 62 102
Submit or recommend next manuscript to SCIRP and we will provide best service for you:
Accepting pre-submission inquiries through Email, Facebook, LinkedIn, Twitter, etc. A wide selection of journals (inclusive of 9 subjects, more than 200 journals)
Providing 24-hour high-quality service User-friendly online submission system Fair and swift peer-review system
Efficient typesetting and proofreading procedure
Display of the result of downloads and visits, as well as the number of cited articles Maximum dissemination of your research work
Submit your manuscript at: http://papersubmission.scirp.org/