Towards the 3D Web with Open Simulator
Iain Oliver
∗, Alan Miller
∗, Colin Allison
∗, Sarah Kennedy
∗,
Lisa Dow
∗, Anne Campbell
∗Chris Davies
∗, and John McCaffery
∗∗Computer Science, University of St Andrews
Abstract—Continuing advances and reduced costs in com-putational power, graphics processors and network bandwidth have led to 3D immersive multi-user virtual worlds becoming increasingly accessible while offering an improved and engaging Quality of Experience. At the same time the functionality of the World Wide Web continues to expand alongside the computing infrastructure it runs on and pages can now routinely accom-modate many forms of interactive multimedia components as standard features - streaming video for example. Inevitably there is an emerging expectation that the Web will expand further to incorporate immersive 3D environments. This is exciting because humans are well adapted to operating in 3D environments and it is challenging because existing software and skill sets are focused around competencies in 2D Web applications. Open Simulator (OpenSim) is a freely available open source tool-kit that empowers users to create and deploy their own 3D environments in the same way that anyone can create and deploy a Web site. Its characteristics can be seen as a set of references as to how the 3D Web could be instantiated. This paper describes experiments carried out with OpenSim to better understand network and system issues, and presents experience in using OpenSim to develop and deliver applications for education and cultural heritage. Evaluation is based upon observations of these applications in use and measurements of systems both in the lab and in the wild.
Index Terms—Open Virtual Worlds, Quality of Experience, 3D Web, System Evaluation, Experiential Learning
I. INTRODUCTION
The support for 3D graphical applications offered by today’s computing infrastructure makes the extension of the Web to include immersive environments possible in practice. In the immersive 3D Web users are a hyper-link away from an experience such as: diving to the depths of the ocean to an underwater observatory; travelling back in time 600 years to witness an ancient cathedral in its prime; defining their own computer network and experimenting with traffic flows or simply enjoying an immersive art exhibition. Virtual Worlds are arguably the best pointers we have to the likely nature of the technologies which will evolve into the immersive 3D Web. While Second Life (SL) made a major impact in this area when it was deployed as a commercial service in 2003 it has subsequently become clear that SL’s centralised service model has become a barrier to it evolving into the 3D web.
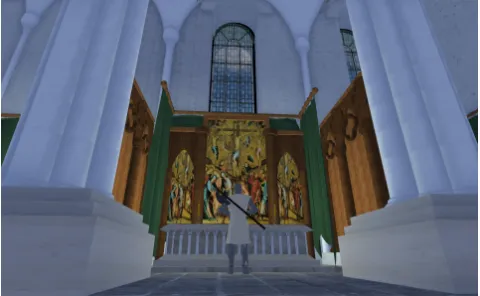
[image:1.612.318.558.162.310.2]The Open Simulator project (OpenSim) [1] in contrast is a freely available open source tool-kit that empowers users to create and deploy their own immersive 3D environments in ways that are directly analogous to how Web sites are created and deployed. OpenSim uses SL’s messaging protocols and is compatible with clients such as Firestorm, Impudence and Dolphin. OpenSim offers a natural progression from
Fig. 1. Robert the Bruce in the Trancept of St Andrews Cathedral in 1318
a closed centralised system to the concept of Open Vir-tual Worlds (OVW). So, while a VirVir-tual World provides a persistent, mutable, programmable, shared 3D environment, which is dynamically loaded and users explore through the proxy of avatars, an OVW has all these features but extends user control in four ways: individuals and organisations may provide their own VW services; clients and servers are open to customisation and extension; protocols are open standards so heterogeneous clients and servers can inter-operate; and users may move easily between OVWs in a similar way to following hyper-links [2] on the Web. OpenSim is very much focused on the idea of the 3D Web: OpenSimulator lacks support for many of the game-specific features of Second Life (on purpose), while pursuing innovative directions towards becoming the bare bones, but extensible, server of the 3D Web1. Emerging standard efforts support interoperability of virtual worlds2.
The contributions of the work reported in this paper lie in advancing our understanding of immersive environments through the following activities:
1) Deployment of applications demonstrating the functional contribution OVW technology offers in extending the Web.
2) Discovering the relationship between Quality of Experi-ence (QoE), Quality of Service (QoS) and the efficient use of system resources.
3) Experience in the applying of OVW technology to support deployment in heterogeneous contexts.
1http://www.opensimulator.org
2these include MPEG-V http://wg11.sc29.org/mpegv/ [3] and the IEEE
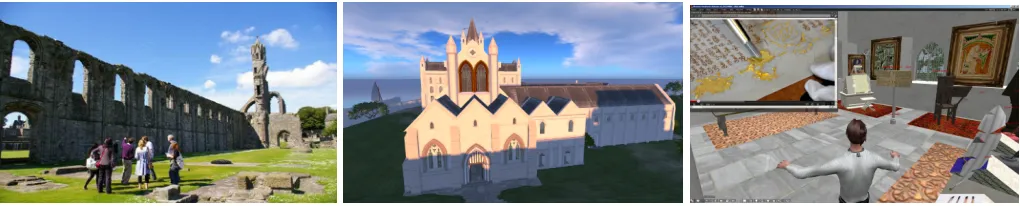
Fig. 2. St Andrews Cathedral initial site visit. Fig. 3. Cathedral as consecrated in 1318. Fig. 4. Virtual Exhibition: Books in the Cathedral.
This paper is organised into the following sections:
Applications and Use Cases. The functionality supported
by the immersive web is illustrated through the introduction of several OVW exemplar applications.
Architecture and Interfaces. An overview of the
architec-tures supported by OpenSim systems and the range of deploy-ment scenarios is given. A brief decomposition of components that make up the OpenSim ecosystem is also provided.
User Quality of Experience.A basic taxonomy of the factors
which impact upon a user’s QoE is developed.
System Quality of Service.A measurement infrastructure is
described which utilises client, server and network measure-ments to build up an holistic understanding of the performance of virtual world applications. Quantitative measurements are presented which illuminate the relationship between user QoE and system QoS.
In the Wild. Experience of using OVW applications in
schools, universities and exhibition centres is presented.
II. APPLICATIONS ANDUSECASES
Users access an OpenSim virtual world through a client analogous to a web browser. At the heart of an OpenSim application is a 3D environment, which users explore through the proxy of an avatar. Unlike web pages the user has presence. Other users are able to see an avatar’s actions and communi-cate in various ways including gestures, instant messaging and voice audio. This projection of presence enables collaborative activities.
OpenSim has sufficient flexibility to support a wide range of immersive 3D applications. This is illustrated here by outlining some of the virtual world resources hosted on the
apollo opensim server3. Apollo is used primarily to provide
a virtual world service for educational and cultural heritage applications. Resources from the fields of education, computer networking and cultural heritage include: Routing Island, St Andrews Cathedral, Linlithgow Palace, Further Away and Salt Pans.
Routing Island is an educational resource about Internet routing. It consists of a museum, lecture theatre, document repository and a routing simulator. The buildings contain links to on-line resources including videos, web pages and standards documents that are displayed in-world, in 3D structures. The
3the URI is: apollo.cs.st-andrews.ac.uk:8002 and accounts may be created
at openvirtualworlds.org/Cathedral
simulator allows students to set up networks consisting of routers, end-points and a choice of routing algorithm (link-state or distance vector) and instigate flows of data across them. The flow of packets and the dynamic updates to the forwarding table at each router are animated and students may change the topology or adjust data flows during a simulation. Linlithgow Palace was a residence of the Stuart Kings of Scotland and St Andrews Cathedral was the largest religious building in Scotland and the centre of religious life for some four hundred years between 1160 and 1560. Reconstructions of St Andrews Cathedral [4], [5] and Linlithgow Palace have been developed. They are based on the best available evidence, and are the product of collaborative projects between historians, archaeologists [6] and computer scientists.
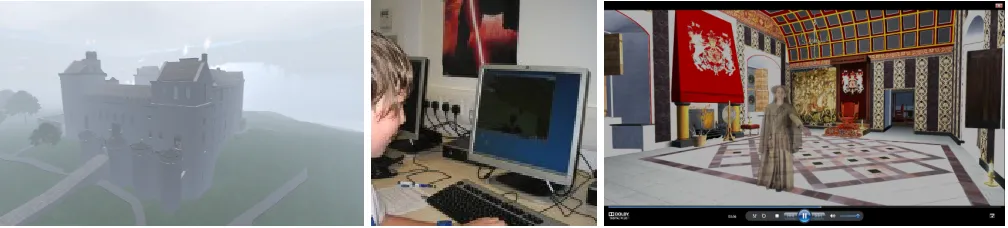
Figures 2, 3 and 4 show St Andrews Cathedral today; a view of the reconstruction circa 1318 AD and an interactive medieval book exhibition located within the Cathedral. Virtual visitors explore the buildings’ architecture, interact with his-toric characters and engage with virtual exhibitions situated within appropriate historical contexts. Figure 5 shows the reconstruction of Linlithgow Palace on a misty day, Figure 6 shows a school student engaging with the reconstruction and Figure 7 shows a still, where chroma key technology has been used to place a palace guide within the King’s presence chamber, in a movie of the reconstructed palace.
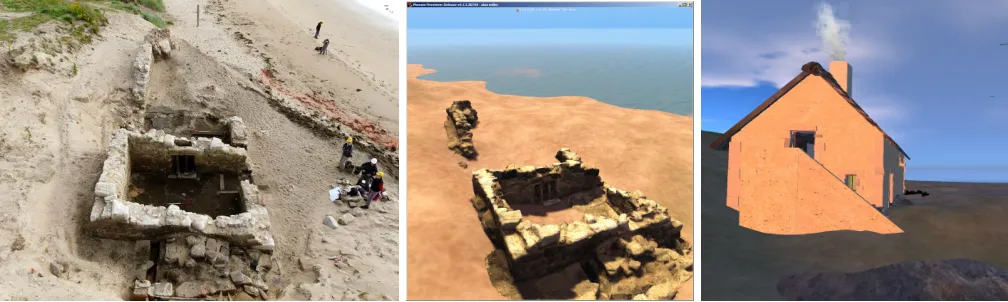
”Further Away” is an art installation created by AM Radio, which takes the viewer back in time to the 1930s. It is primarily of aesthetic value. A further resource is an Un-derwater Observatory, in which students become unUn-derwater explorers and take a trip to an underwater lab, which contains a classroom, observation rooms, and exhibits about marine life. The reconstruction of Salt Pans on the coast at Brora provide digital conservation of a site [7] under threat from coastal erosion. They were developed in collaboration with the Scottish Coastal Archaeology and the Problem of Erosion (SCAPE) project and consist of two sites. The first is a model based on a points cloud data set captured using a 3D laser scanner. The second site is a reconstruction of Brora as it was in the 16th Century. A photograph of the excavation site is shown in Figure 8, the virtual world model is shown in Figure 8 and the historical reconstruction in Figure 10.
[image:2.612.52.562.53.156.2]Fig. 5. Linlithgow Palace in the mist. Fig. 6. Interactive Engagement. Fig. 7. Palace Guide in the King’s Presence Chamber.
III. ARCHITECTURE ANDINTERFACES
An OpenSim system is made up of three discrete com-ponents: clients, simulations and services. The client allows the user to connect to an OVW server and provides an interface for viewing and interacting with content and other users. It provides control over how the data is displayed. For example, lighting, view distance and fidelity of the data are all configurable. Each simulation is responsible for keeping track of all the objects and avatars contained within it’s virtual spaces. It receives updates from and distributes updates to clients that are connected to it. Each simulation makes use of services, to retrieve information about Avatars, Buildings and Landscapes. These may be located on the same machine as the simulation, or distributed across one or more servers. This division of the system into components enables flexible deployment. Four common configurations are:
a) Sandbox: The server and client are both run on the
same machine. This provides an environment for off line development and is also useful for conference presentations and classroom teaching [8].
b) Stand Alone: Simulations and services are run on a
single server and may be accessed by multiple concurrent clients. Client access may be distributed across the Internet or may be restricted to a private ”LAN Party”.
c) Grid: In Grid mode multiple servers may run separate
simulations and services. The distribution of regions across servers is transparent to the user enabling regions on different servers to be located next to each other and for avatars to simply walk from one region to another. In this configuration a GRID of hundreds of regions can be run in a single administrative domain.
d) Hyper-Grid: This mode is most akin to the way in
which the WWW is structured. Once a user has joined a particular GRID that is connected to the Hyper-Grid any other grid that is connected to the Hyper-Grid can be visited. Virtual world and Grid addressing follows a standard URI format.
Each simulation contains components which control the weather, the physical structure of the space, the actions of avatars and interactions with other Internet resources. A sim-ulation may contain one or more regions. Each represents a discrete piece of land, which is usually 256m by 256m. Regions may be placed contiguously, whether they are in the same simulation or not. A user’s avatar will be able to walk
between adjacent regions and may simultaneously view the contents of multiple regions.
The amount, colour and movement of clouds, the colour opacity and reflectivity of water, visibility and mist, lighting and the presence of shadows as well as the time of day are all programmable. Defaults for these features may be set for each region within a simulation and may be overridden at the client side in line with the users’ aesthetics and the graphic capabilities of the client.
The landscape defines the ground the model is located on. There are four slots for textures, which are combined to colour the landscape. The heights at which the textures are used may be adjusted. The surface of the land may be set by uploading a grey scale image map where shade defines height, it may then be transformed using server side commands and adjusted using client side tools.
The structure of the architecture, fittings and furnishings of buildings may be constructed in OpenSim out of ”primitives” (referred to as ”prims”) or imported as meshes. Meshes may be developed in third party 3D modelling software or captured from real world data with a 3D laser scanner. Textures are images that may be applied to the surfaces of primitives and meshes.
The movement and appearance of avatars is customizable. In-world tools provide control over body, shape size and colouring as well as the garments that are worn. More control can be achieved by using external modelling programs to design clothing and body shapes. Libraries of clothes and body shapes can be distributed, uploaded then modified. Avatars may represent in world Non Player Characters (NPCs), that are controlled with scripts. The libopenmetaverse [9] library provides support for creating Avatar bots controlled remotely by a programmable client.
Special media textures may be attached to primitives. This allows media to be streamed and displayed on the prim surface. One such media may be a web page, so a web page may be embedded on a surface. It may be set to point at a particular location on the web, which might provide relevant text, images or video. Web pages can also be launched by scripts into an internal or external browser. This opens up the possibility of the 3D reconstruction being used to navigate a rich array of web resources.
loca-Fig. 8. Brora Salt Pan during community excavation Fig. 9. Pointscloud OVW digital model Fig. 10. Reconstruction of 17th C Salt Pan
tion streaming media. Short clips of sound may be embedded in objects and played back when a predefined event occurs. Voice over IP may be used for peer to peer communication between clients and sound may be streamed to be heard by Avatars at a particular location within a region.
OpenSim is written in C# and runs over the .net framework or mono4. In world scripting is supported in LSL and C#.
This allows avatars and objects to respond to events, such as being touched or receiving messages on a chat channel. Objects may communicate with each other and complex inter-actions developed. Other modes of programming are possible, these include: Mini Regions Modules, Regions Modules and Plugins. The OpenSim architecture is designed to facilitate extension [10] and modification to meet unforeseen needs.
In summary OpenSim has an open, configurable and exten-sible architecture. As a consequence OpenSim systems may be developed to support a wide range of applications and be deployed in a variety of scenarios.
IV. QUALITY OFUSEREXPERIENCE
Quality of Experience is a subjective measure of a user’s perception of interacting with a system or service [11]. In general it is desirable to design systems which provide users with a good QoE. This is a challenge as QoE is a subjective category, which varies with different users and contexts. A first step is to identify and categorise the factors that impact upon a user’s QoE. If these can be quantified and related to system level Quality of Service parameters such as network bandwidth and server memory allocation; then understanding of QoE can be used to inform system design and configuration so that resources are used efficiently and QoE optimised.
In the context of virtual worlds factors affecting QoE can be categorised into those relating to performance and those relating to quality.
Metrics relating to performance can be subdivided into three: the Load Time, Response TimeandFrames Per Second
(FPS). The Load Time for a Virtual World is likely to be
4http://www.mono-project.com/Mono is an open source implementation of
Microsoft’s .NET Framework based on the ECMA standards for C# and the Common Language Runtime
acceptable if it is similar to analogous activities such as switching on a DVD, loading BBC IPlayer or starting up a game. These activities occur only once per session conse-quently tolerance is relatively high. The Response Time is the time between issuing a command and getting a response. This may occur many times a second throughout the life time of a session. In [12] a hierarchy of thresholds for acceptable delay is established for activities in first person, third person and overhead view. The FPS relates to the smoothness with which motion is displayed, frame rates between 15 and 30 FPS provide a good user experience.
From the perspective of quality there are three types of factors: theresolution, quality of imageandquality of context. The resolution of the display limits the detail that objects can be rendered at within a scene. The quality of the image for a given resolution is defined by factors such as anti-aliasing and ambient occlusion. The view distance, lighting, shadows and depth of field all affect the quality of the context within which objects are presented.
There is an inverse relationship between between the quality and performance metrics. For example for a given system and load the FPS can be increased if the draw distance or anti aliasing is reduced.
This combination of content, activity and physical interfaces provide a specific context within which the factors that impact upon QoE may be evaluated. Users interactions with content in a virtual world are mediated through the client, which may in turn be controlled by a keyboard and mouse, games controller or other devices. The activities undertaken by a user may vary between sessions: one session may focus on developing a 3D model, another on participating in an on line concert, a third may involve exploring a 3D space with the goal of solving a quest. The ”In the Wild” section of this paper illustrates the relationship between QoE and QoS settings in several concrete scenarios. However, some preliminary general observations are possible.
For the QoE performance metrics each has a region where the system is unusable this is bounded by the usability
threshold.The usable region is bounded by both theusability
[image:4.612.54.558.54.205.2]usability threshold and frame rates above it a satisfactory QoE is obtained. Reducing delays below or increasing framerates above theimprovement limitwill not further increase the QoE. The goal is to use our understanding of QoE to reflect upon observations of OVW in use and to develop from these a set of heuristics which can be used to guide the configuration of systems in specific contexts; taking into account the available displays, computers and communication infrastructure.
V. QUALITY OFSERVICE
The performance that can be sustained for a particular set of content and for a given quality setting is a function of the client, server and network systems and the interactions between them. This section presents a measurement study of factors affecting system performance. First, the methodology is described, then the server, network and client limitations imposed are considered in turn. This enables a picture to be built up of the performance relationship between the main system components.
A. Methodology
The system being measured is the Hyper-Grid enabled OpenSim server apollo. The system currently consists of 16 servers with some 70 cores, over 125 regions and over 1200 registered users. It is connected to the Internet through multiple 1 Gps links. The measurement infrastructure supports network monitoring along with measurements of client and server side performance.
A test network enables delay and packet loss for both in-coming and outgoing traffic to be introduced thereby providing a controlled measurement environment for measuring network limitation. TCPdump was used for packet capture. Traces are then parsed by a bespoke application which understands the OpenSim communications protocols. The network measure-ment infrastructure is discussed further in [13].
An infrastructure for generating load and measuring server performance was developed using libopenmetaverse5. Bot
avatars are created with programmable behaviour. This enables multiple runs to be automated. The infrastructure has been calibrated through comparing the load generated by users conducting normal activities with that of bots. This in turn allows the parameter space to be accurately probed as more runs may be executed than would be possible using humans.
A time series of the number of frames per second that are generated by the server for 8 and 33 concurrent avatars being driven by humans is shown in Figure 11. There is little difference between the two. This is a consequence of the server being capped at a limit of 55 frames per second. The frame time metric gives the proportion of time that is spent generating each frame and is illustrated by Figure 12 from the same scenario. Here a significant difference between the time to generate each frame for 8 and 33 avatars is shown. Of the two metrics, frames per second relates directly to the Quality of User Experience, and the frame time relates directly to the
5http://lib.openmetaverse.org/
Quality of Service achieved by the system. Distributions of the frame times for human and bot controlled avatars are shown in Figure 13. Empirical Cumulative Distribution Frequencies (CDF) for 8 and 33 avatars are shown. These illustrate that a good correspondence is achieved between system behaviour for bots and for human controlled avatars.
From the client side, the Firestorm browser in common with other browsers logs the frame-rate at regular intervals. The logging interval was set to 1 per second, to achieve a balance between the granularity of measurement and load on the system. This measurements were validated using the FRAPS6frame measurement program. This enabled the client
side frame rate to be captured and analysed for different client hardware and software settings.
The above methodology is based on the instrumentation of network, server and client elements of a substantial virtual world server system with a real user base.
B. Server Limitation
An OpenSim simulation server produces data for a variable number of frames per second. The number of ticks or frames that may be produced by the server is capped at 55 fps. If the time taken to process a single frame rises above 19ms the number of frames per second is decreased. The server frame rate places an upper limit on the rate the client can usefully display frames.
A set of measurements were conducted using program controlled avatars connecting to a region running on a server with a quad core 2 Ghz Zeon processor and 8Gb of Ram. The island contains a reconstruction of St Andrews Cathedral located on a six region Island with over 50,000 prims. The server was configured to run on the following environments: Ubunto, Zen in native (dom0) and virtual (domU) KVM and Virtual Box. In addition an Amazon ec2 Extra Large Instance cloud compute unit was evaluated7This experiment establishes
the number of concurrent users that are supported on the Island for the given hardware.
The distribution of frame time for twenty avatars being present on the Island is shown in Figure 14. This demonstrates both that for all configurations, excepting Virtual Box, the maximum frame rate will be supported for 20 avatars. How-ever, using virtualisation doubles the time taken to produce each frame. The mean frame time increases linearly as the number of avatars increases as shown in Figure 15. The hierarchy of performance seen for twenty avatars is maintained across the spread of Avatar numbers, with the native Linux server performing the best.
The impact that increasing the number of avatars has on the server frame rate is shown in Figure 16. A consistent frame rate of around 55 Server Frames per second is achieved by each configuration for a small number of Avatars. At a certain point, increasing the number of avatars decreases the server frame rate. For native Linux this is at around 55 avatars and for
6Derived from Frames per Second http://www.fraps.com/
715 GiB memory, 8 EC2 Compute Units (4 virtual cores with 2 EC2
0 50 100 150 200
35
40
45
50
55
60
65
Sample
FPS
8 Humans 33 Humans
Fig. 11. Server Frames generated per second.
0 50 100 150 200
0
5
10
15
20
Sample
fr
ame time
8 Humans 33 Humans
Fig. 12. Frame Time: time to generate a frame.
0 5 10 15
0.0
0.2
0.4
0.6
0.8
1.0
frame time
cum
ulativ
e distr
ib
ution
8 Humans 33 Humans Walk−Rest1(8 Agents) Walk−Rest1(33 Agents) Walk2(8 Agents) Walk2(33 Agents)
Fig. 13. CDFs of frame times for 8 and 33 human controlled and program controlled avatars.
0 0.2 0.4 0.6 0.8 1
0 20 40 60 80 100
Fra
ctio
n
Frame Time
20 Avatars Metal 20 Avatars XEN dom0 20 Avatars XEN domU 20 Avatars KVM 20 Avatars Virtual Box 20 Avatars Amazon EC2
Fig. 14. Server Frame Time for 20 Avatars. 0 50 100 150 200 250
0 10 20 30 40 50 60 70 80 90 100
Fra
me
Tim
e
Avatars Metal
XEN dom0 XEN domU KVM Virtual Box Amazon EC2
Fig. 15. Time to render a frame.
0 10 20 30 40 50 60
0 10 20 30 40 50 60 70 80 90 100
FPS
Avatars
Metal XEN dom0 XEN domU KVM Virtual Box Amazon EC2
Fig. 16. Frames per second.
KVM at around 25 avatars. This is the point where increasing the number of Avatars has the potential to reduce users QoE. If the frames per second fall below 15 the QoE is severely affected.
These measurements demonstrate that the OpenSim simu-lation server can support up to 55 users at the same QoE as it can support one user. Further, that virtualisation can be used to run multiple virtual servers, and therefore increase the number of islands that can be hosted. This will not compromise users QoE provided the number of users per virtual server remains small. However, there will be a cost to the users QoE if virtualisation is used when there are more avatars present. This motivates the need for intelligent resource management of virtual world regions.
C. Network Limitation
The model of simulation employed by Second Life and OpenSim, of centralised servers dynamically serving the envi-ronment to clients, differs from most computer games, where a model of the environment is held at each of the clients prior to commencement of the game. Computer games need only communicate avatar action and can consequently operate with tens of kbps [14] bandwidth. Studies of Second life traffic show that it uses an order of magnitude more bandwidth [13], [15]. In [16] it is shown that OpenSim behaviour is similar.
The contents of an island, number of avatar’s, client settings, network infrastructure and network congestion all affect band-width usage. The operating range for a single user is between 100 Kbps and 1 Mbps. This is less than a single MPEG 1 stream and shows that it is practical to use open world technol-ogy within institutional networks, over broadband connections and over wide area networks more generally.
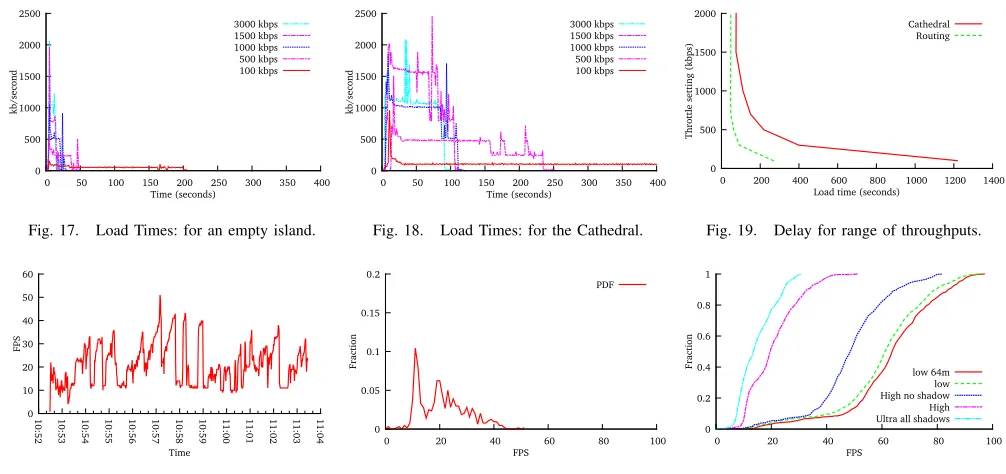
Load time is primarily affected by the amount of data to be downloaded and the bandwidth that is available. The amount of data varies between islands, depending on the size and number of textures, and complexity of prims and meshes. The available bandwidth is capped by three factors: client setting, physical bandwidth and the level of congestion. The default user value is 512 kilobits per second, which results in a 768 kbps throttle being imposed by the server. This global limit is then split into channels limits where each channel corresponds to a type of traffic, for example textures and primitives.
At the start of a session on the first visit to a region, the contents of the region within the Avatar’s view distance will be downloaded. On subsequent visits the cache maintained by the client will reduce the amount of data to be downloaded.
The following graphs illustrate the time it takes for a region to be downloaded at the start of an OpenSim session. There maybe a similar delay when an avatar teleports from one re-gion to another. Download times for an empty island are shown in Figure 17. User set bandwidth limits for between 100 kbps and 3000 kbps are shown. For this configuration download takes at most 50 seconds except for the 100 kbps setting. Download times for St Andrews Cathedral reconstruction are shown in Figure 18. The download times are significantly larger, around 5 minutes for the default setting to two of minutes for user setting of 1.5Kbps. The download times for the Routing and Cathedral Islands are shown in Figure 19.
[image:6.612.53.556.51.312.2]0 500 1000 1500 2000 2500
0 50 100 150 200 250 300 350 400
kb
/seco
nd
[image:7.612.52.555.53.290.2]Time (seconds) 3000 kbps 1500 kbps 1000 kbps 500 kbps 100 kbps
Fig. 17. Load Times: for an empty island. 0 500 1000 1500 2000 2500
0 50 100 150 200 250 300 350 400
kb
/seco
nd
Time (seconds) 3000 kbps 1500 kbps 1000 kbps 500 kbps 100 kbps
Fig. 18. Load Times: for the Cathedral.
0 500 1000 1500 2000
0 200 400 600 800 1000 1200 1400
Th
rottl
e set
ting
(kbp
s)
Load time (seconds) Cathedral
Routing
Fig. 19. Delay for range of throughputs.
0 10 20 30 40 50 60
10
:52 10:53 10:54 10:55 10:56 10:57 :5810 10:59 11:00 11:01 11:02 11:03 11:04
FPS
Time
Fig. 20. Time series of Client FPS.
0 0.05 0.1 0.15 0.2
0 20 40 60 80 100
Fra
ctio
n
FPS
Fig. 21. Prob. Distribution of Client FPS. 0 0.2 0.4 0.6 0.8 1
0 20 40 60 80 100
Fra
ctio
n
FPS
low 64m low High no shadow High Ultra all shadows
Fig. 22. CDF of FPS for Graphics Settings.
D. Client Limitation
This section looks at client limitation in terms of frames per second. For each of the scenarios discussed high bandwidth low latency local area network connections are used. The workload on the servers were also monitored to ensure that server performance was not the limiting factor.
The factors that are varied are: the quality settings at the client, the resolution at the client, the number of avatars that are present on an island, the client hardware and the characteristics of the island the avatar is on. In each case three runs are done, each run lasts for 10 minutes and the average frame rate for each second is recorded. The widely used Firestorm Browser was utilised in each case.
Four Islands are used in the client side measurement study, the Cathedral Reconstruction, Routing Island, an Underwater Observatory and Far away. Each has different characteristics and support different functionality. The Cathedral is a mega region comprising of 768m*512m. It is large and complex with over 50,000 prims. Routing Island is 512m*256m two region mega it has a large number of media exhibits and 30,000 prims number of primitives. Next in complexity is the Underwater Observatory. It is a single region island (256m*256m) with less than 10,000 prims. The simplest island is Further Away, it is a single region island with a relatively small number of prims and textures. In each of the runs an avatar follows a set path walking around the island, so all parts of each island are explored.
In these measurements three set ups are used. An Intel Core 2 Quad shuttle with on Intel X3500 on board graphics and 4GB memory, the same Quad core with an AMD 7750 graphics card and a client with Z77 motherboard an i7 3770K processor 8GB DDR3 memory and NVidia GTX 570. These we refer to as low, medium and high specification respectively. Unless
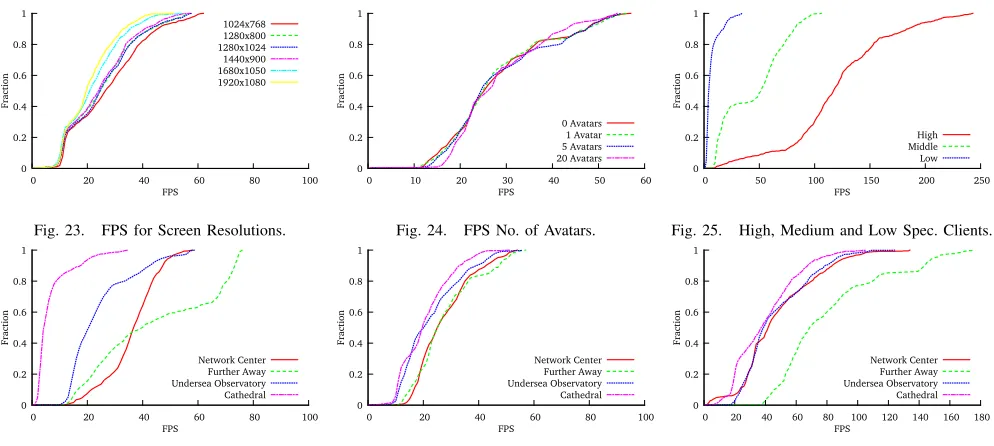
explicitly stated the medium specified configuration was used. A time-series graph, illustrating the variation in client frame rates that occurs as an Avatar walks around the Cathedral reconstruction, is shown in Figure 20 and the probability distribution is shown in Figure 21. The frame rate varies between 40 and 10 fps. This variation is caused by the location and orientation of the avatar: on the edge of the island looking to sea higher frame rates are achieved than facing towards the centre of the island. Furthermore, higher frame rates are achieved in locations where there is a low prim and texture density.
The client provides an interface which enables quality to be balanced against performance. When starting the client for the first time system’s graphics card will be detected and the graphics configuration set a low, medium, high or ultra setting. Through clicking the advanced tab settings for individual parameters may be over ridden. The distribution of client frame rates for the Cathedral island for five quality settings are shown in Figure 22. The five settings are ”Low Quality” with a view distance of less than 64m, ”Low Quality” with a view distance of 512m, High Quality with a view distance of 512m and no shadows, High Quality with shadows and Ultra with all settings set to maximum.
frame-rates ranging from a median of 10 for highest quality settings to 70 fps for the lowest.
The two most important settings from a quality perspective are view distance and shadows these both also have a signifi-cant impact on performance.
The distribution of client frame rates for resolutions ranging from 1024*768 to 1920*10808are shown in Figure 23. Whilst
as is to be expected, there is an inverse relationship between frame rate and resolution the variation in median frame rates is around 10 fps. Thus resolution has a smaller impact upon performance than the quality settings do.
The number of avatars on an island is a factor that has a significant impact on server side performance, Figure 24 shows the frame rate distributions for 0, 1, 5 and 20 avatars. Within this range the number of avatars on an island has little effect on client frame rates.
Client frame rate distributions for three hardware configura-tions at high quality settings are shown in Figure 25. The fps for the low specification are a few frames per second, whilst the high specification machine achieves a median of over 100 fps.
In the next three graphs frame rates for the Cathedral Reconstruction, Network Island, Underwater Observatory and Further Away are shown for a specific client configurations. Results for the low spec. client (Figure 26) medium spec. client (Figure 27) and high spec. client (Figure 28) are shown in separate graphs.
For the on-board graphics the low quality settings were used. For each configuration usable frame rates were achieved for all the Islands. The biggest differentiation was using the on-board graphics, for this hardware the complexity of the islands makes a big difference to the performance. There was little differentiation for the medium hardware, with usable frame-rates achieved in all islands. For the high specification machine there is an increase in frame rates across the board, with Father Away reaching a median of over 60 fps.
At the time of writing a quad core computer such as those bought as standard by schools in Scotland (Quad core Intel i5 with no bespoke graphics card) will render complicated structures at around 20 frames per second at the ”low” quality graphics settings. Features such as the rendering of shadows, ambient occlusion and anti aliasing require a medium end graphics card (AMD HD7750). All features and a high frame rate can be achieved with a high end graphics card for example AMD HD7870.
E. Summary
It is currently possible to run OpenSim servers and clients using the commodity computers that are currently being pur-chased by schools, businesses and universities and for these services to be made available and accessed across the current network infrastructure. This would not have been the case two years ago. Furthermore as processing power and network infrastructure continues to improve so too will the fidelity and the responsiveness of virtual worlds.
8XGA, WXGA, SXGA, WXGA+, WSXGA+ amd FHD
VI. VIRTUALWORLDS IN THEWILD.
The authors have participated in the deployment of Open Virtual World resources in a number of concrete scenarios. This has enabled evaluation of the system deployments Uni-versities, Science Centres, Computer Laboratories and Schools as well as collection of user feedback as to its value from a users perspective.
At Linlithgow Academy year one students engaged in a
treasure trail. Each student explored a reconstruction of Lin-lithgow Palace. Through interacting with embedded web pages they were asked to discover historic facts about the palace, which taken together formed the solution to a riddle. Firewall restrictions and the wide area network infrastructure made it impractical to connect to a remote server. Instead the client software was installed on school Intel Core 2 Quad computers with 4GB RAM and no discrete graphics card and the server was installed on the school application server.
A 3D resource for learning about routing in networks was used at the School of Computer Science at St Andrews University. Students were asked to complete a worksheet about routing which included interaction with a 3D network routing simulation. The server was a publicly accessible dual quad core system with 32GB of RAM. The clients used were standard quad core lab machines.
At Dundee Science Centre sensation event an exhibition
was created where visitors could explore a reconstruction of St Andrews Cathedral, and interact with virtual historic characters including Robert the Bruce, who was present at the Cathedrals consecration. Visitors interacted with the re-construction using an XBox 360 controller. There were three public facing displays, which were driven by Intel Quad Core machines each equipped with 4 GB of RAM and an ATI 7750 graphics card. They were connected via a local switch to a local Quad Core server on a private network. Connection of laptops to the server was also supported through WiFi.
The following observations were made of these systems in use:
Different resolutions were used in each environment. In the school setting the system was run at the Firestorm standard setting of 1024*768, and in the science centre exhibition a resolution of 1920*1080. In the school environment a low quality setting was used with a draw distance of 256m. For the computer science lab a medium quality setting was used with a draw distance of 512m. In the exhibition setting a high quality setting was used with draw distance set to 1000m. In the school and lab scenarios the quality settings were set low. In the exhibition settings shaders were increased and anti aliasing was used. Shadows were not switched on in these environments.
0 0.2 0.4 0.6 0.8 1
0 20 40 60 80 100
Fra
ctio
n
FPS
[image:9.612.58.555.53.276.2]1024x768 1280x800 1280x1024 1440x900 1680x1050 1920x1080
Fig. 23. FPS for Screen Resolutions.
0 0.2 0.4 0.6 0.8 1
0 10 20 30 40 50 60
Fra
ctio
n
FPS
0 Avatars 1 Avatar 5 Avatars 20 Avatars
Fig. 24. FPS No. of Avatars.
0 0.2 0.4 0.6 0.8 1
0 50 100 150 200 250
Fra
ctio
n
FPS
High Middle Low
Fig. 25. High, Medium and Low Spec. Clients.
0 0.2 0.4 0.6 0.8 1
0 20 40 60 80 100
Fra
ctio
n
FPS
Network Center Further Away Undersea Observatory Cathedral
Fig. 26. FPS for different Islands: Low spec. 0 0.2 0.4 0.6 0.8 1
0 20 40 60 80 100
Fra
ctio
n
FPS
Network Center Further Away Undersea Observatory Cathedral
Fig. 27. Comparing Islands: Medium spec. 0 0.2 0.4 0.6 0.8 1
0 20 40 60 80 100 120 140 160 180
Fra
ctio
n
FPS
Network Center Further Away Undersea Observatory Cathedral
Fig. 28. Comparing Islands High spec.
for ten seconds or more. Adjustment of the texture buffer size, prevented frame buffer swapping. With this adjustment responsiveness was usable in the school setting. In the lab setting responsiveness was generally good. However, routing simulation load caused periods of lack of responsiveness which compromised the usability. This has been addressed by redesigning the simulation software. Responsiveness within the exhibition setting was good.
In the school environment frame rate was borderline. Ini-tially it was below 10 fps but with system tuning a frame rate of between 10 and 20 frames per second was achieved, which was appropriate for the tasks in hand. In the lab session frame rates were above 15 fps except in the pathological scenarios described above. In the exhibition scenario average frame rates of over 20 frames per second were achieved.
The interactions and feedback that can be achieved even with marginal hardware are very positive. The account below relates to using a reconstruction of a Late Antique Acropolis basilica in an open day to provide an engaging taster of studying the classics at University to secondary school students (aged between 14-16). Several school groups participated, each session was 45 minutes and took place in the Classics computer laboratory which is equipped with 14 computers capable of running a Second Life client at low graphics settings. Keyboard and mice were used to control the avatars. At the start of each sessions students were asked to name five things that typified ancient Sparta and share these with the rest of the class. Typical responses focused on military aspects to take one persons list: soldiers, red, gladiators, war and old. This was followed by a 15 minute talk which introduced some Spartan history, politics and prose. Next the students participated in a virtual world session based around the Basilica. In the first part of the session they were free to explore the system and the Basilica. In the second part a
lecturer used a live projection of the Basilica to illustrate the correlation between the quality of view at locations within the Basilica and the status of worshippers.
The students were engaged throughout and were able to navigate the environment successfully. They were also able to communicate with each other in world as they explored the 3D space. At the end of the session students were asked: In what ways has this session made you rethink ancient Sparta? Two representative answers are given below:
I now see Sparta as not merely a city of war and violence .... it was not as barbarous as its made out to be for it had well-built and established churches showing.
Intriguing to wander around an ancient site and ex-perience it three dimensionally. I would be interested to be able to use other ancient buildings in this sort of way.
In this use case a virtual world model was successfully used as part of a blended learning session. Utilising historical reconstructions as part of blended learning has also been conducted for fourth year history students who are learning about Cathedrals and in for third year archeology students as part of a simulated archaeological excavation.
Positive feedback was also received in an exhibition setting at Dundee Science Centre. The setting was less formal, stalls in an exhibition space. People accessed the world using X Box controllers and Microsoft Kinect. The main resource was the cathedral reconstruction.
The boys were engrossed, very impressive, thanks! (Guardbridge school would love to see this) J and D 18/3/12.
Fig. 29. School Student feedback from experience of conducting a quest in the Linlithgow Palace reconstruction.
Kelty Cubs 18/3/12
I am employed by Historic Scotland and work occasionally at the Cathedral. I have spent many moments wondering what it looked like in medieval times in its heyday. I often wished I could be transported back to that time for just 5 minutes to capture its real spirituality. 24/6/12.
From these scenarios it can be observed that: usable open virtual world systems can be successfully deployed within school and university environments without the need for bespoke equipment. In doing so new and exciting educational opportunities arise, which enable students to use their existing digital literacies in engaging exploratory learning.
VII. CONCLUSION
Three significant trends in computing technologies have prompted this paper on progress towards the 3D Web: the continuing improvements in network infrastructure and the graphics and computational power of commodity computers; the emergence of freely available open source virtual world platforms OpenSim in particular; and the functional expansion of the Web to accommodate more diverse and demanding forms of interactive multimedia.
Generalising from our experience of working with Open-Sim we have developed the concept of Open Virtual Worlds (OVWs). The VW model makes it easy to create content. The OVW model means that once content has been created it is available for use in a wide range of contexts. The ability for users and organisations to control their own servers ensures that programmability need not be constrained by the business model, security or resource restrictions of any single provider. The web-like interconnectivity enabled by hyper-grid architecture broadens still further the contexts in which the content can be shared and explored and we anticipate that eventually the Web browser will subsume OVW client functionality.
As was the case with the early 2D Web there is now a need for understanding the quality of service and concomitant quality of experience found in the immersive 3D web. Notable differences between the 2D and the immersive 3D web include presence and the degree of interactivity. Research reported in this paper has identified suitable performance benchmarks for OVWs. Monitoring and measurements have been carried out in the wild and in the lab and the results have been presented and analysed. Future work will address the challenges of scalability, 2D Web OVW integration, and what it means to move between OVWs.
REFERENCES
[1] MW, A. Frisby, MingChen, lbsa71, S. Dague, Tedd, justincc, Teravus, J. Berntsson, C. Krinke, D. Scofield, dahlia, mikem, M. Thielker, H. Horwitz, I. Brown, C. Lopes, nlin, and A. R. S. Valadares, “OpenSimulator,” http://opensimulator.org, [Online; accessed 29-September-2010]. [Online]. Available: http://opensimulator.org [2] T. Berners-Lee and M. Fischetti,Weaving the Web: Origins and Future
of the World Wide Web. Orion Business Publishing, 1999.
[3] J. Gelissen, “Introduction to MPEG-V,” Journal of Virtual
Worlds Research, vol. 2, no. 3, 2009. [Online]. Available:
http://journals.tdl.org/jvwr/article/view/742/533
[4] R. Fawcett, S. Foster, and C. J. Tabraham, St Andrews Cathedral. Historic Scotland, 2003.
[5] R. Fawcett,The architecture of the Scottish medieval Church. Yale University Press, 2011.
[6] R. Sweetman, “Acropolis basilica, sparta: the broader research issues,” in Proceedings of the International Conference Sparta and Laconia From Prehistory to PreModern, W. G. Cavanagh, C. Gallou, and M. Georgiadis, Eds. BSA Studies, 2009, pp. 331–343.
[7] J. Hambly, “Brora back beach, sutherland data structure report,” SCAPE, Tech. Rep., 2010.
[8] A. Miller, I. Oliver, and C. Allison, “Demiurge: A toolkit for supporting educational developments in virtual worlds,” in2th Annual Conference, of the Educational Academy Subject Center for Information and Com-puter Science Belfast., 2011.
[9] Baba, otakup0pe, jhurliman, J. Malthus, mcortez, D. McLean, L. Coder, A. Zaius, jradford, Lancej, frob, and L. Khalifa, “libopenmetaverse,” http://www.openmetaverse.org/projects/libopenmetaverse, [Online; ac-cessed 28-March-2011].
[10] J. McCaffery, A. Miller, and C. Allison, “Extending the use of virtual worlds as an educational platform - network island: An advanced learn-ing environment for teachlearn-ing internet routlearn-ing algorithms,” in CSEDU (1), 2011, pp. 279–284.
[11] A. Bouch, A. Kuchinsky, and N. Bhatti, “Quality is in the eye of the beholder: meeting users’ requirements for internet quality of service,” in Proceedings of the SIGCHI conference on Human factors in computing systems, 2000.
[12] M. Claypool, “The effect of latency on user performance in real-time strategy games,”Computer Networks, vol. 49, no. 1, pp. 52–70, 2005. [13] I. A. Oliver, A. H. Miller, and C. Allison, “Virtual worlds, real traffic:
interaction and adaptation,” in Proceedings of the first annual ACM SIGMM conference on Multimedia systems, 2010.
[14] J. Kinicki and M. Claypool, “Traffic Analysis of Avatars in Second Life,” inProceedings of the 18th ACM International Workshop on Network and Operating Systems Support for Digital Audio and Video (NOSSDAV), Braunschweig, Germany, May 2008.
[15] K. Getchell, I. Oliver, A. Miller, and C. Allison, “Metaverses
as a platform for game based learning,” in Proceedings of the
2010 24th IEEE International Conference on Advanced Information Networking and Applications, ser. AINA ’10. Washington, DC, USA: IEEE Computer Society, 2010, pp. 1195–1202. [Online]. Available: http://dx.doi.org/10.1109/AINA.2010.125
[image:10.612.55.297.54.236.2]