ISSN Online: 2333-9721 ISSN Print: 2333-9705
DOI: 10.4236/oalib.1105828 Oct. 28, 2019 1 Open Access Library Journal
Statistical Parametric Analysis on
Democracy Data
A. K. M. Raquibul Bashar, Chris P. Tsokos
University of South Florida, Tampa, FL, USA
Abstract
The Economist Intelligence Unit (EIU), collected information from 167 coun-tries of the world to classify each of the councoun-tries into four categories of De-mocracy and they have classified those countries based on the DeDe-mocracy Index Score (DIS). EIU derived the DIS from the subject data and proceeded descriptively to use the DIS score to classify each of the countries into one of the four types of democracy. In this paper, we have identified the overall probability density function (PDF) of the DIS as well as the PDF of each of the individual type of democracy defined by EIU. Knowing the PDF it can probabilistically characterize the behavior of the overall DIS data and each of the four types of democracy. It is found that the overall PDF of DIS is mixer distribution with their corresponding weights and some of the PDF of indi-vidual category follows the same probability density function.
Subject Areas
Mathematical StatisticsKeywords
Democracy Data
1. Introduction
The EIU has introduced the democracy index scores [1] in 2006. It is used to measure the state of democracy in 167 countries, of which 166 are sovereign states and 164 are UN member states. Some researcher studied the relationship between political environment and health services accessibility (HSA) addressed the gap in the literature by examining the relationship between political envi-ronment and HSA [2]. David F. J. Campbell [3]elaborated the basic concept for the Democracy Ranking of the Quality of Democracy and compared this
ap-How to cite this paper: Bashar, A.K.M.R. and Tsokos, C.P. (2019) Statistical Parame- tric Analysis on Democracy Data. Open Access Library Journal, 6: e5828.
https://doi.org/10.4236/oalib.1105828 Received: October 3, 2019
Accepted: October 25, 2019 Published: October 28, 2019
Copyright © 2019 by author(s) and Open Access Library Inc.
This work is licensed under the Creative Commons Attribution International License (CC BY 4.0).
http://creativecommons.org/licenses/by/4.0/
DOI: 10.4236/oalib.1105828 2 Open Access Library Journal
proach in context of academic discourses about democracy and the quality of democracy. Sung [4] studied the cross-national comparison of democracy and corruption. To our knowledge, the statistical distribution of this score was not studied to understand the probabilistic behavior.
In this study, we have studied the data on the DIS and estimated the probabil-ity densprobabil-ity functions to represent the behavior of the scores statistically. By doing so, one can utilize the estimated pdf to calculate the probability of the random variable falling within a particular range of values, in our case, it is from 0 to 10 as defined by the EIU. Therefore, it is practically relevant to the fact that if anyone wants to find the probability of a group of countries falling in a certain range of scores then that will give them an idea of that particular countries qual-ity of democracy with certain type of assurance statistically.
2. Measuring Democracy
The Economist Intelligence Unit (EIU) index of democracy is based on the view that measures of democracy that reflect the state of political freedoms and civil liberties are not thick enough. Their democracy index is based on five categories: 1) Electoral Process and Pluralism (EPP); 2) Civil Liberties (CL); 3) Functioning of Government (FG); 4) Political Participation (PP); and 5) Political Culture (PC). The present study is to find the probability density function (PDF) of the scores by the EIU. Having identified the PDF of the EIU data we can probabilis-tically characterize the democracy behavior that is driven by the collected data.
In addition, having the PDF of the EIU index scores we can obtain other use-ful information such as the probability of a given country being one of the cate-gories of Democracy [5] named fully democratic, Flawed democratic, Hybrid re-gime, Authoritarian regime among other useful information.
3. Data Source and Methodology
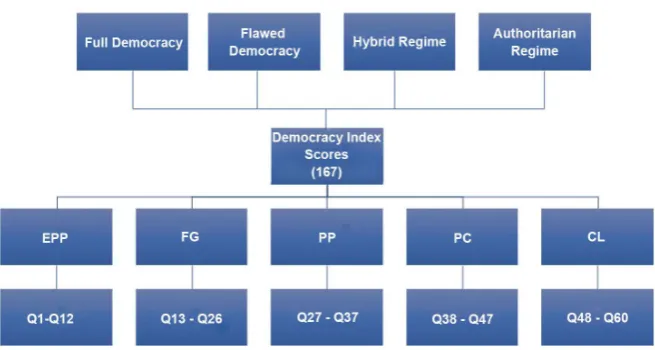
In this study, we are using the data from the Economist Intelligence Units (EIU) Democracy Index [5]. These data sets are to be used only for the subject study. The data consists of five different attributable variables that identify the type of Democracy that we will use in our study. Given below, Figure 1 is the schematic diagram of the complete data set that we will be using.
As part of our preliminary preparation of the dataset, we have checked to see that the data was randomly collected to determine if there is any biasness and it does not contain any outliers. So, after these aforementioned tests, we proceeded to find the best Probability Distribution Functions (PDF) of all the DIS scores and each of the four classification of Democracy, namely, Full, Flawed, Hybrid, and Authoritarian Regime.
3.1. Finding the Probability Distribution Function (PDF) of All the
Democracy Index Scores (DIS)
DOI: 10.4236/oalib.1105828 3 Open Access Library Journal
Figure 1. Data Diagram of democracy index score (DIS).
distribution may look like [6]. Then we shall identify the best candidates for the PDF that characterizes the subject variable. The following, Table 1, shows the basic statistic of the variable democracy scores (DIS) of 167 countries of the world.
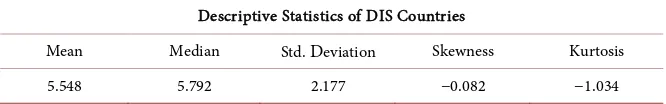
From Table 1, we see that the average (mean) democracy index score for all the countries of the world is 5.548 and the standard deviation is approximately 2.18. It should be noted that the data is slightly left skewed with skewness val-ue of −0.08153. The mean is the sample mean as defined the statistical literature as, 1 n1
i i
x x
n =
=
∑
and the sample standard deviation is calculated bythe formula, 1 1
(
)
21 n
i i
s x x
n =
= −
−
∑
. The skewness and kurtosis are estimated by the formulas explained by Joanes and Gill [7], where they suggested to find the sample estimates of skewness by the quantity defined as,(
)
(
)
3 1
1 3 2
2 1 1 1 1 n i i n i i x x n b x x n = = − = − −
∑
∑
and the kurtosis was estimated from the sampledata by
(
)
(
)
4 1 1 2 2 1 1 3 1 n i i n i i x x n g x x n = = − = − − ∑
∑
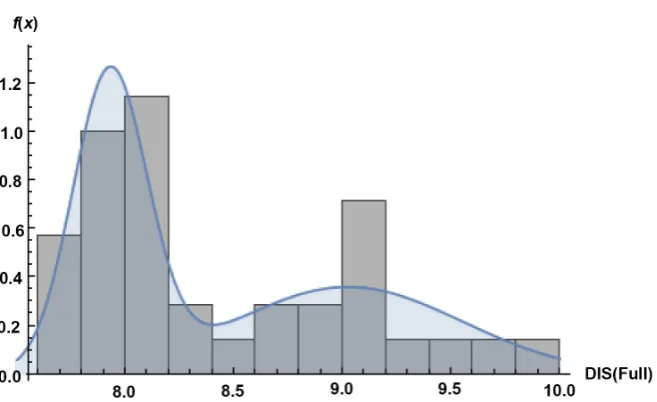
. A histogram of the scores also supports thesame information provided in the descriptive statistics given in Table 1.
3.1.1. Goodness-of-Fit Tests for All DIS
DOI: 10.4236/oalib.1105828 4 Open Access Library Journal
Table 1. Descriptive statistic of DIS of 167 countries of the WORLD.
Descriptive Statistics of DIS Countries
Mean Median Std. Deviation Skewness Kurtosis
5.548 5.792 2.177 −0.082 −1.034
We have found that, the Mixed Gaussian PDF best fits all the DIS data as it is supported by the results given in Table 2.
Thus, we proceed to discuss and fit the Mixed Gaussian PDF of the DIS of 167 countries of the world.
3.1.2. Analytical Structure of the PDF of Democracy Index Score (DIS)
After passing the data through the aforementioned three goodness-of-fit tests [12], the probability distribution that captures the characteristics of DIS the best is the “Mixed Gaussian Probability Density Function”. A Gaussian mixture model [13] is parameterized by two types of values, the mixture component weights and the component means and variance/covariance. For a Gaussian mixture model with K components, the Kth component has a mean of
k µ and standard deviation of σk for the univariate case. In our case K =2 because in the estimated pdf we have mixure of two distributions as postulated in Figure 2. The analytical structure is given by:
( )
(
)
(
)
(
)
2 1 2 2 | , , 1with | , exp ,
2 k
i i i
i
i i i
i i
f x N x
x
N x X
φ µ σ
µ µ σ σ σ = = − = − − ∞ ≤ ≤ ∞
π
∑
(3.1)
The mean and the variance is 5.554 and 4.912, respectively, with standard deviation of 2.216. Alternative analytical form of the PDF given in Equation (3.1) has the following form of PDF:
( )
( )(
)
( )(
)
2 2 1 2 2 2 1 2 2 2 1 21 1 2 2 1 2
e e 2 2 0, otherwise x x f x µ µ σ σ φ φ
σ φ φ σ φ φ
− −
− −
+
= π + π +
(3.2)
For our data, the approximate maximum likelihood estimates (MLE) of the parameters (σi, µi, and φi) of 2 are given in Table 3.
Thus, the estimated analytical form of the subject PDF is given by-
( )
0.144e 0.53( 3.11)2 0.18e0.24( 6.88)2, 0 100, otherwise
x x X
f x = − − + − − ≤ ≤
(3.3)
The graph of 3 is given by Figure 3.
DOI: 10.4236/oalib.1105828 5 Open Access Library Journal
Table 2. Goodness-of-fit summary.
α p-value Do Not Reject/Reject
Kolmogorov-Smirnov 0.05 0.9993 Do Not Reject
Anderson-Darling 0.05 0.9840 Do Not Reject
Chi-Squared 0.05 0.5268 Do Not Reject
Table 3. MLEs of mixture distribution fitted to democracy index score.
MLEs of DIS scores
1
ˆ
µ µˆ2 σˆ1 σˆ2 φˆ1 φˆ2
[image:5.595.205.541.201.498.2]3.107 6.877 0.974 1.437 0.351 0.649
[image:5.595.213.537.446.656.2]Figure 2. Histogram of democracy index scores.
Figure 3. PDF plot of DIS (Mixed Gaussian PDF).
DOI: 10.4236/oalib.1105828 6 Open Access Library Journal
function of 3 is given by
( )
3.11 0.472 6.88 1.03320.351e t t 0.65e t t
X
M t = + + + (3.4)
The moment generating function (MGF) is given in the Equation (3.4) can be used to calculate the moments of higher order and consequently to calculated the mean and variance of the Mixed Gaussian PDF. Thus, if a country is selected at random from the population of 167 countries we will expect its DIS to be 5.554. Also, we calculate the variance, V X
[ ]
=4.912 and standard deviation,[ ]
2.216STDV X = . Note that these estimates are close to the basic statistics given in Table 1, which assures to the quality of the fit of Mixed Gaussian PDF.
The Cumulative Distribution Function of the DIS is as follows:
( )
(
)
(
)
(
)
1 2
1 2
1 2
1 2 1 2
erfc erfc
2 2
2 2
x x
F x P X x
µ µ
φ φ
σ σ
φ φ φ φ
− −
= ≤ = +
+ + (3.5)
where, θ1 and θ2 are 0.351 & 0.649 respectively and erfc is the “cumulative
error function”
The graph of cumulative distribution function is by following Figure 4. Figure 4, is very useful in the cases, for example, if anyone wants to know the probability of any country will have a DIS less than 3.8 (i.e. P
[
DIS 3.8≤]
), then from the above figure it is shown that the probability would be 0.278 or ap-proximately 28% of the areas under the cumulative probability distribution curve. Also, if we are curious about the probability of any country’s DIS less than or equal to 5.6, then from Figure 4, one can easily estimate it and the probability is approximately 0.81% or 81% area under the cumulative curve and so on.Now we will proceed to find the PDF for each of the four classified categories of Democracy in the following sections.
3.2. Finding the Probability Distribution Function (PDF) of “Fully
Democratic” Countries of the World
Here we shall proceed to find the probability distribution that characterize the probabilistic behavior of only the DIS data for Full Democracy. To do this we have implemented the same steps we have used in finding the overall PDF of DIS for all democracy classifications. For this purpose, we have started with the basic descriptive statistics of Fully Democratic countries.
From Table 4, we see that, this subset of the overall data is slightly right skewed with a value of 0.77913 and it has a mean of 8.4292. The histogram of the Full Democratic Countries is given in Figure 5. From this histogram, the impli-cation is that we need to fit some sort of mixed probability distribution.
DOI: 10.4236/oalib.1105828 7 Open Access Library Journal
[image:7.595.211.540.301.502.2]Figure 4. CDF plot of democracy index scores.
Figure 5. Fitted PDF to histogram of fully democratic countries.
Table 4. Descriptive statistic of full democratic countries of the world.
Descriptive Statistics of DIS of Fully Democratic Countries
Mean Median Std. Deviation Skewness Kurtosis
8.4292 8.168 0.63265 0.77913 −0.46872
Table 5. Goodness-of-fit summary for fully democratic countries.
α p-value Do Not Reject/Reject
Kolmogorov-Smirnov 0.05 0.916 Do Not Reject
Anderson-Darling 0.05 0.986 Do Not Reject
[image:7.595.203.540.559.611.2] [image:7.595.207.542.644.725.2]DOI: 10.4236/oalib.1105828 8 Open Access Library Journal
Thus, the fitted theoretical PDF of the subject data is given by-
( )
(
)
(
)
(
)
2 1 2 2 2 | , , 1Here | , exp
2 k
i i i
i
i i i
i i
f x N x
x N x
φ µ σ
µ µ σ σ σ = = − = −
π
∑
(3.6)
The approximate MLEs of the parameters that drive the estimated Mixed Gaussian PDF are given by Table 6.
Also,
∑
i2=1φ φ φˆi= +ˆ1 ˆ2=0.53 0.47 1.00+ = , are the weights of 2-Gaussian PDFof the mixed distribution. Thus, the analytical structure of the estimated PDF of Fully Democratic countries of the world is given by
( )
0.36e1.8( 9.02)2 1.23e 17.21( 7.93)2, 7.6 100, otherwise
x x X
f x = − − + − − ≤ ≤
(3.7)
The graph of the PDF of 3.7 is given in Figure 6(a).
The expected value and variance of Fully Democratic data subset is 8.4482 and 0.4453 respectively. That is, if a country is selected at random from this cluster we expect it’s DIS will be approximately 8.45. Also, the probability that a country will have a DIS of more than 9 is 0.246 as shown in Figure 6(b).
The CDF of the Fully Democratic countries of the world is given by-
( )
(
)
1 21 2
1erfc 1erfc
4 2 4 2
x x
F x P X x µ µ
σ σ
− −
= ≤ = +
(3.8)
The graph of F x
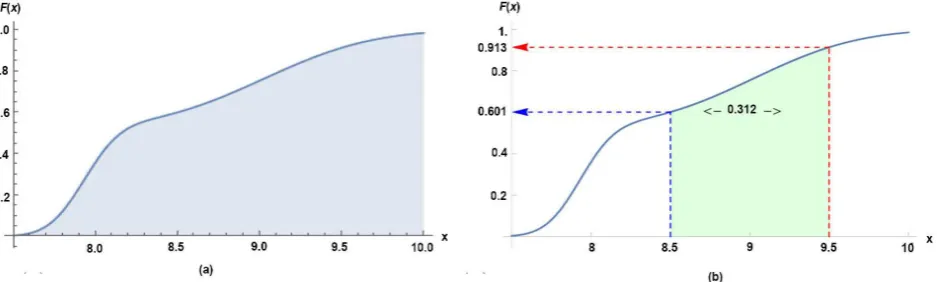
( )
in Equation (3.8) is given below by Figure 7(a).The plotting of Figure 7 is very useful in the case if anyone wants to estimate the probability of any country selected at random from this subset of the popula-tion and curious about the probability of that country will have a score more than 8.5 but less than 9.5 i.e.
(
8.5 9.5 1)
(
8.5)
1(
9.5)
P ≤X ≤ = −P X≤ − − P X ≤ , then that probability is 0.312 as shown in Figure 7(b).
3.3. Finding the Probability Distribution Function (PDF) of
“Flawed Democratic” Countries of the World
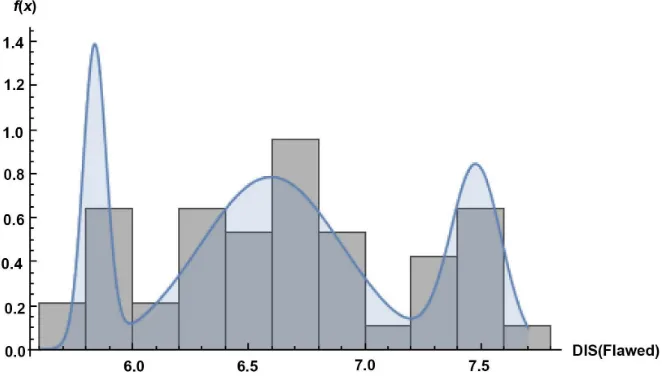
We shall now proceed to find the probability distribution that characterize the probabilistic behavior of only the DIS data for Flawed Democracy. To do this we have implemented the same steps we have used in finding the overall PDF of DIS for all democracy classifications. For this purpose, we have started with the basic descriptive statistics of Flawed Democratic countries.
From Table 7, we see that, this subset of the overall data has a mean 6.67. The histogram of the subject dataset is given in Figure 8. From this histogram, the implication is that we need to fit some sort of mixed probability distribution for this data subset as well.
DOI: 10.4236/oalib.1105828 9 Open Access Library Journal
Table 6. MLEs of PDF of fully democratic countries.
MLE
1
ˆ
µ µˆ2 σˆ1 σˆ2
[image:9.595.71.538.154.407.2]9.024 7.93 0.525 0.1704
Table 7. Descriptive statistics of flawed democratic countries.
Descriptive Statistics of Flawed Democratic Countries
Mean Median Std. Deviation Skewness Kurtosis
6.665 6.672 0.5592 0.0745 −1.0085
Figure 6. Plotting PDF of DIS of fully democratic countries of the world. (a) PDF of fully democratic countries; (b) PDF with
shaded area for P X
(
≥9)
.Figure 7. Plotting CDF of DIS of fully democratic countries of the world. (a) CDF of fully democratic countries; (b) CDF with
shaded area for P
(
8.5≤X ≤9.5)
.by the “Mixed distribution of 3-Gaussian PDF”. The justification of this selec-tion is confirmed by the three methods of goodness-of-fit that we used in Table 8 given below confirms that the best pdf for the Flawed democratic data is Mixed of 3-Gaussian PDF.
[image:9.595.68.540.186.402.2] [image:9.595.67.536.456.597.2]DOI: 10.4236/oalib.1105828 10 Open Access Library Journal
Figure 8. Fitted PDF to histogram of flawed democratic countries.
Table 8. Goodness-of-fit summary for flawed democratic countries.
α p-value Do Not Reject/Reject
Kolmogorov-Smirnov 0.05 0.996011 Do Not Reject
Anderson-Darling 0.05 0.999374 Do Not Reject
Chi-Squared 0.05 0.964295 Do not Reject
( )
(
)
(
)
(
)
1 2 2 | , 1Here | , exp ,
2 k
i i i
i
i i i
i i
f x N x
x N x
φ µ σ
µ µ σ σ σ = = − = −
π
∑
(3.9)
Also, k=3 and
∑
ik=1φi=1 as well.The approximate MLEs of the parameters that drive the estimated Mixed Gaussian PDF are given by Table 9.
And at the same time the analytical structure of the parameterized probability density function estimated from the data is given in the Equation (3.10) as fol-lows:
( )
( ) ( )( )
2 2
2
41.77 7.48 5.36 6.59
202.8 5.84
0.83e 0.79e
1.353e , 5.6 7.8
x x x f x X − − − − − − = +
+ ≤ ≤ (3.10)
Also, the weights for each of the Gaussian density estimated from the data are
1 0.168518
φ = φ =2 0.602757 and φ =3 0.228725 that makes
3 1 i 1 i=φ =
∑
.The graph of the PDF of 3.10 is given in Figure 9.
The expected value and variance of Flawed Democratic data subset is
( )
6.667 [image:10.595.207.540.319.387.2]DOI: 10.4236/oalib.1105828 11 Open Access Library Journal
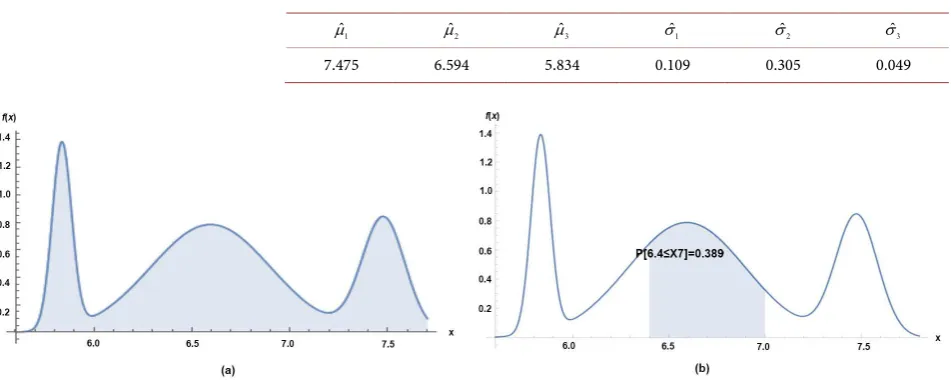
Table 9. MLEs of PDF of flawed democratic countries.
1
ˆ
µ µˆ2 µˆ3 σˆ1 σˆ2 σˆ3
7.475 6.594 5.834 0.109 0.305 0.049
Figure 9. Plotting PDF of DIS of flawed democratic countries of the world. (a) PDF of flawed democratic countries; (b) PDF with
shaded area for P
(
6.4≤X ≤7)
.probability that a country will have a DIS between 6.4 and 7 would be approx-imately 0.4 as shown in Figure 9(b). The cdf of the Flawed Democratic DIS is given by-
( )
(
)
(
)
(
)
(
)
3
1 2
3
1 2
3
1 2
1 2 3 1 2 3 1 2 3
erfc
erfc erfc
2
2 2
2 2 2
x
x x
F x P X x
µ
µ µ φ
φ φ
σ
σ σ
φ φ φ φ φ φ φ φ φ
− − −
= ≤ = + +
+ + + + + + (3.11)
It’s graph is given by Figure 10(a).
From the figures given above, we can extract some very useful information. Such as, the probability of any country’s DIS is greater or equal to 7 would be approximately 0.283 as shown in Figure 10(b).
3.4. Finding the Probability Distribution Function (PDF) of
“Hybrid Democratic” Countries of the World
We shall now proceed to find the probability distribution that characterize the probabilistic behavior of only the DIS data for Hybrid Democracy. To do this we have implemented the same steps we have used in finding the overall PDF of DIS for all democracy classifications. For this purpose, we have started with the basic descriptive statistics of Hybrid Regime countries.
The Table 10, describes the basic descriptive statistics of the data subset of Hybrid democratic countries of the world. The sample mean of this subset is 4.9621. Now the histogram of the Hybrid democratic countries are given in Fig-ure 11.
[image:11.595.226.538.374.420.2]DOI: 10.4236/oalib.1105828 12 Open Access Library Journal
Figure 10. Plotting CDF of DIS of flawed democratic countries of the world. (a) CDF of flawed democratic countries; (b) CDF
[image:12.595.208.538.258.450.2]with shaded area for P X
(
≥7)
.Figure 11. Fitted PDF to histogram of hybrid democratic countries.
Table 10. Descriptive statistic of hybrid democratic countries.
Descriptive Statistics of Hybrid Democratic Countries
Mean Median Std. Deviation Skewness Kurtosis
4.96 5.013 0.668 −0.0597 2.113
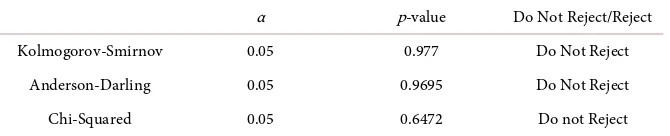
Table 11. Goodness-of-fit summary for hybrid democratic countries.
α p-value Do Not Reject/Reject
Kolmogorov-Smirnov 0.05 0.977 Do Not Reject
Anderson-Darling 0.05 0.9695 Do Not Reject
Chi-Squared 0.05 0.6472 Do not Reject
The MLEs of this pdf fitted to Hybrid democratic countries data is presented in the following table:
From Table 12, we see that the estimated value of the population mean
ˆ 4.966
[image:12.595.207.539.502.552.2] [image:12.595.207.542.583.651.2]DOI: 10.4236/oalib.1105828 13 Open Access Library Journal
Table 12. MLEs of hybrid democratic countries.
MLEs of Hybrid Democratic Countries
ˆ
µ σˆ
4.966 0.7044
close to the sample mean 4.9621. The analytical structure of the PDF of Hybrid democratic countries is given in the Equation (3.12).
(
)
(
)
2 2
1 exp ,
| , 2
0, otherwise
x
x f x
µ
µ σ σ σ
−
− −∞ ≤ ≤ ∞
= π
(3.12)
The analytical structure of the PDF of Hybrid regime countries with the esti-mated parameters is given by:
( )
0.566e 1.007( 4.966)2, 3.5 6.50, otherwise
x X
f x = − − ≤ ≤
(3.13)
The graph of the pdf given in 13 is shown in Figure 12(a).
From the above, one can calculate the expected DIS score of any country ran-domly selected from this cluster of the population is E X
( )
=4.966 and the va-riance V X( )
=0.496241. The estimated expected value is a very close match to the sample mean of 4.9621 given in Table 7 and the probability of DIS of any country greater than 5 is 0.481 as per Figure 12(b).The CDF of Hybrid Regime countries of the world is given by:
( )
(
)
1 erfc , 3.5 6.52 2
x
F x P X x µ X
σ −
= ≤ = ≤ ≤
(3.14)
The graph of the CDF mentioned in Equation (3.14) is postulated as follows: From the figures given above, we can extract some very useful information. Such as, the probability of randomly selected any country’s DIS is less than 5 (i.e.
(
5 1)
(
5)
P X ≤ = −P X > ) will be 0.52 as shown in Figure 13(b).
3.5. Finding the Probability Distribution Function (PDF) of
“Authoritarian Regime” Countries of the World
We have implemented the same steps we have used in finding the overall PDF of DIS for all democracy classifications. For this purpose, we have started with the basic descriptive statistics of Authoritarian Regime countries.
Table 13 shows the basic descriptive statistics of the Authoritarian regime of 49 countries of the world. The sample mean is approximately 2.85. The histo-gram of the subject data subset of overall DIS data is given below.
DOI: 10.4236/oalib.1105828 14 Open Access Library Journal
Figure 12. Plotting PDF of DIS of hybrid regime countries of the world. (a) PDF of hybrid regime countries; (b) PDF with shaded
area for P X
(
≥5)
.Figure 13. Plotting CDF of DIS of Hybrid regime countries of the world. (a) CDF of hybrid regime countries; (b) CDF with
shaded area for P X
(
≤5)
.Figure 14. Fitted PDF to histogram of authoritarian regime countries.
From Table 14, it is clear that the population PDF of Authoritarian Regime comes from Weibull Distribution. The approximate MLEs for the given PDF of Equation (3.15) given in Table 15.
[image:14.595.66.536.262.398.2] [image:14.595.233.512.452.618.2]DOI: 10.4236/oalib.1105828 15 Open Access Library Journal
Table 13. Descriptive statistic of authoritarian regime countries of the world.
Descriptive Statistics of Authoritarian Regime Countries
Mean Median Std. Deviation Skewness Kurtosis
2.85 3.012 0.724 −0.644 2.43
Table 14. Goodness-of-fit summary for authoritarian countries.
α p-value Do Not Reject/Reject
Kolmogorov-Smirnov 0.05 0.5889 Do Not Reject
Anderson-Darling 0.05 0.4602 Do Not Reject
Chi-Squared 0.05 0.4996 Do not Reject
( )
1 e
, if 0
0, otherwise
x
x
f x x
α α
β
α
β β
−
−
= >
(3.15)
The parameterized PDF of 3.15 is given by
( )
= 0.0228 3.667e 0.0054.667, 0 3.890, otherwise
x
x X
f x − ≤ ≤
(3.16)
The corresponding graph of 3.16 is given below.
The expected value from this PDF is 2.858, which is very close to the sample mean x=2.851. This indicates that our density estimation process is
statisti-cally correct. Also, it tells the fact that, if any country is randomly selected from this population, then the expected democracy index score would be approx-imately 2.86. Moreover, if a country is randomly selected from this cluster of the population then the probability of that country’s DIS is greater 3 will be ap-proximately 0.44 as shown in Figure 15(b).
The CDF for the Authoritarian Regime countries is given by-
( )
1(
)
1 ex
F X P X x
α
β −
= − ≥ = − (3.17) The plot of the above CDF given in Equation (3.17) is as follows:
Thus, if any country is randomly selected from this sub-population, then the expected democracy index score would be 2.86 and the probability of that coun-try being selected and having score less than or equal to 3 would be approx-imately 0.56 as shown in Figure 16(b).
4. Conclusions
[image:15.595.206.541.172.387.2]DOI: 10.4236/oalib.1105828 16 Open Access Library Journal
Figure 15. Plotting PDF of DIS of authoritarian regime countries of the world. (a) PDF of authoritarian regime; (b) PDF with
[image:16.595.70.536.75.208.2]Shaded area for P X
(
≥3)
.Figure 16. Plotting CDF of DIS of authoritarian regime countries of the world. (a) CDF of Authoritarian Regime; (b) CDF with
Shaded area for P X
(
≤3)
.Table 15. MLEs of authoritarian regime countries.
MLEs of Authoritarian Regime
ˆ
α βˆ
4.6678 3.126
different countries of the world. The EIU collected information of 167 countries in the world and descriptively classified each country as 1) Full Democracy, 2) Flawed Democracy, 3) Hybrid Regime, and 4) Authoritarian Regime. We pro-ceeded to find the PDF and it’s CPDF of
a) All the DIS scores for 167 countries to be the “Mixture of 2-Gaussian Probability Density Function”.
b) The PDF of Fully Democratic 35 countries out of 167 to be “2-Mixed Gaussian Probability Density Function”.
c) The PDF of 47 Flawed Democratic countries out of 167 countries follows “3-Mixed Gaussian Probability Density Function”.
d) The PDF of 36 Hybrid Regime countries out of 167 countries of the world follows the “Normal Probability Density Function”.
[image:16.595.69.535.260.393.2]DOI: 10.4236/oalib.1105828 17 Open Access Library Journal
“Weibull Probability Density Function”.
Thus, we can characterize the probabilistic behavior of all the DIS scores or the DIS for each of the four categories of democracy around the globe and ob-tain other useful information.
Conflicts of Interest
The authors declare no conflicts of interest regarding the publication of this pa-per.
References
[1] Kekic, L. (2007) The Economist Intelligence Unit’s Index of Democracy. The Economist, 21, 1-11.
[2] Walker, M.E., Anonson, J. and Szafron, M. (2014) Economist Intelligence Unit Democracy Index in Relation to Health Services Accessibility: A Regression Analy-sis. International Health, 7, 49-59.https://doi.org/10.1093/inthealth/ihu064
[3] Campbell, D.F. (2008) The Basic Concept for the Democracy Ranking of the Quality of Democracy.
[4] Sung, H.-E. (2004) Democracy and Political Corruption: A Cross-National Com-parison. Crime, Law and Social Change, 41, 179-193.
https://doi.org/10.1023/B:CRIS.0000016225.75792.02
[5] Economist Intelligence Unit (2015) Democracy Index 2014: Democracy and Its Discontents. Report dell’Economist Intelligence Unit. http://bit.ly/18kEzCt [6] Tsokos, C.P. (1972) Probability Distributions: An Introduction to Probability Theory
with Applications.
[7] Joanes, D. and Gill, C. (1998) Comparing Measures of Sample Skewness and Kurto-sis. Journal of the Royal Statistical Society: Series D (The Statistician), 47, 183-189. https://doi.org/10.1111/1467-9884.00122
[8] Massey Jr., F.J. (1951) The Kolmogorov-Smirnov Test for Goodness of Fit. Journal of the American Statistical Association, 46, 68-78.
https://doi.org/10.1080/01621459.1951.10500769
[9] Anderson, T.W. and Darling, D.A. (1954) A Test of Goodness of Fit. Journal of the American Statistical Association, 49, 765-769.
https://doi.org/10.1080/01621459.1954.10501232
[10] Chernoff, H. and Lehmann, E. (1954) The Use of Maximum Likelihood Estimates in χ2 Tests for Goodness of Fit. The Annals of Mathematical Statistics, 25, 579-586.
https://doi.org/10.1214/aoms/1177728726
[11] Stephens, M.A. (1974) EDF Statistics for Goodness of Fit and Some Comparisons. Journal of the American Statistical Association, 69, 730-737.
https://doi.org/10.1080/01621459.1974.10480196
[12] Finkelstein, J.M. and Schafer, R.E. (1971) Improved Goodness-of-Fit Tests. Biome-trika, 58, 641-645.https://doi.org/10.1093/biomet/58.3.641