Galaxy And Mass Assembly (GAMA): the wavelength-dependent sizes
and profiles of galaxies revealed by MegaMorph
Benedetta Vulcani,
1,2‹Steven P. Bamford,
3Boris H¨außler,
1,3,4,5Marina Vika,
1Alex Rojas,
1Nicola K. Agius,
6Ivan Baldry,
7Amanda E. Bauer,
8Michael J. I. Brown,
9Simon Driver,
10,11Alister W. Graham,
12Lee S. Kelvin,
13Jochen Liske,
14Jon Loveday,
15Cristina C. Popescu,
6Aaron S. G. Robotham
10,11and Richard J. Tuffs
161Carnegie Mellon University Qatar, Education City, PO Box 24866, Doha, Qatar
2Kavli Institute for the Physics and Mathematics of the Universe (WPI), Todai Institutes for Advanced Study, University of Tokyo, Kashiwa 277-8582, Japan 3School of Physics and Astronomy, The University of Nottingham, University Park, Nottingham NG7 2RD, UK
4Department of Physics, University of Oxford, Denys Wilkinson Building, Keble Road, Oxford OX1 3RH, UK 5University of Hertfordshire, Hatfield, Hertfordshire AL10 9AB, UK
6Jeremiah Horrocks Institute, University of Central Lancashire, Preston PR1 2HE, UK
7Astrophysics Research Institute, Liverpool John Moores University, IC2, Liverpool Science Park, 146 Brownlow Hill, Liverpool L3 5RF, UK 8Australian Astronomical Observatory, PO Box 915, North Ryde, NSW 1670, Australia
9School of Physics, Monash University, Clayton, Victoria 3800, Australia
10SUPA – School of Physics and Astronomy, University of St Andrews, North Haugh, St Andrews KY16 9SS, UK 11ICRAR - The University of Western Australia, 35 Stirling Highway, Crawley, WA 6009, Australia
12Centre for Astrophysics and Supercomputing, Swinburne University of Technology, Hawthorn, Victoria 3122, Australia 13Institut f¨ur Astro- und Teilchenphysik, Universit¨at Innsbruck, Technikerstraße 25, 6020 Innsbruck, Austria
14European Southern Observatory, Karl-Schwarzschild-Str. 2, D-85748 Garching, Germany 15Astronomy Centre, University of Sussex, Falmer, Brighton BN1 9QH, UK
16Max Planck Institut fuer Kernphysik, Saupfercheckweg 1, D-69117 Heidelberg, Germany
Accepted 2014 March 31. Received 2014 February 27; in original form 2013 November 26
A B S T R A C T
We investigate the relationship between colour and structure within galaxies using a large, volume-limited sample of bright, low-redshift galaxies with optical–near-infrared imaging from the Galaxy And Mass Assembly survey. We fit single-component, wavelength-dependent, elliptical S´ersic models to all passbands simultaneously, using software developed by the
MegaMorph project. Dividing our sample bynand colour, the recovered wavelength variations
in effective radius (Re) and S´ersic index (n) reveal the internal structure, and hence formation
history, of different types of galaxies. All these trends depend onn; some have an additional
dependence on galaxy colour. Late-type galaxies (nr<2.5) show a dramatic increase in S´ersic
index with wavelength. This might be a result of their two-component (bulge–disc) nature, though stellar population gradients within each component and dust attenuation are likely to
play a role. All galaxies show a substantial decrease inRewith wavelength. This is strongest
for early types (nr >2.5), even though they maintain constantnwith wavelength, revealing
that ellipticals are a superimposition of different stellar populations associated with multiple
collapse and merging events. Processes leading to structures with largerRemust be associated
with lower metallicity or younger stellar populations. This appears to rule out the formation of young cores through dissipative gas accretion as an important mechanism in the recent lives of luminous elliptical galaxies.
Key words: galaxies: formation – galaxies: fundamental parameters – galaxies: general – galaxies: structure.
E-mail:[email protected]
1 I N T R O D U C T I O N
It is common to describe galaxies by a few key properties, such as luminosity, colour, size and ellipticity, which are [at least in the
2014 The Authors
at University of Nottingham on July 12, 2016
http://mnras.oxfordjournals.org/
local Universe and at optical and near-infrared (NIR) wavelengths] indicative of the total mass, average age and spatial extent of their stellar contents. At a slightly more detailed level, one may charac-terize a galaxy in terms of its internal structure, or morphology: the presence and relative strength of features such as discs, bulges, bars, rings and spiral arms. Each of these features represents a distinctive distribution of stars, in terms of both their positions and velocities. Unfortunately, resolved stellar velocities are difficult to obtain, par-ticularly for large samples of distant galaxies. The largest studies of the internal structure of galaxies must therefore inevitably rely on imaging data.
Galaxies principally come in two morphological types: ellipticals and disc galaxies. Ellipticals have a simple, smooth appearance, show old stellar populations and live preferably in denser envi-ronments (see, e.g., Dressler et al.1997; Kauffmann et al.2003; Brinchmann et al.2004). Spirals primarily comprise a thin disc, containing a spiral arm pattern, possess younger stellar populations and avoid dense regions (e.g. Freeman1970; Blanton & Moustakas
2009and references therein). However, spirals often also contain a spheroidal ‘bulge’, a structure similar in colour and shape to a small elliptical galaxy, at their centre (Andredakis, Peletier & Bal-cells1995); though bulges appear to be denser than present-day elliptical galaxies (e.g. Graham & Worley2008; Graham 2013). The relative size and importance of the bulge and the appearance of the spiral features vary substantially, resulting in a range of spiral morphologies (de Jong1996a). Lenticular galaxies sit at the inter-section of ellipticals and spirals. They display similarities to both, often being dominated by a bulge, but also by definition, containing a spiral-free, disc-like component. Ellipticals and lenticulars can be hard to distinguish from their appearance. Indeed, over the past decade, many galaxies that were thought to be ellipticals have been discovered to contain rotating discs, and thus are actually lenticular galaxies.
From the latest models of galaxy formation and evolution, it is becoming clear that there is a more fundamental distinction in the galaxy population than that between elliptical, lenticular and spiral galaxies (e.g. Ellis, Abraham & Dickinson2001). To truly understand galaxy evolution, one must separate the components of galaxies: spheroids and discs. Elliptical galaxies are dominated by a single spheroidal component, while most spiral and lenticu-lar galaxies contain both a spheroid (the bulge) and a disc. The striking difference between galaxy types may primarily be a result of variation in the relative prominence of the spheroid and disc components.
A common way of describing the structure of galaxies is through the S´ersic indexn, which describes the radial concentration of the projected light distribution. The Sersic (1968) function is given by
I(r)=Ieexp
−bn r Re 1/n −1 ,
whereReis the effective radius (that is, the radius containing half of the model light),Ie is the intensity at the effective radius,nis the S´ersic index andbnis a function of S´ersic index and is such
that(2n)=2γ(2n,bn), whereandγrepresent the complete and
incomplete gamma functions, respectively (Ciotti1991). Andrae, Melchior & Jahnke (2011) showed that this is the simplest function one could consider to model a galaxy profile, being the first-order Taylor expansion of any real light profile. Whennis equal to the values 0.5, 1 and 4 (andbn assumes the values of 0.676, 1.676
and 7.676, respectively), the S´ersic profile is equivalent to a Gaus-sian, exponential and de Vaucouleurs profile, respectively. A S´ersic
projected profile implies a 3D luminosity density profile involving the FoxHfunction (Baes & van Hese2011).
Elliptical galaxies are typically regarded as single-component structures; hence,nis a reasonably fundamental description of the profile (but see Cappellari et al. 2011and Huang et al.2013a). However, when fitting a single-S´ersic profile to a disc galaxy, the resultingnreflects the contribution of both the disc and the bulge to the light distribution.
We note that some degeneracy exists, in that appropriate small variations inReandncan produce similar surface brightness pro-files, which are indistinguishable at the resolution and depth of the data we consider. The two quantities are also found to be correlated in the galaxy population. However, e.g. Trujillo, Graham & Caon (2001) showed that the correlation betweennandReis definitely not explained by parameter coupling in the fitting process; this trend between galaxy structure and size exists also when one uses model-independent values. Indeed, it is a natural consequence from the relations existing between the model-independent parameters: total luminosity, effective radius and effective surface brightness.
All galaxies show variations in colour to some degree. These often appear as radial colour gradients, with the centres of galaxies generally redder than their outer regions (at least in the more lu-minous galaxy population; Jansen et al.2000). Even the colour of elliptical galaxies varies significantly with radius (e.g. La Barbera et al.2010a).
Colour gradients provide important information for understand-ing how galaxies form and evolve. For example, steep gradients are expected when stars form during strongly dissipative (monolithic) collapse in galaxy cores. In such a scenario, gas is retained by the deep potential well, with consequently extended star formation ac-tivity and greater chemical enrichment of the inner regions (e.g. Kobayashi2004).
In early-type galaxies, the main driver of colour gradients is probably metallicity (see, e.g., Saglia et al.2000; Tamura & Ohta
2000; La Barbera et al.2003; Spolaor et al.2009; Rawle, Smith & Lucey2010; den Brok et al.2011and references therein), even though the contribution of the age (see, e.g., La Barbera et al.2002,
2012; La Barbera & de Carvalho2009) and even dust (see, e.g., Guo et al. 2011; Pastrav et al. 2013a) cannot be ignored. Struc-turally, ellipticals may appear to be single-component systems, but that component certainly does not possess a homogeneous stellar population.
Colour gradients are typically stronger in bulge–disc systems. Bulges tend to contain older, redder stars of higher metallicity than those found in the discs of galaxies (e.g. Johnston et al.2012and ref-erences therein). Shorter optical wavelengths are more sensitive to the young, blue populations typically found in discs, whereas longer (optical and NIR) wavelengths increasingly trace the old stellar population of both components. Most late-type galaxies therefore display a substantial colour gradient from red centres to blue out-skirts (de Jong1996b; Gadotti & Dos Anjos2001; MacArthur et al.
2004), though peculiar galaxies can show opposing trends (Taylor et al.2005).
In addition to stellar population gradients, the dust content of a galaxy can produce colour gradients and influence the mea-sured structural parameters in a wavelength-dependent manner (Peletier & Balcells 1996; M¨ollenhoff, Popescu & Tuffs 2006; Graham & Worley2008; Kelvin et al.2012; Pastrav et al.2013a; Rodr´ıguez & Padilla2013). However, it remains unclear whether dust attenuation or stellar population gradients are the dominant factor in determining how observed galaxy structure varies with wavelength.
at University of Nottingham on July 12, 2016
http://mnras.oxfordjournals.org/
Park & Choi (2005) have shown how colour gradients may be used as a morphological classifier, while Lee et al. (2008) found that steeper colour gradients appear within star-forming galaxies, in both late and early types. Atypical gradients can be used to identify interesting populations. For example, Suh et al. (2010), studying early-type galaxies drawn from the Sloan Digital Sky Survey (SDSS) DR6, found a tight correlation between the exis-tence of steep colour gradients and centrally concentrated residual star formation. They suggest a relation such that elliptical galaxies with bluer cores present globally bluer colours than average. Fer-reras et al. (2009) found the same relation for spheroidal galaxies observed by theHubble Space Telescopeat 0.4< z <1.5.
Most of the studies mentioned so far have focused on measuring radial colour gradients, rather than considering how their profile shapes depend on wavelength. However, variations in colour with radius directly imply that the light profile must change with wave-length, in terms of varyingnandRe.1In general, therefore, the values
measured fornandRewill depend on the observed wavelength. Some works have started investigating the wavelength depen-dence of galaxy structure, fitting S´ersic models independently to images in different wavebands. La Barbera et al. (2010a) presented for the first time a careful analysis of the structural parameters of low-redshift early-type galaxies as a function of wavelength. They showed thatRedecreases by 35 per cent from the optical to the NIR, reflecting the internal colour gradients in these systems. Their S´ersic indices span a domain from∼2 to 10, with a median of six for all wavebands. Kelvin et al. (2012) presented similar two-dimensional, single-S´ersic model fits to a large sample of low-redshift galaxies. They found that the mean S´ersic index of early types shows a smooth variation with wavelength, increasing by 30 per cent from
gthroughK, while the effective radius decreases by 38 per cent across the same range. In contrast, late types exhibit a more ex-treme change in S´ersic index, increasing by 52 per cent, but a more gentle variation in effective radius, decreasing by 25 per cent. These trends are interpreted as due to the effects of dust attenuation and stellar population/metallicity gradients within galaxy populations.
When fitting images at different wavelengths, completely inde-pendently, statistical and systematic variations in the recovered cen-tre, ellipticity, position angle, etc. will translate into noise in the recovered trends fornandRe. This is particularly an issue if one wants estimates of the wavelength dependence of structure on a galaxy-by-galaxy basis. To address this, some parameters may be fixed to fiducial values, while the parameters of interest are allowed to vary. However, it is not clear how to fairly determine such fiducial values.
In this paper, we build upon the work of La Barbera et al. (2010a) and Kelvin et al. (2012), by fitting a single, wavelength-dependent model to all the data simultaneously. This is made possible using an extended version ofGALFIT(Peng et al.2002,2010) developed by the MegaMorph project (Bamford et al.2012; H¨außler et al.2013, hereafterH13; Vika et al.2013; Bamford et al., in preparation). This approach maximizes the signal-to-noise (S/N) available to constrain the model and ensures that the parameters are optimal for the whole data set. The greatest advantages of this approach are expected when decomposing galaxies with multiple components (e.g. Cameron et al. 2009). Making colour information available to the fit in-creases the robustness with which the components can be separated,
1Of course, it may also depart from a S´ersic profile, but if we assume S´ersic profiles at all wavelengths – as is reasonably well justified (Andrae et al.
2011) – then most variations will be captured by changes innandRe.
and hence improves the accuracy and physical meaningfulness of their recovered parameters. However, to begin, we have explored the performance of our technique in fitting single-component mod-els.H13have tested the new method on large data sets, automating both the preparation of the data and the fitting process itself by extending the existingGALAPAGOS(Barden et al.2012) code. Vika
et al. (2013), on the other hand, studied nearby galaxies and as-sessed our method by fitting artificially redshifted versions of these galaxies.
Having at our disposal structural parameters obtained via a con-sistent multiwavelength approach from MegaMorph, we can now study the wavelength dependence of S´ersic index and effective ra-dius for both individual galaxies and sample populations. In this paper, we quantify these trends using the ratio ofnandReat two wavelengths. These ratios provide a simple but powerful parametric way of considering galaxy colour gradients, which reveal informa-tion about the prevalence of galaxies with different internal struc-tures, and how this varies with other galaxy properties. At a more practical level, quantifying hownandRevary with wavelength is crucial for removing biases when comparing measurements made using different bandpasses or at different redshifts.
The paper is organized as follows: in Section 2, we present the data set used for the analysis and describe the properties of the sample we analysed. In Section 3, we show our results for the wavelength dependence of S´ersic indices and effective radii, first by considering trends for subsamples of the galaxy population and then by quantifying the behaviour of individual galaxies. In Section 4, we discuss the interpretation of our measurements and demonstrate how they relate to the visual appearance of galaxies. In Section 5, we discuss our results in the context of previous work. Finally, in Section 6, we summarize and present our conclusions.
The analysis has been carried out using a cosmology with (m,
,h)=(0.3, 0.7, 0.7) and AB magnitudes.
2 DATA
2.1 S´ersic models and parent sample selection
The sample of galaxies considered in this paper has been previously presented inH13. A detailed description of the selection criteria, ro-bustness of the fits and properties of our sample can be found in that paper; here, we give a brief overview. Our sample is drawn from the Galaxy And Mass Assembly survey II (GAMA; Driver et al.2009,
2011), the largest homogeneous multiwavelength data set currently available, in terms of both spatial volume and wavelength cover-age. GAMA is primarily a redshift survey, but it is supplemented by a highly consistent and complete set of multiwavelength data, spanning from the far-UV to radio.
The GAMA imaging data include five-band optical (ugriz) imag-ing from SDSS (York et al.2000) and four-band NIR (YJHK) imag-ing from the Large Area Survey (LAS) component of the UKIRT Infrared Deep Sky Survey (UKIDSS; Lawrence et al.2007). All of these bands have a depth and resolution amenable to S´ersic-profile fitting (as demonstrated by Kelvin et al.2012). Conveniently, the images for all nine bands have been ‘microregistered’ on to the same pixel grid (usingSWARP, Bertin et al.2002; Bertin2010, as
described in Hill et al.2011) and rescaled to a common zero-point of 30 mag, which are essential for our purposes.
Our sample is limited to galaxies in one region of GAMA, the equatorial field at 9 h RA (known asG09). The multiwavelength imaging data provided by GAMA are analysed using a modified ver-sion ofGALAPAGOS(Barden et al.2012). This version (GALAPAGOS-2)
at University of Nottingham on July 12, 2016
http://mnras.oxfordjournals.org/
has been adapted for use on multiwavelength, ground-based data, as described in detail inH13. This software enables the automated measurement of wavelength-dependent S´ersic profile parameters for very large samples of galaxies in a homogeneous and consis-tent manner. To fit each galaxy, GALAPAGOS-2 utilizes a recently
developed multiwavelength version ofGALFIT(which we refer to as GALFITM). This extended version ofGALFITwas introduced inH13
and is described in detail in Bamford et al. (in preparation). We refer the interested reader to this paper andH13for further details and technical background reading.
GALFITMfits a single wavelength-dependent model to all the
pro-vided images simultaneously. Rather than fitting the parameter val-ues at the wavelength of each band,GALFITMfits the coefficients of
a smooth function describing the wavelength dependence of each parameter. Specifically,GALFITMemploys Chebyshev polynomials, with a user-specifiable order for each parameter, which controls the desired smoothness of their wavelength dependence. For example, thexandycoordinates of the galaxy centre may be allowed to vary, but remain a constant function of wavelength. Magnitudes could be allowed to vary completely freely, by setting a sufficiently high polynomial order. Other parameters may be allowed to vary at a lower order, providing flexibility to obtain a good fit, while avoid-ing unjustified (physically or by the data quality) variability and reducing the dimensionality of the model.
In the fitting process for this paper, we allow full freedom in magnitudes, while S´ersic index andRe are allowed to vary with wavelength as second-order polynomials. All other parameters (x
and yposition, position angle and axis ratio) are selected to be constant with wavelength.
Amongst other data,GALAPAGOS-2 returns magnitudes (m), S´ersic
indices (n) and effective radii (Re), calculated at the wavelength of each input image. To investigate the reliability of our size determi-nations, we have compared ourRemeasurements to an alternative, less model-dependent estimate of galaxy size. For convenience, we use the standard half-light radius,R50, provided bySEXTRACTOR
dur-ing the initial stages ofGALAPAGOS. This is the radius containing
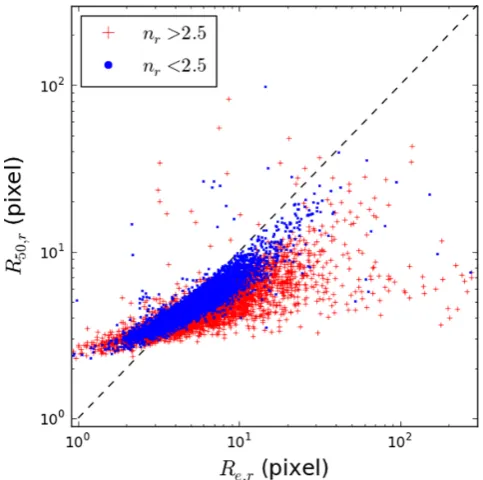
half of the total flux within the Kron aperture (Kron1980; Bertin & Arnouts1996), obtained independently for each bandpass. Fig.1
shows the comparison of these sizes in the rband, for galaxies withnr< 2.5 andnr>2.5. We see very similar relations in all
other bands. There is a clear correlation between the two size esti-mates, but also obvious deviations from a one-to-one line.R50tends to∼2 pixel for small objects, due to the effect of the point spread function (PSF) and pixelization. Both of these are accounted for by the S´ersic fit, and henceResuffers less bias at small sizes. For larger galaxies,R50is consistently smaller thanRe. This is a result of Kron apertures missing flux in the outer regions of galaxies. The half-light radii are thus systematically underestimated. The fraction of missed flux depends on the profile shape (Graham & Driver2005) such that the size is underestimated more, and with greater variation, for highernobjects. S´ersic sizes are therefore often regarded as be-ing more reliable than aperture-based measurements (Graham et al.
2005).
GALAPAGOS-2 also returns the coefficients that describe the
[image:4.595.308.550.55.295.2]poly-nomial wavelength dependence of each parameter. As described below, this function can be used to ‘interpolate’ between the bands, e.g. in order to derive rest-frame values. On high S/N data, one could in principle fit each band independently and then fit a polyno-mial to the individual-band results in order to derive a continuous function of wavelength. On high S/N data, for single-component fits, this would give more or less equivalent results to our approach. However, on lower S/N images, our approach is substantially more
Figure 1. Comparison between the effective radius inrband obtained by
GALFITMand the radius containing half the flux within the Kron aperture inr
band, for the galaxy sample described in Section 2.2. Red crosses: galaxies withnr>2.5. Blue dots: galaxies withnr<2.5. Dashed line represents the
1:1 line.
robust (Bamford et al., in preparation;H13; Vika et al.2013). Nev-ertheless, there are cases where directly using the fit polynomial function to interpolate between bands is inadvisable.
If a high degree of freedom is given to a certain parameter (e.g. magnitude in our case), the polynomial may oscillate between the wavelengths at which it is constrained by data, and especially in regions close to the edge of the wavelength range of the input data. This is a general issue encountered when fitting polynomials, known as ‘Runge’s phenomenon’.2As a consequence, we do not
use the polynomial derived for the magnitudes to directly calcu-late rest-frame magnitudes for all objects. Instead, we recommend using the magnitudes derived for each input band to accurately es-timate rest-frame magnitudes and colours using a stellar population fitting code.
2.2 Our galaxy selection
We match our sample to the GAMA redshift catalogue (SpecObjv21). For the galaxies in the catalogue, we compute abso-lute magnitudes by applying INTERREST (Taylor et al.2009) to our measured photometry. This tool determines rest-frame colours by interpolating the observed photometry, using a number of template spectra as guides (for details, see Rudnick et al.2003).
For S´ersic index and effective radii, the polynomial order is suf-ficiently low that Runge’s phenomenon is not an issue. We can therefore conveniently calculate rest-frame values directly using the respective Chebyshev functions returned byGALFITM, provided
the required wavelength is in the range covered by the input data. For the remainder of this paper, all mentions of wave-length, or ‘band’, refer to rest-frame quantities, unless explicitly stated otherwise.
2This effect is discussed further in Bamford et al. (in preparation).
at University of Nottingham on July 12, 2016
http://mnras.oxfordjournals.org/
As inH13, the catalogue resulting fromGALAPAGOS-2 has been
cleaned in order to select only the objects that have been successfully fitted byGALFITM. In particular, we wish to identify and discard fits
with one or more parameters lying on (or very close to) a fitting constraint. Such a fit is unlikely to have found a true minimum in χ2space and is indicative of a serious mismatch between the
model profile and the object in question. The selection also serves to remove stars from the catalogue. FollowingH13, we extract those galaxies that satisfy the following criteria:
(i) 0<m<40 at all wavelengths, wheremis the total apparent output magnitude in each band.
(ii)minput−5<m<minput+5, whereminputis the starting value of the magnitude in each band. These are derived by scaling an average galaxy SED (obtained from previous fits) by the mag best value measured by SEXTRACTORduring the object detection. As it is
known (e.g. H¨außler et al.2007) thatGALFITis very stable against changing the starting values, such an approach is valid and was easy to implement intoGALAPAGOS-2 (seeH13for details). During the fit, we allow a generous±5 mag variation from these starting values.
(iii) 0.201<n<7.99, since fits with values outside these ranges are rarely meaningful (Vika et al. 2013; though note that some elliptical galaxies are indeed measured to haven>8, e.g. as shown in Caon, Capaccioli & D’Onofrio1993.)
(iv) 0.301<Re<399.0 pixel, which maintains values in a phys-ically meaningful range and prevents the code from fitting very small sizes, where, due to oversampling issues, the fitting iterations become very slow.
(v) 0.001<q≤1.0, whereqis the axis ratio, to ensure that the fit value is physically meaningful. In practice, this constraint is barely ever encountered.
This catalogue cleaning is done on all bands simultaneously, i.e. if any value of the fit fails to meet the above criteria for any band, the entire fit is considered unsuccessful.3
We additionally exclude objects with:
(i) 132.6≤α≤142.0 and−1.55≤δ≤ −0.50; (ii) 135.2≤α≤135.7 and−0.35≤δ≤ +0.20; (iii) 130.0≤α≤131.2 and−2.50≤δ≤ −1.20;
which are objects close to areas for which at least one of the infrared bands (YJHK) does not provide good data quality. The first one of these areas has no data coverage in theJ-band image, the other two are close to very bright stars which caused scattered light in the image, essentially making them unusable in some of the band in these areas. Rather than fitting different galaxies using different combinations of bands, we prefer to maintain a homogeneous data set and excluded galaxies in these areas.
2.3 Galaxy samples
To make quantitative, representative statements, we choose to vol-ume limit our sample. We also wish to demonstrate our ability to obtain meaningful multiwavelength structural measurements with
[image:5.595.317.534.54.216.2]3Please note that the last criterion used in H13 (95−5×mag best <fwhm image and fwhm image<1 pixel) is not used in this paper. The purpose of this cut was to separate (mainly saturated) stars from galaxies in order to derive a cleaner galaxy sample for code testing and comparing single- and multiband fitting techniques. In this paper, this step is not nec-essary as galaxies are selected by a redshift criterion. Avoiding it prevents us from accidentally removing bright, compact galaxies from our sample.
Figure 2. Redshift histogram of our parent sample. Only galaxies with 0.01< z <0.3 are included in the subsequent analysis.
low-resolution data, so we elect to push our sample selection to rel-atively high redshifts. We therefore focus on the intrinsically bright galaxy population in this paper.
Fig. 2shows the redshift histogram of all galaxies in theH13
sample with a reliable spectroscopic redshift estimate. We limit our analysis to galaxies at 0.01< z <0.3. For the selected redshift range, the rest-frame equivalents of all bands up to and includ-ingHare within the observed (u−K) wavelength range, and thus their values can be interpolated. The rest-frame equivalent for our reddest observed band,K, is obviously always extrapolated, hence unreliable, and we therefore exclude it from our analysis.
The nominal apparent magnitude limit of the GAMA II redshift survey isr<19.8 mag, which corresponds to a total absolute magni-tudeMr<−21.2 mag atz <0.3. Imposing this absolute magnitude
limit gives us a complete, volume-limited sample of 14 274 galax-ies. Note that this selection means that our results are limited to the relatively high-luminosity galaxy population.
The aim of this paper is to carefully analyse how galaxy structural parameters change as a function of wavelength. We expect different types of galaxies to behave in contrasting ways. We therefore sepa-rate galaxies according to their colour and structure. Throughout the paper, we use the rest-frame (u−r)rfcolour, and ther-band S´ersic
index,nr, as our reference for separating populations. The choice
of colour is not critical. However, bracketing the 4000 Å break, (u− r)rf performs well for separating red and blue populations,
despite the noisiness in the SDSSuband. After some experimen-tation,nrturned out to be the best choice for separating high- and
low-concentration populations, which roughly correspond to early-and late-type morphologies in our luminous galaxy sample. Choos-ing (u−r)rfandnralso facilitates comparison with previous SDSS
studies.
Fig.3plots colour versus S´ersic index for our sample. These are clearly correlated, and the well-known bimodality (e.g. Kauffmann et al.2003; Driver et al.2006) is evident. Galaxies may be optimally divided into two types using a sloping cut in this plane. However, we find it is informative to study the behaviour with respect to colour and S´ersic index in more detail, and thus apply selections to these two quantities independently. We empirically divide galaxies into red and blue using the cut (u−r)=2.1. Traditionally, the division by colour also includes a magnitude dependence; however, this is a small effect, particularly at the bright magnitudes considered in this paper. To avoid complicating our analysis, we prefer this simple cut. In addition to separating red and blue galaxies, we are also
at University of Nottingham on July 12, 2016
http://mnras.oxfordjournals.org/
Figure 3. (u−r)rfversusnrfor the galaxies in our sample. Lines illustrate
[image:6.595.53.278.316.373.2]the cuts we apply to divide the galaxies by colour and S´ersic index.
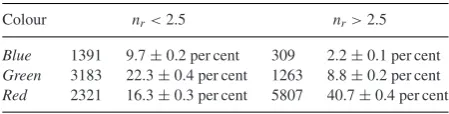
Table 1. Number count and fraction (of the total sample) for galaxies with different combinations of colour and S´ersic index. Errors are binomial. The choice of the band adopted for the S´ersic index separation does not considerably alter the fractions.
Colour nr<2.5 nr>2.5
Blue 1391 9.7±0.2 per cent 309 2.2±0.1 per cent
Green 3183 22.3±0.4 per cent 1263 8.8±0.2 per cent
Red 2321 16.3±0.3 per cent 5807 40.7±0.4 per cent
interested in the bluest population, which may host starbursts. We therefore further subdivide the (u−r)<2.1 population into ‘green’ and ‘blue’ galaxies, using a cut at (u−r)=1.6. We note that our ‘green’ galaxies do not correspond to what is commonly understood as the ‘green valley’, between the blue and red modes. We simply adopt this name to describe objects with blue, but not extremely blue, colours. Henceforth, we use italics to explicitly indicate when we are referring to thered,greenorbluesamples.
We further divide galaxies by S´ersic index, with the aim of better separating disc galaxies from ellipticals. Following previous works (e.g. Barden et al.2005), we adopt a cut ofnr=2.5. From now on,
we will refer to ‘low-n’ galaxies withnr<2.5 and ‘high-n’ galaxies
withnr>2.5.
With these combined cuts, we can compare the two main galaxy populations:green low-nsystems, which correspond to star-forming, disc-dominated galaxies, andred high-nsystems, which are typically passive spheroid-dominated galaxies. We can also ex-amine the properties of galaxies which do not respect the majority behaviour.
We caution the reader that these definitions do not extend down to the fainter dwarf galaxies. Our sample selection is limited to luminous galaxies, so trends discussed in this paper do not represent the faint population.
Table1summarizes the fraction of galaxies corresponding to our different colour and S´ersic index selections. As expected, mostred
galaxies (∼70 per cent) are characterized by large values of S´ersic index, while the vast majority ofblue (∼82 per cent) andgreen
galaxies (∼73 per cent) display small values of S´ersic index. In the next section, we study how the structural properties of galaxies, characterized by different colours and surface brightness profiles, vary with wavelength.
3 R E S U LT S
Trends in galaxy properties with wavelength may be studied from two perspectives. One can investigate correlations for an entire galaxy population, or measure variations in individual galaxies. The first approach is useful when the variations in individual galaxies are noisy. Combining large samples allows one to identify trends which would be obscure for individual objects. Such population trends do not guarantee that galaxies individually follow the average trend, but they can place constraints on the range of variation for individual galaxies. Averaged trends also do not allow one to easily select subsamples with specific properties. The second approach is possible when one has sufficiently reliable measurements. In this case, it is preferable to study the distributions of those measurements directly. In this way, one can examine how consistent the trends are across the galaxy population and isolate subsamples with different behaviour.
We first consider trends in S´ersic index and effective radius versus wavelength, averaged across various subsets of the galaxy popula-tion. We then consider the distributions of these trends for individual galaxies. These individual measurements allow us to study correla-tions of the trends with other quantities, and consider their use in classifying galaxies. We show that the population trends, like those presented by La Barbera et al. (2010a) and Kelvin et al. (2012), do successfully capture the typical wavelength variation of S´ersic index and effective radius in individual galaxies. Finally, we investi-gate the correlations between wavelength variations in S´ersic index and effective radius, finding highly contrasting behaviour for early-and late-type galaxies.
This section will focus on presenting the observed variation of S´ersic index and effective radius and their respective ratios at dif-ferent wavelengths. First, we consider S´ersic index and effective radius individually in Sections 3.1 and 3.2, respectively. Then, in Section 3.3, we examine correlations between their behaviour. In Section 4, we will confirm the meaning of our results, and discuss their interpretation, with the aid of stacked images.
3.1 Wavelength dependence of the S´ersic index 3.1.1 Population trends
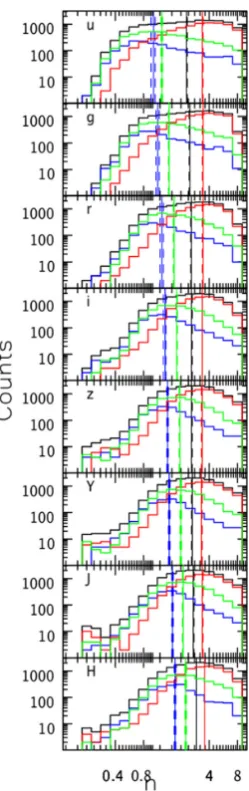
To begin, we examine the distribution of S´ersic index and its varia-tion with wavelength, for a variety of samples. We first consider the overall galaxy population divided using the colour cuts described in Section 2.3. These distributions are plotted for each passband in Fig.4. The wavelength dependence of the S´ersic index distribu-tion for the full magnitude-limited sample of GAMA galaxies has previously been presented by Kelvin et al. (2012), based on inde-pendent fits to each band. Kelvin et al. also divide into spheroid-and disc-dominated systems using a joint cut on (u−r) andnK.
Here, we show in Fig.4, a volume-limited sample with measure-ments obtained using our multiband method, meaning that we have measurements in every band for the whole sample. Furthermore, unlike Kelvin et al. (2012), we divide populations using colour alone, which results in a less clean division of galaxy type, but avoids the ambiguity of plotting distributions for samples that have been selected using the plotted quantity. Despite these differences, the behaviour we see is very similar to that found by Kelvin et al. (2012).
As it is well known, and also as seen in Fig.3, galaxies of differ-ent colour are characterized by very differdiffer-ent S´ersic index distribu-tions: the median S´ersic index across all wavelengths is 3.39±0.07,
at University of Nottingham on July 12, 2016
http://mnras.oxfordjournals.org/
Figure 4. S´ersic index distribution for our full sample (black line) and for galaxies in each of our colour subsamples (red,green,blue). Each panel shows the distribution in a different band:ugrizYJH. The median of each distribution, and its uncertainty, are indicated by vertical solid and dashed lines, respectively. The median S´ersic index forredgalaxies does not depend on wavelength, while for ourgreenandbluesubsamples, the S´ersic index increases significantly towards redder wavelengths.
1.8±0.3 and 1.4±0.2 forred,greenandbluegalaxies, respec-tively. The quoted uncertainties on the median are estimated as 1.253σ/√N, whereσ is the standard deviation about the median andNis the number of galaxies in the sample under consideration (Rider1960).
In addition to their different medians, Fig.4shows that theblue
[image:7.595.319.535.54.225.2]andredsamples are skewed in opposite directions. Thegreen sam-ple follows the same distribution as thebluesample atlow-n, but has a higher proportion of high-n objects. Galaxies of different colour thus dominate at different S´ersic indices. Colour is therefore a reasonably good predictor of galaxy structure, and vice versa. However, remember that often we wish to study colour (e.g. as an indicator of star formation history) versus galaxy structure, and so frequently need to identify galaxies with contrasting structure with-out reference to their colour. Also, note that there is a significant region of overlap at intermediate S´ersic index, where the majority of galaxies are found.
Figure 5. Median S´ersic index as a function of wavelength for ourred,
greenandbluegalaxy subsamples. Error bars represent the uncertainty on the median. Solid lines indicate the 16th- and 84th-percentiles of the distribution. Theredsubsample clearly behaves differently to ourgreenand
bluesubsamples: the S´ersic index of red galaxies is very stable across all optical–NIR wavelengths, while S´ersic index shows a steady increase with wavelength for bluer galaxies.
The overall distribution becomes more strongly peaked and moves to higher values ofnwith increasing wavelength. A similar trend is observed for each of thered,greenandbluesubsamples. However, whereas the whole distribution shifts forblueandgreen
galaxies, the only change forredgalaxies is a slight decline in the proportion oflow-ngalaxies. The mediannfor red galaxies is there-fore almost perfectly constant with wavelength, while the medians for the bluer samples vary significantly. Many blue galaxies must significantly change appearance from theuto theHband.
Having examined the full distributions in Fig.4, we present the variation in median S´ersic index as a function of wavelength more compactly in Fig. 5. The lack of variation in S´ersic index with wavelength forredgalaxies indicates that they principally comprise one-component objects, i.e. elliptical galaxies, or two-component galaxies in which the components possess very similar colours, i.e. lenticulars. In contrast, the systematically lower values and more substantial trends exhibited bygreenandbluegalaxies are consis-tent with them being two-component systems, comprising both a blue, low-ndisc and red, high-nbulge, with the disc being more dominant for bluer galaxies. Of course, various other types of galax-ies may be present in the galaxy population, e.g. spirals with blue, low-nbulges; but the simple picture above might be enough to ex-plain much of the behaviour displayed by the samples we consider. However, at least some of the variation in S´ersic index with wavelength could also be attributed to dust attenuation. The low S´ersic index and blue colours of these systems may indicate that they contain star-forming discs. An increase in S´ersic index with wavelength is in qualitative agreement with predictions of the effect of dust from radiative transfer models of galaxy discs (Pastrav et al.
2013a).
Finally, the observed trends may include variations in the disc stellar population (i.e. age and metallicity) with radius (as found by Beckman et al.1996; de Jong1996b; Pompei & Natali1997; Waller et al.2003; MacArthur et al.2004). However, it is not clear whether such gradients would manifest themselves as variations in S´ersic index with wavelength.
We remind the reader that in the above analysis we have not ap-plied any cut inn: a cut in the colour–magnitude plane results in
at University of Nottingham on July 12, 2016
http://mnras.oxfordjournals.org/
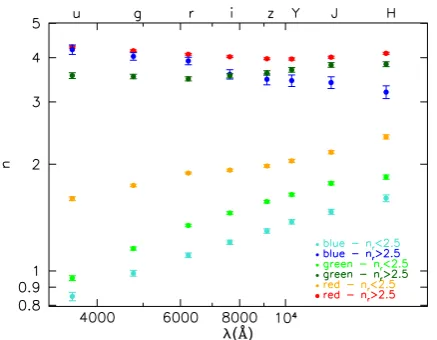
Figure 6. Median S´ersic index as a function of wavelength for galaxies of different colour and S´ersic index. Red, dark green and blue symbols represent
high-ngalaxies; orange, light green and turquoise symbolslow-ngalaxies. Error bars represent the uncertainty on the median. Differences between
low-nandhigh-ngalaxies are striking: the S´ersic index forhigh-nobjects only slightly depends on wavelength and it is systematically higher than the S´ersic index oflow-ngalaxies, which strongly depends on wavelength.
a natural separation of galaxies with small and large S´ersic index. However, the correlation is not perfect, as is clear from Fig.3. As previously mentioned, Kelvin et al. (2012) address this by defining a joint cut in (u−r) versusnKto divide all galaxies into one of two
classes. We build on their analysis by taking a complementary ap-proach. Objects with combinations of colour and S´ersic index con-trary to the majority, e.g. red spirals and blue ellipticals, potentially correspond to interesting stages of galaxy evolution. Studying these may illuminate the physical processes responsible for the structural and star formation histories of galaxies. We therefore proceed by considering subsamples defined by independent cuts in both colour and S´ersic index, as described in Section 2.3.
Fig.6shows the dependence of median S´ersic index on wave-length for these six different populations. The different behaviour of galaxies with low and high S´ersic index is striking.High-ngalaxies consistently display much less S´ersic index variation with wave-length thanlow-ngalaxies.Red,high-ngalaxies show no signifi-cant dependence on wavelength (in agreement with the results of La Barbera et al.2010afor early-type galaxies). The median value across all wavelengths is 4.10±0.09. Therefore, on average, they possess a classic de Vaucouleur profile at all wavelengths.Green
andbluegalaxies withhigh-nshow a mild dependence on wave-length. Both have a median S´ersic index of∼3.5, and are equal in theiband. However, the mediannforblue(high-n) galaxies de-creases towards redder wavelengths (the Pearson product–moment correlation coefficient isr= −0.98, indicating a high significance), whilegreen(high-n) galaxies show the opposite trend, increasing towards redder wavelengths (r=0.8, significant at the 99 per cent level). This interesting contrast, which is also seen for individual galaxies in the next section, is our main motivation for considering
greenandbluegalaxies as separate samples.
Forlow-ngalaxies, the median S´ersic index shows a substantial trend with wavelength, increasing from theutoHband. The median S´ersic index and the strength of its variation with wavelength de-pend on the colour of the population considered. The median value systematically increases frombluetogreentoredgalaxies, while the strength of the trend with wavelength is similar forblueand
greensamples, but shallower forredgalaxies. Comparing to Fig.5,
it is apparent that adopting a cut only in colour mixes populations and thus loses useful information.Blueand green galaxies with
high-nactually show similar trends to the overallredpopulation, although they number too few to influence the trends when no cut in S´ersic index is applied. Similarly, the trend forredgalaxies with
low-nresembles those ofblueandgreengalaxies.Low-ngalaxies make up a significant proportion of the red population, and thus they substantially reduce the median value of red galaxies when S´ersic index is not taken into account. The degree of variation of S´ersic index with wavelength is more closely related to the overall value of S´ersic index than to colour.
The adopted S´ersic index cut atnr=2.5 does not appear to
sig-nificantly alter the trends we recover for thelow-nandhigh-n pop-ulations. Thendistributions for each colour sample are sufficiently distinct and narrow that only a small fraction of each distribution is affected by the S´ersic index cut. This is apparent from the observa-tions that the standard deviaobserva-tions of theredandgreendistributions only just cross in Fig.5, and the average of thered,low-nsample in Fig.6extends to almostn=2.5 in the Hband, without any sign that the trend is being suppressed. Given that our subsample definitions are based on S´ersic indices in only one band (r), it is also reassuring to note that the spheroidal population retains high S´ersic index values across all wavelengths. This indicates that performing the S´ersic index separation in different bands would not substan-tially affect the samples, nor the above results. However, Fig.6does suggest that separating in bluer bands, where the populations are better separated, is advisable.
3.1.2 S´ersic index versus wavelength for individual galaxies
The analysis we have presented so far considered average trends across a sample of galaxies. If all galaxies in a given sample be-have in the same way, then the trends in the average do reflect the trends in the individual galaxies. However, there is the possibility that individual galaxies have behaviours which cannot be easily identified from the distributions of S´ersic index in different bands. For example, if the averagenfor a sample does not change between two bands, it could be that all the constituent galaxies have con-stantn, but it is also plausible that half the galaxies increase their
nwhile the other half decrease, or that most remain constant while a minority display a significant trend, etc. We have already seen such behaviour when dividing by colour: different trends have been revealed for particular subsamples. In this case, we were able to discover this by dividing by S´ersic index, but ideally we would like to look for such trends directly in the full sample.
In this section, we aim to explore the wavelength dependence of S´ersic index for individual galaxies. This is difficult when fitting galaxies independently in each band. However, as shown byH13, our multiband method dramatically reduces the noise on such mea-surements and avoids cases where galaxies are successfully fitted in some bands, but not in others.4
We thus have measurements of S´ersic index in every band for all objects in our sample. With this information, it is possible to devise various ways of quantifying the wavelength dependence of S´ersic index. In this paper, we take the conceptually and computationally simple approach of comparing values at particular pairs of wave-lengths, by taking their ratio. We will investigate what these ratios
4We have confirmed this by making versions of the figures in this paper based on single-band fits. These all contain dramatically fewer objects which pass our quality control cuts, and the distributions show much larger scatter.
at University of Nottingham on July 12, 2016
http://mnras.oxfordjournals.org/
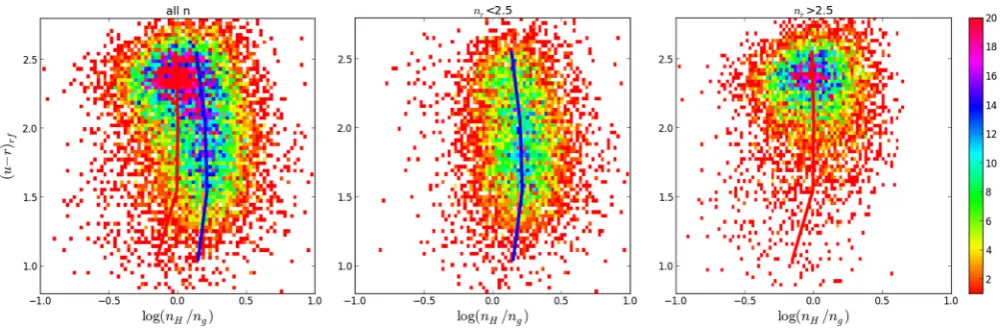
Figure 7. Density map of (u−r) colour versus the ratio of theH-band S´ersic index andg-band S´ersic index, defined here asNgH=nH/ng. The left-hand
panel displays all galaxies together, while centre and right panels show only galaxies with low and high S´ersic indices, respectively. The medianNgHas a
function of colour is also plotted, for both thelow-n(blue line) andhigh-n(red line) samples. These two populations show different distributions, indicating that their constituent galaxies possess different internal structures.High-ngalaxies haveN∼1, indicating that the central concentration of their profile tends not to change with wavelength. On the other hand,low-ngalaxies generally display peakier profiles in the red, particularly those with intermediate colour.
can tell us about the correlations between galaxy stellar populations and spatial structure.
For compactness, we adopt the notationNbr=n(r)/n(b), where
n(r) andn(b) are the S´ersic indices in some (rest-frame) red and blue band, respectively (we thus generally maintain the same convention as colour). Using a ratio, rather than a difference, is appropriate, as the physical distinction between profiles separated by constant
ndecreases for largern; i.e. there is more ‘difference’ between
n=1 and 1.5 profiles, than betweenn=4 and 4.5 profiles. This is the same reason whynis usually plotted with a logarithmic scale. However, the use of a ratio results in asymmetric behaviour when plotted linearly: low ratios are confined to between 0 and 1, while high ratios may extend to infinity. To avoid this, we usually plotNon a logarithmic scale. These choices result in distributions that look much more symmetrical and Gaussian than otherwise, justifying our approach.
We begin by inspecting how galaxy colour varies withN, and specifically focus on the dependence of (u−r) on NgH =nH/ng.
This combination of bands (Handg) is favoured here, and through-out the paper, as it is the pair with the longest robust wavelength baseline (uis noisy andKis extrapolated).
The left-hand panel of Fig.7shows that the colour bimodality is accompanied by a shift of the blue population to higher values ofNgH than the red population. The remaining two panels divide the sample by S´ersic index, and demonstrate thatlow-nandhigh-n
galaxies display different distributions in this diagram. Forlow-n
galaxies, which span a wide range of (u−r), the medianNgH at any colour is greater than one. This agrees with thelow-nsample being disc galaxies, comprising a bluen=1 disc and redn>1 bulge such that the disc is more prominent ingthan inH. Although subtle, a curve is apparent in the medianNgHversus (u−r).Low-n
galaxies with intermediate colours have the greatest variations of S´ersic index with wavelength, consistent with the bulge and disc being of similar prominence, but differing colour, in these systems. In contrast, thehigh-ngalaxies, which are mostly red, display a distribution that is centred onNgH∼1, indicating that the profile of these galaxies is similar at all wavelengths. There is a tail ofhigh-n
galaxies to blue colours, which tend to haveNgH<1. This suggests thatblue,high-ngalaxies have peakier profiles at blue wavelengths, possibly indicating the presence of a central starburst.
The segregation of galaxy populations seen in Fig.7suggests thatNcould be used as a proxy to separate galaxy types or identify specific populations. For example, ‘red spirals’, disc galaxies with suppressed star formation, should possess a disc with similar colour to their bulge. They may therefore be isolated from early-type spi-rals, with comparable colour and S´ersic index, by their lowerN.
However, we reiterate that our definitions ofblueversusredand
low-nversushigh-ndepend on our sample selection and adopted magnitude cut. Our present results are therefore limited to the in-trinsically bright galaxy population.
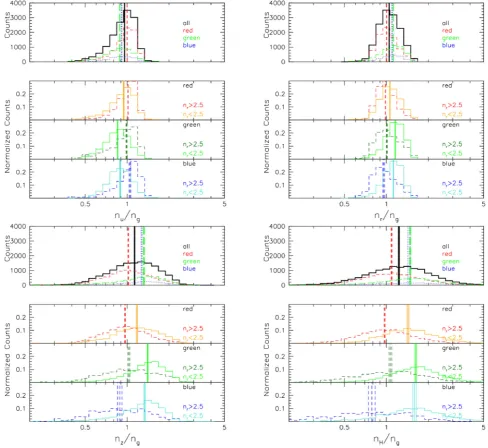
So far we have focused on NgH, but now we consider other combinations of bands, keepinggas our reference, to be sure that our conclusions are not driven by a particular choice of the bands. Fig. 8shows the distributions of Ngu, Ngr, Ngz, NgH. We chose to showu,zandHas examples because they are the bluest, the intermediate and the reddest bands, respectively, andrbecause it is the band we use to define ourlow-nandhigh-nsamples. As well as showing the overall distributions we also divide by colour and S´ersic index, as described in Section 2.3.
The distributions are unimodal, with widths that strongly depend on the passbands involved: the redder the wavelength (relative tog), the broader the distributions. This is somewhat inevitable given that observations at neighbouring wavelengths will be dominated by the same stellar population, while longer wavelength baselines permit greater variability. In addition, the S´ersic index has been constrained to vary as a smooth polynomial, which will act to suppress large variations between neighbouring bands. Focusing only on colours (upper subpanels), N forred galaxies always remains close to 1, as does N forblue and greengalaxies for short wavelength baselines. Increasing the wavelength range spanned (gversus z andHbands),blueandgreengalaxies have systematically higher
Nthanredgalaxies, and are thus easier to differentiate, despite the increasing width of theN distributions.
Further separating galaxies forn(lower subpanels), we see that thelow-nandhigh-nnormalized distributions differentiate, at any fixed colour. As for colour, the difference betweenlow-nandhigh-n
is more evident with longer wavelength baselines. Forredgalaxies, the width of the N distributions are very similar for low-nand
high-ngalaxies, at any wavelength. However, forgreenandblue
objects, the high-n distribution is significantly broader than for
at University of Nottingham on July 12, 2016
http://mnras.oxfordjournals.org/
Figure 8. Distributions ofNfor a representative selection of bands. The four groups of panels show (1)Ngu, (2)Ngr, (3)Ngzand (4)NgH. Within each group,
the upper panel (a) shows the distribution ofNfor the sample overall and divided by colour, without taking into account the S´ersic index. The lower windows show the normalized histograms ofNforlow-nandhigh-ngalaxies, forred(b),green(c) andblue(d) samples separately.
low-n, particularly for long wavelength baselines. Objects with high S´ersic index and blue colours appear to be a varied population, although the bluest examples are rare, and hence their distribution is uncertain.
We note that at any wavelength,green high-ngalaxy trends re-semble those ofred high-ngalaxies, whilegreen low-ngalaxy trends resemble those ofblue low-ngalaxies, further indicating that our
greensample mixes objects with different structural properties. To assess the differences between the different distributions, we perform a Kolmogorov–Smirnov (K–S) test on each pair. The K–S tests indicate that all the subsamples are drawn from differ-ent pardiffer-entN distributions, except forblueandgreengalaxies with
low-n, suggesting that these galaxies share common properties. As was done for S´ersic index in Fig.6, we show the variation in medianNas a function of wavelength,λ, more compactly in Fig.9. All the ratios are normalized to thegband. Points represent the
Median of theNgxvalues for the galaxies in each subsample, where
xis the band corresponding to wavelengthλ. For comparison, the lines in this figure show the ratio of the mediann(g) to the me-diann(x) (as individually plotted in Fig.6). One can see that, as expected statistically, the medianNreveals the same behaviour as considering the ratio of the median trends inn. Fig.9is therefore an alternative way of presenting Fig.6. The unimodality of the dis-tributions in Fig.8and the consistency shown in Fig.6support the use of population trends to study the variation of galaxy structure with wavelength. However, remember that theNquantifies the de-pendence of S´ersic index on wavelength forindividualgalaxies in a robust manner.
Galaxies with different S´ersic indices and colours follow differ-ent trends. Forgreenandbluegalaxies withlow-n,N correlates strongly with wavelength such that S´ersic index is higher at redder wavelengths.Red,low-ngalaxies display a weaker correlation with
at University of Nottingham on July 12, 2016
http://mnras.oxfordjournals.org/
Figure 9. Median values ofNgxas a function of wavelength, wherex
de-notes the band corresponding to wavelengthλ. As indicated by the legend, red, dark green and blue symbols and lines representhigh-ngalaxies; or-ange, light green and turquoise symbols and lines representlow-ngalaxies. MedianNgx=nx/ngare plotted by points. Error bars give the uncertainty on
the median. Lines plot median[nx]/median[ng], i.e. the points from Fig.6
normalized to thegband. The black dashed line represent the wavelength dependence ofNfor a disc population due to the effects of dust, as predicted by Pastrav et al. (2013a). We do not plot the prediction for theuband since it has not been calculated in the model, but it is a linear interpolation from theBband to the near-UV. The trends depend on both colour and S´ersic index, indicating that the typical internal structure differs for galaxies in each population.
wavelength, while forgreen,high-nobjects, it is weaker still, and entirely absent for red, high-ngalaxies. Finally, forhigh-n, blue
galaxies,N anticorrelates with wavelength. This behaviour is con-sistent with a progression from galaxies containing significant red bulge and blue disc components, to bulge–disc systems that are in-creasingly dominated by a red bulge, or contain components with less contrasting colours, to galaxies possessing a single component, or homogeneous colour, and finally to systems with a bulge bluer than their disc.
As mentioned earlier, the relative prominence and colour of bulges and discs are unlikely to completely explain the trends we see. Even in pure exponential disc systems, dust attenuation can re-sult in measured S´ersic indices that vary with wavelength. In Fig.9, we overplot the wavelength dependence ofNexpected for a disc population due to the effects of dust, as computed by Pastrav et al. (2013a) from the radiative transfer model simulations of Popescu et al. (2011). Their model is for the disc in a typical spiral galaxy, with inclinationi=60◦and centralB-band face-on optical depth
τf
B =4 (see their fig. 25). Note that since Pastrav et al. (2013a) did
not calculate the model for theuband, but simply linearly inter-polated from theBband to the near-UV, we do not consider the value for theuband. Their prediction lies below the majority of our disc-dominated (low-n) galaxies, but is consistent with the trend for ourred,low-nsample. This suggests that dust may be responsible for part, but not all, of the trends forlow-ngalaxies.
In the above analysis, we have seen that galaxies with high S´ersic indices typically have smaller variations in S´ersic index with wave-length. We demonstrate this explicitly in Fig.10by plottingNgH versusnr. This plot shows that galaxies withnr∼4 haveNgH∼1 on
average, though with a significant scatter. While departures to lower
nrare consistently associated with a trend to higherNgH, the
corre-lation also continues tonr>4 and lowerNgH. This would appear to
Figure 10. MedianNgHas a function ofnrfor galaxies with each colour and
S´ersic index subsample, coloured as indicated in the legend. Small points show individual galaxies, while larger points indicate the median in bins ofnr. Error bars represent the uncertainty on the median. The dashed line
shows theNgH=1.
indicate thatalltruly homogeneous, one-component systems have
n∼4 at all optical and NIR wavelengths. However, our sample is limited to intrinsically luminous galaxies, and such a conclusion would be at odds with the established magnitude–S´ersic index re-lation for elliptical galaxies (e.g. Graham & Guzm´an2003, and references therein). It will be interesting to explore this result over a wider luminosity range. Finally, we note again that bluehigh-n
objects tend to haveNgH<1, and hence become more concentrated at bluer wavelengths, indicative of central star formation.
Many of the results in this subsection echo those we found ear-lier by considering the population trends, which are less reliant on multiband fits. However, by reliably measuring the wavelength de-pendence of S´ersic index,N, for individual galaxies, we are able to study the distribution ofN, rather than simple averages, and even select objects with contrastingNvalues.
Next, we consider the wavelength dependence of the effective radius in a similar manner to above, before considering the joint behaviour ofnandRe.
3.2 Wavelength dependence of the effective radius 3.2.1 Population trends
The effective, or half-light, radius is simply a measure of the size, and thus not normally considered to represent galaxy structure di-rectly. However, the amount by which the size of a galaxy varies can be due to its inclination, and hence it depends on the opacity, or to its internal structure. In particular, depending upon the wavelength considered, it reveals radial variations of colour, and hence stellar population or attenuation, within a galaxy. These may be related to the presence of multiple structural components with different colours, e.g. a red bulge and blue disc, or gradients within a single structural element.
In this section, following the same approach as above for S´ersic index, we investigate howRevaries with wavelength for galaxies divided by colour and S´ersic index, as described in Section 2.3.
Fig.11shows the distribution ofRein each waveband, for the full galaxy sample and for our three colour subsamples. In contrast ton
(Fig.4), the distribution ofRedoes not depend strongly on galaxy colour. The median and shape of theRedistribution are very similar for the three samples in all wavebands.
at University of Nottingham on July 12, 2016
http://mnras.oxfordjournals.org/
[image:11.595.321.532.55.212.2]Figure 11. Effective radius distribution for our full sample (black line) and for galaxies in each of our colour subsamples (red,green,blue). Each panel shows the distribution in a different band:ugrizYJH. The median of each distribution, and its uncertainty, are indicated by vertical solid and dashed lines, respectively. TheRedistributions for each colour sample are very similar, and the medians vary only weakly with wavelength.
The medianRedecreases towards redder wavelengths. This be-haviour is slightly more pronounced for theredsample. This is more apparent in Fig.12, where the dependence of the median effective radius on wavelength is presented more compactly. The slope of the relations is similar for galaxies of different colour, just slightly steeper forredgalaxies.Redgalaxies also have a smaller medianRe
at all wavelengths, whileblueandgreengalaxies show very simi-lar values. The medianReinuband are 6.4±0.1, 7.2±0.3 and 7±1 kpc forred,greenandbluesubsamples, respectively. InH
band, the corresponding figures are 3.94± 0.09, 4.9± 0.1 and 4.8±0.3 kpc.
In contrast to colour and S´ersic index, in our sample there is no obvious separation of populations in effective radius. We therefore do not attempt to consider samples divided byRe, but continue to usento isolate bulge- and disc-dominated populations.
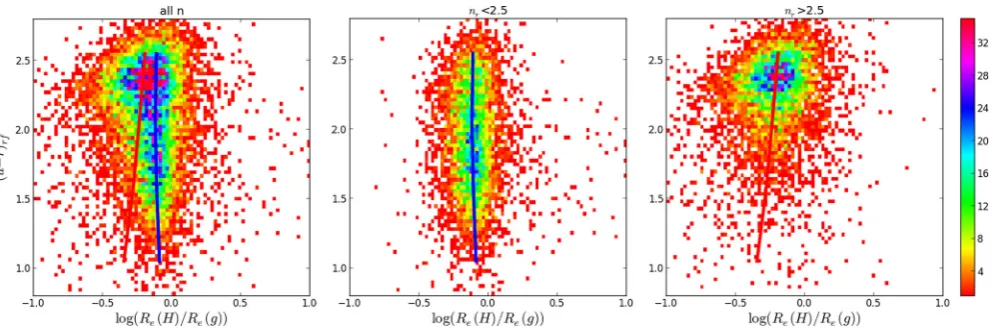
[image:12.595.323.537.56.224.2]Fig. 13 shows the dependence of the median effective radius on wavelength for galaxies characterized by different colour and
Figure 12. Median effective radius as a function of wavelength for ourred,
greenandbluegalaxy samples. Error bars represent the uncertainty on the median. Solid lines indicate the 16th- and 84th-percentiles of the distribution. The effective radius clearly depends on wavelength.Blueandgreengalaxies show very similar behaviour, whileredgalaxies have systematically smaller effective radii and a slightly steeper dependence on wavelength.
Figure 13. Median effective radius as a function of wavelength for galax-ies of different colour and S´ersic index. Red, dark green and blue symbols representhigh-ngalaxies; orange, light green and turquoise symbolslow-n
galaxies. Error bars represent the uncertainty on the median. The median ef-fective radius depends on wavelength. Small offsets in wavelength have been applied to all points for clarity.Low-nsamples display similar behaviour, while thehigh-nsamples show stronger, and more varied, trends.
S´ersic index. Each population shows a decrease in effective radius towards redder wavelengths. Galaxies withhigh-nare characterized by a steeper trend (a∼45 per cent reduction inRe fromuto H) than those withlow-n(∼25 per cent reduction). The threelow-n
samples behave very similarly; the variation of median Re with wavelength does not depend on colour for low-ngalaxies. The
high-nsamples display more variety, with bluer galaxies showing a stronger wavelength dependence.
3.2.2 Effective radius versus wavelength for individual galaxies
Following the same reasoning and approach for S´ersic index, we now move to quantifying the dependence of effective ra-dius on wavelength for individual galaxies. We adopt the sim-ilar notation Rrb = Re(r)/Re(b), where Re(r) and Re(b) are the effective radii in some (rest-frame) red and blue band, respectively
at University of Nottingham on July 12, 2016
http://mnras.oxfordjournals.org/
[image:12.595.323.539.301.471.2]