Discourse indicators for content selection in summarization
Annie Louis, Aravind Joshi, Ani Nenkova
University of Pennsylvania Philadelphia, PA 19104, USA
{lannie,joshi,nenkova}@seas.upenn.edu
Abstract
We present analyses aimed at eliciting which specific aspects of discourse pro-vide the strongest indication for text im-portance. In the context of content selec-tion for single document summarizaselec-tion of news, we examine the benefits of both the graph structure of text provided by dis-course relations and the semantic sense of these relations. We find that structure information is the most robust indicator of importance. Semantic sense only pro-vides constraints on content selection but is not indicative of important content by it-self. However, sense features complement structure information and lead to improved performance. Further, both types of dis-course information prove complementary to non-discourse features. While our re-sults establish the usefulness of discourse features, we also find that lexical overlap provides a simple and cheap alternative to discourse for computing text structure with comparable performance for the task of content selection.
1 Introduction
Discourse relations such as cause, contrast or elaboration are considered critical for text inter-pretation, as they signal in what way parts of a text relate to each other to form a coherent whole. For this reason, the discourse structure of a text can be seen as an intermediate representation, over which an automatic summarizer can perform computa-tions in order to identify important spans of text to include in a summary (Ono et al., 1994; Marcu, 1998; Wolf and Gibson, 2004). In our work, we study the content selection performance of differ-ent types of discourse-based features.
Discourse relations interconnect units of a text and discourse formalisms have proposed different
resulting structures for the full text, i.e.tree(Mann and Thompson, 1988) andgraph(Wolf and Gib-son, 2005). This structure is one source of in-formation from discourse which can be used to compute the importance of text units. The seman-tics of the discourse relations between sentences could be another indicator of content importance. For example, text units connected by “cause” and “contrast” relationships might be more important content for summaries compared to those convey-ing “elaboration”. While previous work have fo-cused on developing content selection methods based upon individual frameworks (Marcu, 1998; Wolf and Gibson, 2004; Uzda et al., 2008), little is known about which aspects of discourse are actu-ally correlated with content selection power.
In our work, we separate out structural and se-mantic features and examine their usefulness. We also investigate whether simpler intermediate rep-resentations can be used in lieu of discourse. More parsimonious, easy to compute representations of text have been proposed for summarization. For example, a text can be reduced to a set of highly descriptive topical words, the presence of which is used to signal importance for content selection (Lin and Hovy, 2002; Conroy et al., 2006). Sim-ilarly, a graph representation of the text can be computed, in which vertices represent sentences, and the nodes are connected when the sentences are similar in terms of word overlap; properties of the graph would then determine the importance of the nodes (Erkan and Radev, 2004; Mihalcea and Tarau, 2005) and guide content selection.
and compare discourse-based selection to simpler non-discourse methods.
2 Data
We use a collection of Wall Street Journal (WSJ) articles manually annotated for discourse infor-mation according to three discourse frameworks. The Rhetorical Structure Theory (RST) and Graph Bank (GB) corpora are relatively small compared to the Penn Discourse Treebank (PDTB) annota-tions that cover the 1 million word WSJ part of the Penn Treebank corpus (Marcus et al., 1994). Our evaluation requires gold standard summaries writ-ten by humans, so we perform our experiments on a subset of the overlapping documents for which we also have human summaries available.
2.1 RST corpus
RST (Mann and Thompson, 1988) proposes that coherent text can be represented as atreeformed by the combination of text units via discourse re-lations. The RST corpus developed by Carlson et al. (2001) contains discourse tree annotations for 385 WSJ articles from the Penn Treebank corpus. The smallest annotation units in the RST corpus are sub-sentential clauses, also called elementary discourse units (EDUs). Adjacent EDUs combine through rhetorical relations into larger spans such as sentences. The larger units recursively partici-pate in relations with others, yielding one hierar-chical tree structure covering the entire text.
The discourse units participating in a RST re-lation are assigned either nucleus or satellite sta-tus; a nucleus is considered to be more central, or important, in the text than a satellite. Rela-tions composed of one nucleus and one satellite are called mononuclear relations. On the other hand, in multinuclearrelations, two or more text units participate, and all are considered equally important. The RST corpus is annotated with 53 mononuclear and 25 multinuclear relations. Rela-tions that convey similar meaning are grouped, re-sulting in 16 classes of relations:Cause, Comparison, Condition, Contrast, Attribution, Background, Elaboration, Enablement, Evaluation, Explanation, Joint, Manner-Means, Topic-Comment, Summary, Temporal and Topic-Change.
2.2 Graph Bank corpus
Sometimes, texts cannot be described in a tree structure as hypothesized by the RST. For exam-ple, crossing dependencies and nodes with
multi-ple parents appear frequently in texts and do not allow a tree structure to be built (Lee et al., 2008). To address this problem, general graph representa-tion was proposed by Wolf and Gibson (2005) as a more realistic model of discourse structure.
Graph annotations of discourse are available for 135 documents (105 from AP Newswire and 30 from the WSJ) as part of the Graph Bank cor-pus (Wolf and Gibson, 2005). Clauses are the ba-sic discourse segments in this annotation. These units are represented as the nodes in a graph, and are linked with one another through 11 differ-ent rhetorical relations: Cause-effect, Condition, Vio-lated expectation, Elaboration, Example, Generalization, At-tribution, Temporal sequence, Similarity, Contrast and Same. The edge between two nodes representing a rela-tion is directed in the case of asymmetric relarela-tions such as Cause andCondition and undirected for symmetric relations likeSimilarityandContrast.
2.3 Penn Discourse Treebank
The Penn Discourse Treebank (PDTB) (Prasad et al., 2008) is theory-neutral and does not make any assumptions about the form of the overall dis-course structure of text. Instead, this approach fo-cuses on local and lexically-triggered discourse re-lations. Annotators identify explicit signals such as discourse connectives: ‘but’, ‘because’, ‘while’ and mark the text spans which they relate. The relations between these spans are called explicit relations. In addition, adjacent sentences in a dis-course are also semantically related even in the ab-sence of explicit markers. In the PDTB, these are calledimplicitrelations and are annotated between adjacent sentences in the same paragraph.
For both implicit and explicit relations, senses are assigned from a hierarchy containing four top-level categories: Comparison (contrast, prag-matic contrast, concession, pragprag-matic concession), Contin-gency (cause, pragmatic cause, condition, pragmatic con-dition) , Expansion (conjunction, instantiation, restate-ment, alternative, exception, list) and Temporal ( asyn-chronous, synchronous). The top level senses are
di-vided into types and subtypes that represent more fine grained senses—the second level senses are listed in parentheses above.
referred to as Arg1. For implicit relations, the ar-gument occurring first in the text is named Arg1, the one appearing later is called Arg2.
2.4 Human summaries
Human summaries are available for some of the WSJ articles. These summaries areextractive: hu-man judges identified and extracted important text units from the source articles and used them as such to compose the summary.
The RST corpus contains summaries for 150 documents. Two annotators selected the most im-portant EDUs from these documents and created summaries that contain about square root of the number of EDUs in the source document. For convenience, we adopt sentences as the common unit for comparison across all frameworks. So, we mapped the summary EDUs to the sentences which contain them. Two variable length sum-maries for each document were obtained in this way. In some documents, it was not possible to align EDUs automatically with gold standard sen-tence boundaries given by the Penn Treebank and these were not used in our work. We perform our experiments on the remaining 124 document-summary pairs. These documents consisted of 4,765 sentences in total, of which 1,152 were la-beled as important sentences because they con-tained EDUs selected by at least one annotator.
The Graph Bank corpus also contains human summaries. However, only 15 are for documents for which RST and PDTB annotations are also available. These summaries were created by fif-teen human annotators who ranked the sentences in each document on a scale from 1 (low impor-tance) to 7 (very important for a summary). For each document, we ordered the sentences accord-ing to the average rank from the annotators, and created a summary of 100 words using the top ranked sentences. The number of summary (im-portant) sentences is 67, out of a total of 308 sen-tences from the 15 documents.
3 Features for content selection
In this section, we describe two sets of discourse features–structural and semantic. The structure features are derived from RST trees and do not involve specific relations. Rather they compute the importance of a segment as a function of its position in the globalstructure of the entire text. On the other hand, semantic features indicate the
sense of a relation between two sentences and do not involve structure information. We com-pute these from the PDTB annotations. To un-derstand the benefits of discourse information, we also study the performance of some non-discourse features standardly used in summarization.
3.1 Structural features: RST-based
Prior work in text summarization has developed content selection methods using properties of the RST tree: the nucleus-satellite distinction, notions of salience and the level of an EDU in the tree.
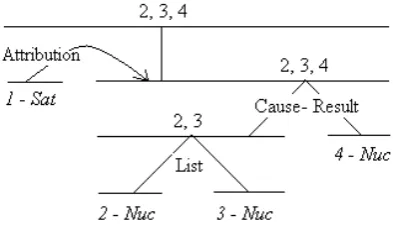
In early work, Ono et al. (1994) suggested a penalty score for every EDU based on their nucleus-satellite status. Since satellites of rela-tions are considered less important than the corre-sponding nuclei, spans that appear as satellites can be assigned a lower score than the nucleus spans. This intuition is implemented by Ono et al. (1994) as a penalty value for each EDU, defined as the number of satellite nodes found on the path from the root of the tree to that EDU. Figure 1 shows the RST tree (Carlson et al., 2002) for the follow-ing sentence which contains four EDUs.
1. [Mr. Watkins said] 2. [volume on Interprovincial’s sys-tem is down about 2% since January] 3. [and is expected to fall further,] 4. [making expansion unnecessary until perhaps the mid-1990s.]
[image:3.595.318.515.549.662.2]The spans of individual EDUs are represented at the leaves of the tree. At the root of the tree, the span covers the entire text. The path from EDU 1 to the root contains one satellite node. It is there-fore assigned a penalty of 1. Paths to the root from all other EDUs involve only nucleus nodes and subsequently these EDUs do not incur any penalty.
Figure 1: RST tree for the example sentence in Section 3.1.
salient/important units of a text span. The nu-cleus is the more salient unit in the full span of a mononuclear relation. In a multinuclear relation, all the nuclei are salient units of the larger span. For example, in Figure 1, EDUs 2 and 3 partici-pate in a multinuclear (List) relation. As a result, both EDUs 2 and 3 appear in the promotion set of their combined span. The salient units (promotion set) of each text span are shown above the horizon-tal line which represents the span. At the leaves, salient units are the EDUs themselves.
For the purpose of identifying important con-tent, units in the promotion sets of nodes close to the root are hypothesized to be more important than those at lower levels. The highest promo-tion of an EDU occurs at the node closest to the root which contains that EDU in its promotion set. The depth of the tree from the highest promotion is assigned as the score for that EDU. Hence, the closer to the root an EDU is promoted, the better its score. Since EDUs 2, 3 and 4 are promoted all the way up to the root of the tree, the score as-signed to them is equal to 4, the total depth of the tree. EDU 1 receives a depth score of 3.
However, notice that EDUs 2 and 3 are pro-moted to the root from a greater depth than EDU 4 but all three receive the same depth score. But an EDU promoted successively over multiple lev-els should be more important than one which is promoted fewer times. In order to make this dis-tinction, a promotion score was also introduced by Marcu (1998) which is a measure of the number of levels over which an EDU is promoted. Now, EDUs 2 and 3 receive a promotion score of three while the score of EDU 4 is only two.
For our experiments, we use the nucleus-satellite penalty, depth and promotion based scores as features. Because all these scores depend on the length of the document, another set of the same features normalized by number of words in the document are also included. The penalty/score for a sentence is computed as the maximum of the penalties/scores of its constituent EDUs.
3.2 Semantic features: PDTB-based
These features represent sentences purely in terms of the relations which they participate in. For each sentence, we use the PDTB annotations to encode the sense of the relation expressed by the sentence and the type of realization (explicit or implicit).
For example, the sentence below expresses a
Contingencyrelation.
In addition, its machines are easier to operate, so cus-tomers require less assistance from software.
For such sentences that contain both the argu-ments of a relation ie., expresses the relation by itself, we set the feature “expresses relation”. For the above sentence, the binary feature “expresses Contingency relation” would be true.
Alternatively, sentences participating in multi-sentential relations will have one of the following features on: “contains Arg1 of relation” or “con-tains Arg2 of relation”. Therefore, for the follow-ing sentences in an Expansion relation, we record the feature “contains Arg1 of Expansion relation” for sentence (1) and for sentence (2), “contains Arg2 of Expansion relation”.
(1) Wednesday’s dominant issue was Yasuda & Marine In-surance, which continued to surge on rumors of speculative buying. (2) It ended the day up 80 yen to 1880 yen.
We combine the implicit/explicit type distinc-tion of the reladistinc-tions with the other features de-scribed so far, doubling the number of features. We also added features that use the second level sense of a relation. So, the relevant features for sentence (1) above would be “contains Arg1 of Implicit Expansion relation” as well as “contains Arg1 of Implicit Restatement relation” (Restate-mentis a type ofExpansionrelation (Section 2.3)). In addition, we include features measuring the number of relations shared by a sentence (implicit, explicit and total) and the distance between argu-ments of explicit relations (the distance of Arg1 when the sentence contains Arg2).
3.3 Non-discourse features
We use standard non-discourse features used in summarization: length of the sentence, whether the sentence is paragraph initial or the first sen-tence of a document, and its offsets from docu-ment beginning as well as paragraph beginning and end (Edmundson, 1969). We also include the average, sum and product probabilities of the con-tent words appearing in sentences (Nenkova et al., 2006) and the number of topic signature words in the sentence (Lin and Hovy, 2000).
4 Predictive power of features
con-tain a Contingency relation”, a chi-square test was computed to measure the association between a feature and sentence class (in summary or not in summary). For real-valued features, comparison between important and unimportant/non-summary sentences was done using a two-sided t-test. The significant features from our different classes are reported in the Appendix–Tables 5, 6 and 7. A brief summary of the results is provided below.
Significant features that have higher values for sentences selected in a summaryare:
Structural: depth score and promotion score–both normal-ized and unnormalnormal-ized.
Semantic-PDTB-level11: contains Arg1 of Explicit Expan-sion, contains Arg1 of Implicit Contingency, contains Arg1 of Implicit Expansion, distance of other argument
Non-discourse:length, is the first sentence in the article, is the first sentence in the paragraph, offset from paragraph end, number of topic signature terms present, average probability of content words, sum of probabilities of content words
Significant features that have higher values for sentences not selected in a summaryare:
Structural:Ono penalty–normalized and unnormalized. Semantic-PDTB-level1: expresses Explicit Expansion, ex-presses Explicit Contingency, contains Arg2 of Implicit Tem-poral relation, contains Arg2 of Implicit Contingency, con-tains Arg2 of Implicit Expansion, concon-tains Arg2 of Implicit Comparison, number of shared implicit relations, total shared relations
Non-discourse: offset from paragraph beginning, offset from article beginning, sentence probability based on content words.
All the structural features prove to be strong in-dicators for content selection. RST depth and pro-motion scores are higher for important sentences. Unimportant sentences have high penalties.
On the other hand, note that most of the sig-nificant sense features are descriptive of the ma-jority class of sentences—those not important or not selected to appear in the summary (refer Ta-ble 7). For example, the second arguments of all the first level implicit PDTB relations are not preferred in human summaries. Most of the sec-ond level sense features also serve as indicators for what content should not be included in a sum-mary. Such features can be used to derive con-straints on what content is not important, but there are only few indicators associated with important sentences. Overall, out of the 25 first and second
1Features based on the PDTB level 1 senses. The signif-icant features based on the level 2 senses are reported in the appendix.
level sense features which turned out to be signifi-cantly related to a sentence class, only 8 are those indicative of important content.
Another compelling observation is that highly cognitively salient discourse relations such as ContrastandCausearenotindicative of important sentences. Of the features that indicate the occur-rence of a particular relation in a sentence, only two are significant, but they are predictive of non-important sentences. These are “expresses Ex-plicit Expansion” (also subtypes Conjunction and List) and “expresses Explicit Contingency”.
An additional noteworthy fact is the differences between implicit and explicit relations that hold across sentences. For implicit relations, the tests show a strong indication that the second arguments of Implicit Contingency or Expansion would not be included in a summary, their first arguments however are often important and likely to appear in a summary. At the same time, for explicit rela-tions, there is no regularity for any of the relations of which of the two arguments is more important. All the non-discourse features turned out highly significant (Table 6). Longer sentences, those in the beginning of an article or its paragraphs and sentences containing frequent content words are preferred in human summaries.
5 Classification performance
We now test the strengths and complementary be-havior of these features in a classification task to predict important sentences from input texts.
5.1 Comparison of feature classes
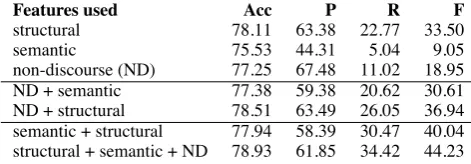
Table 1 gives the overall accuracy, as well as pre-cision and recall for the important/summary sen-tences. Features classes were combined using lo-gistic regression. The reported results are from 10-fold cross-validation runs on sentences from the 124 WSJ articles for which human summaries are available in the RST corpus. For the classifier us-ing sense information from the PDTB,allthe fea-tures described in Section 3.2 were used.
which is much better than the semantic class but still less than structural discourse features.
The structure and semantic features are com-plementary to each other. The performance of the classifier is substantially improved when both types of features are used (line 6 in Table 1). The F-score for the combined classifier is 40%, which amounts to 7% absolute improvement over the structure-only classifier.
Discourse information is also complementary to non-discourse. Adding discourse structure or sense features to non-discourse (ND) features leads to better classification decisions (lines 4, 5 in Table 1). Particularly notable is the improve-ment when sense and non-discourse features are combined–over 10% better F-score than the classi-fier using only non-discourse features. The overall best classifier is the combination of discourse— structure as well as sense—and non-discourse fea-tures. Here, recall for important sentences is 34% and the precision of predictions is 62%.
We also evaluated the features using ROUGE (Lin and Hovy, 2003; Lin, 2004). ROUGE com-putes ngram overlaps between human reference summaries and a given system summary. This measure allows us to compare the human sum-maries and classifier predictions at word level rather than using full sentence matches.
To perform ROUGE evaluation, summaries for our different classes of features were obtained as follows. Important sentences for each document were predicted using a logistic regression classi-fier trained on all other documents. When the number of sentences predicted to be important was not sufficient to meet the required summary length, sentences predicted with lowest confidence to be non-important were selected. All summaries were truncated to 100 words. Stemming was used, and stop words were excluded from the calcula-tion. Both human extracts were used as references. The results from this evaluation are shown in Table 2. They closely mirror the results obtained using precision and recall. The sense features per-form worse than the structural and non-discourse features. The best set of features is the one com-bining structure, sense and non-discourse features, with ROUGE-1 score (unigram overlap) of 0.479. Overall, combining types of features considerably improves results in all cases. However, unlike in the precision and recall evaluation, structural and non-discourse features perform very similarly.
Features used Acc P R F
[image:6.595.307.543.62.144.2]structural 78.11 63.38 22.77 33.50 semantic 75.53 44.31 5.04 9.05 non-discourse (ND) 77.25 67.48 11.02 18.95 ND + semantic 77.38 59.38 20.62 30.61 ND + structural 78.51 63.49 26.05 36.94 semantic + structural 77.94 58.39 30.47 40.04 structural + semantic + ND 78.93 61.85 34.42 44.23
Table 1: Accuracy (Acc) and Precision (P), Recall (R) and F-score (F) of important sentences.
Features ROUGE Features ROUGE structural + semantic + ND 0.479 ND 0.432 structural + ND 0.468 LEAD 0.411 structural + semantic 0.453 semantic 0.369 semantic + ND 0.444 TS 0.338 structural 0.433
Table 2: ROUGE-1 recall scores
Their ROUGE-1 recall scores are 0.433 and 0.432 respectively. The top ranked sentences by both sets of features appear to contain similar content.
We also evaluated sentences chosen by two baseline summarizers. The first, LEAD, includes sentences from the beginning of the article up to the word limit. This simple method is a very com-petitive baseline for single document summariza-tion. The second baseline ranks sentences based on the proportion of topic signature (TS) words contained in the sentences (Conroy et al., 2006). This approach leads to very good results in identi-fying important content for multi-document sum-maries where there is more redundancy, but it is the worst when measured by ROUGE-1 on this single document task. Structure and non-discourse features outperform both these baselines.
5.2 Tree vs. graph discourse structure
clas-Features Acc P R F ROUGE RST-struct. 81.61 63.00 31.56 42.05 0.569 GB-struct. 82.58 62.50 39.16 48.15 0.508
Table 3: Tree vs graph-based discourse features
sifier and 42% for the RST classifier. The better performance of GB method comes from higher re-call scores compared to RST. Their precision val-ues are comparable. But, in terms of ngram-based ROUGE scores, the results from RST (0.569) turn out slightly better than GB (0.508). Over-all, discourse features based on structure turn out as strong indicators of sentence importance and we find both tree and graph representations to be equally useful for this purpose.
6 Lexical approximation to discourse structure
In prior work on summarization, graph models of text have been proposed that do not rely on dis-course. Rather, lexical similarity between sen-tences is used to induce graph structure (Erkan and Radev, 2004; Mihalcea and Tarau, 2005). PageRank-based computation of sentence impor-tance have been used on these models with good results. Now, we would like to see if the discourse graphs from the Graph Bank (GB) corpus would be more helpful for determining content impor-tance than the general text graph based on lexi-cal similarity (LEX). We perform this comparison on the 15 documents that we used in the previous section for evaluating tree versus graph structures. We used cosine similarity to link sentences in the lexical graph. Links with similarity less than 0.1 were removed to filter out weak relationships.
The classification results are shown in Table 4. The similarity graph representation is even more helpful than RST or GB: the F-score is 53% com-pared to 42% for RST and 48% for GB. The most significant improvement from the lexical graph is in terms of precision 75% which is more than 10% higher compared to RST and GB features. Using ROUGE as the evaluation metric, the lexical sim-ilarity graph, LEX (0.557), gives comparable per-formance with both GB (0.508) and RST (0.569) representations (refer Table 3). Therefore, for use in content selection, lexical overlap information appears to be a good proxy for building text struc-ture in place of discourse relations.
Features Acc P R F ROUGE
LEX-struct. 83.23 75.17 41.14 53.18 0.557
Table 4: Performance of lexrank summarizer
7 Discussion
We have analyzed the contribution of different types of discourse features–structural and seman-tic. Our results provide strong evidence that dis-course structure is the most useful aspect. Both tree and graph representations of discourse can be used to compute the importance of text units with very good results. On the other hand, sense in-formation from discourse does not provide strong indicators of good content but some constraints as to which content should not be included in a summary. These sense features complement structure information leading to improved perfor-mance. Further, both these types of discourse fea-tures are complementary to standardly used non-discourse features for content selection.
However, building automatic parsers for dis-course information has proven to be a hard task overall (Marcu, 2000; Soricut and Marcu, 2003; Wellner et al., 2006; Sporleder and Lascarides, 2008; Pitler et al., 2009) and the state of cur-rent parsers might limit the benefits obtainable from discourse. Moreover, discourse-based struc-ture is only as useful for content selection as sim-pler text structure built using lexical similarity. Even with gold standard annotations, the perfor-mance of structural features based on the RST and Graph Bank representations is not better than that obtained from automatically computed lexical graphs. So, even if robust discourse parsers exist to use these features on other test sets, it is not likely that discourse features would provide better performance than lexical similarity. Therefore, for content selection in summarization, current sys-tems can make use of simple lexical structures to obtain similar performance as discourse features.
found that discourse and temporal ordering prob-lems account for 34% and 22% respectively of all the required revisions. Therefore, we suspect that for building summarization systems, most benefits from discourse can be obtained with regard to text quality compared to the task of content selection. We plan to focus on this aspect of discourse use for our future work.
References
L. Carlson, D. Marcu, and M. E. Okurowski. 2001. Building a discourse-tagged corpus in the frame-work of rhetorical structure theory. InProceedings of SIGdial, pages 1–10.
L. Carlson, D. Marcu, and M. E. Okurowski. 2002. Rst discourse treebank. Corpus number LDC 2002T07, Linguistic Data Consortium, Philadelphia.
J. Conroy, J. Schlesinger, and D. O’Leary. 2006. Topic-focused multi-document summarization using an approximate oracle score. In Proceedings of ACL.
H.P. Edmundson. 1969. New methods in automatic extracting.Journal of the ACM, 16(2):264–285.
G. Erkan and D. Radev. 2004. Lexrank: Graph-based centrality as salience in text summarization.Journal of Artificial Intelligence Research (JAIR).
A. Lee, R. Prasad, A. Joshi, and B. Webber. 2008. De-partures from Tree Structures in Discourse: Shared Arguments in the Penn Discourse Treebank. In Pro-ceedings of the Constraints in Discourse Workshop.
C. Lin and E. Hovy. 2000. The automated acquisition of topic signatures for text summarization. In
Pro-ceedings of COLING, pages 495–501.
C. Lin and E. Hovy. 2002. Manual and automatic evaluation of summaries. InProceedings of the ACL
Workshop on Automatic Summarization.
C. Lin and E. Hovy. 2003. Automatic evaluation of summaries using n-gram co-occurrence statistics. In
Proceedings of HLT-NAACL.
C. Lin. 2004. ROUGE: a package for automatic eval-uation of summaries. InProceedings of ACL Text
Summarization Workshop.
W.C. Mann and S.A. Thompson. 1988. Rhetorical structure theory: Towards a functional theory of text organization.Text, 8.
D. Marcu. 1998. To build text summaries of high qual-ity, nuclearity is not sufficient. In Working Notes of the the AAAI-98 Spring Symposium on Intelligent Text Summarization, pages 1–8.
D. Marcu. 2000. The rhetorical parsing of unrestricted texts: A surface-based approach. Computational Linguistics, 26(3):395–448.
M. Marcus, B. Santorini, and M. Marcinkiewicz. 1994. Building a large annotated corpus of en-glish: The penn treebank. Computational Linguis-tics, 19(2):313–330.
R. Mihalcea and P. Tarau. 2005. An algorithm for language independent single and multiple document summarization. InProceedings of IJCNLP.
A. Nenkova, L. Vanderwende, and K. McKeown. 2006. A compositional context sensitive multi-document summarizer: exploring the factors that in-fluence summarization. InProceedings of SIGIR.
K. Ono, K. Sumita, and S. Miike. 1994. Abstract gen-eration based on rhetorical structure extraction. In
Proceedings of COLING, pages 344–348.
J.C. Otterbacher, D.R. Radev, and A. Luo. 2002. Revi-sions that improve cohesion in multi-document sum-maries: a preliminary study. InProceedings of ACL
Text Summarization Workshop, pages 27–36.
L. Page, S. Brin, R. Motwani, and T. Winograd. 1998. The pagerank citation ranking: Bringing order to the web. Technical report, Stanford Digital Library Technologies Project.
E. Pitler, A. Louis, and A. Nenkova. 2009. Automatic sense prediction for implicit discourse relations in text. In Proceedings of ACL-IJCNLP, pages 683– 691.
R. Prasad, N. Dinesh, A. Lee, E. Miltsakaki, L. Robaldo, A. Joshi, and B. Webber. 2008. The penn discourse treebank 2.0. In Proceedings of
LREC.
R. Soricut and D. Marcu. 2003. Sentence level dis-course parsing using syntactic and lexical informa-tion. InProceedings of HLT-NAACL.
C. Sporleder and A. Lascarides. 2008. Using automat-ically labelled examples to classify rhetorical rela-tions: An assessment. Natural Language Engineer-ing, 14:369–416.
V.R. Uzda, T.A.S. Pardo, and M.G. Nunes. 2008. Evaluation of automatic text summarization meth-ods based on rhetorical structure theory. Intelligent
Systems Design and Applications, 2:389–394.
B. Wellner, J. Pustejovsky, C. Havasi, A. Rumshisky, and R. Saur´ı. 2006. Classification of discourse co-herence relations: An exploratory study using mul-tiple knowledge sources. InProceedings of SIGdial, pages 117–125.
F. Wolf and E. Gibson. 2004. Paragraph-, word-, and coherence-based approaches to sentence ranking: A comparison of algorithm and human performance.
InProceedings of ACL, pages 383–390.
Appendix: Feature analysis
This appendix provides the results from statistical tests for identifying predictive features from the dif-ferent classes (RST-based structural features–Table 5, Non-discourse features–Table 6 and PDTB-based sense features–Table 7).
For real-valued features, we performed a two sided t-test between the corresponding feature values for important versus non-important sentences. For features which turned out significant in each set, the value of the test statistic and significance levels are reported in the tables.
For binary features, we report results from a chi-square test to measure how indicative a feature is for the class of important or non-important sentences. For results from the chi-square test, a (+/-) sign is enclosed within parentheses for each significant feature to indicate whether the observed number of times the feature wastruein important sentences is greater (+) than the expected value (indication that this feature is frequently associated with important sentences). When the observed frequency is less than the expected value, a (-) sign is appended.
RST Features t-stat p-value
Ono penalty -21.31 2.2e-16
Depth score 16.75 2.2e-16
Promotion score 16.00 2.2e-16
Normalized penalty -11.24 2.2e-16 Normalized depth score 17.24 2.2e-16 Normalized promotion score 14.36 2.2e-16
Table 5: Significant RST-based features
Non-discourse features t-stat p-value
Sentence length 3.14 0.0017
Average probability of content words 9.32 2.2e-16 Sum probability of content words 11.83 2.2e-16 Product probability of content words -5.09 3.8e-07 Number of topic signature terms 9.47 2.2e-16 Offset from article beginning -12.54 2.2e-16 Offset from paragraph beginning -28.81 2.2e-16 Offset from paragraph end 7.26 5.8e-13
χ2 p-value
First sentence? 224.63 (+) 2.2e-16
Paragraph initial? 655.82 (+) 2.2e-16
PDTB features t-stat p-value
No. of implicit relations involved -9.13 2.2e-16 Total relations involved -6.95 4.9e-12
Distance of Arg1 3.99 6.6e-05
Based on level 1 senses
χ2 p-value
Expresses explicit Expansion 12.96 (-) 0.0003 Expresses explicit Contingency 7.35 (-) 0.0067 Arg1 explicit Expansion 12.87 (+) 0.0003 Arg1 implicit Contingency 13.84 (+) 0.0002 Arg1 implicit Expansion 29.10 (+) 6.8e-08 Arg2 implicit Temporal 4.58 (-) 0.0323 Arg2 implicit Contingency 60.28 (-) 8.2e-15 Arg2 implicit Expansion 134.60 (-) 2.2e-16 Arg2 implicit Comparison 27.59 (-) 1.5e-07
Based on level 2 senses
χ2 p-value
Expresses explicit Conjunction 8.60 (-) 0.0034 Expresses explicit List 4.41 (-) 0.0358 Arg1 explicit Conjunction 10.35 (+) 0.0013 Arg1 implicit Conjunction 5.26 (+) 0.0218 Arg1 implicit Instantiation 18.94 (+) 1.4e-05 Arg1 implicit Restatement 15.35 (+) 8.9-05 Arg1 implicit Cause 12.78 (+) 0.0004
Arg1 implicit List 5.89 (-) 0.0153
Arg2 explicit Asynchronous 4.23 (-) 0.0398 Arg2 explicit Instantiation 10.92 (-) 0.0009 Arg2 implicit Conjunction 51.57 (-) 6.9e-13 Arg2 implicit Instantiation 12.08 (-) 0.0005 Arg2 implicit Restatement 28.24 (-) 1.1e-07 Arg2 implicit Cause 58.62 (-) 1.9e-14 Arg2 implicit Contrast 30.08 (-) 4.2e-08 Arg2 implicit List 12.31 (-) 1.9e-14