Language Diversity across the Consonant Inventories:
A Study in the Framework of Complex Networks
Monojit Choudhury
Microsoft Research India, Bangalore, India – 560080 Email: [email protected]
Animesh Mukherjee, Anupam Basu and Niloy Ganguly Indian Institute of Technology, Kharagpur, India – 721302
Ashish Garg and Vaibhav Jalan
Malaviya National Institute of Technology, Jaipur, India – 302017
Abstract
In this paper, we attempt to explain the emergence of the linguistic diversity that exists across the consonant inventories of some of the major language families of the world through a complex network based growth model. There is only a single pa-rameter for this model that is meant to introduce a small amount of randomness in the otherwise preferential attachment based growth process. The experiments with this model parameter indicates that the choice of consonants among the lan-guages within a family are far more pref-erential than it is across the families. Fur-thermore, our observations indicate that this parameter might bear a correlation with the period of existence of the lan-guage families under investigation. These findings lead us to argue that preferential attachement seems to be an appropriate high level abstraction for language acqui-sition and change.
1 Introduction
In one of their seminal papers (Hauser et al., 2002), Noam Chomsky and his co-authors re-marked that if a Martian ever graced our planet then it would be awe-struck by the unique abil-ity of the humans to communicate among them-selves through the medium of language. How-ever, if our Martian naturalist were meticulous then it might also note the surprising co-existence of 6700 such mutually unintelligible languages across the world. Till date, the terrestrial scientists have no definitive answer as to why this linguistic diversity exists (Pinker, 1994). Previous work in
the area of language evolution has tried to explain the emergence of this diversity through two differ-ent background models. The first one assumes that there is a set of predefined language configurations and the movement of a particular language on this landscape is no more than a random walk (Tom-lin, 1986; Dryer, 1992). The second line of re-search attempts to relate the ecological, cultural and demographic parameters with the linguistic parameters responsible for this diversity (Arita and Taylor, 1996; Kirby, 1998; Livingstone and Fyfe, 1999; Nettle, 1999). From the above studies, it turns out that linguistic diversity is an outcome of the language dynamics in terms of its evolution, acquisition and change.
In this work, we attempt to investigate the di-versity that exists across the consonant inventories of the world’s languages through an evolutionary framework based on network growth. The use of a network based model is motivated from the fact that in the recent years, complex networks have proved to be an extremely suitable framework for modeling and studying the structure and dynam-ics of linguistic systems (Cancho and Sol´e, 2001; Dorogovtsev and Mendes, 2001; Cancho and Sol´e, 2004; Sol´e et al., 2005).
ma-jor language families namely, the Indo-European (IE-PlaNet), the Afro-Asiatic (AA-PlaNet), the Niger-Congo (NC-PlaNet), the Austronesian (AN-PlaNet) and the Sino-Tibetan (ST-(AN-PlaNet).
The emergence of the distribution of occurrence of the consonants across the languages of a fam-ily can be explained through a growth model for the PlaNet representing the family. We employ the
preferential attachmentbased growth model intro-duced in (Choudhury et al., 2006) and later ana-lytically solved in (Peruani et al., 2007) to explain this emergence for each of the five families. The model involves a single parameter that is essen-tially meant to introduce randomness in the oth-erwise predominantly preferential growth process. We observe that if we combine the inventories for all the families together and then attempt to fit this new data with our model, the value of the param-eter is significantly different from that of the in-dividual families. This indicates that the dynam-ics within the families is quite different from that across them. There are possibly two factors that regulate this dynamics: the innate preference of the speakers towards acquiring certain linguistic structures over others and shared ancestry of the languages within a family.
The prime contribution of this paper lies in the mathematical model that naturally captures and quantifies the diversification process of the lan-guage inventories. This diversification, which is arguably an effect of language acquisition and change, can be viewed as a manifestation of the process of preferential attachment at a higher level of abstraction.
The rest of the paper is laid out as follows. Sec-tion 2 states the definiSec-tion of PlaNet, briefly de-scribes the data source and outlines the construc-tion procedure for the five networks. In secconstruc-tion 3 we review the growth model for the networks. The experiments and the results are explained in the next section. Section 5 concludes the paper by ex-plaining how preferential attachment could possi-bly model the phenomena of language acquisition, change and evolution.
2 Definition and Construction of the Networks
[image:2.595.374.457.64.250.2]In this section, we revisit the definition of PlaNet, discuss briefly about the data source, and explain how we constructed the networks for each of the families.
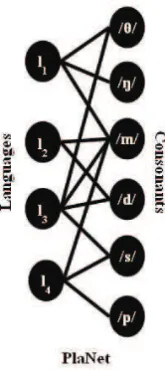
Figure 1: Illustration of the nodes and edges of PlaNet.
2.1 Definition of PlaNet
PlaNet is a bipartite graphG=hVL,VC,Epli con-sisting of two sets of nodes namely, VL (labeled
by the languages) and VC (labeled by the
conso-nants);Eplis the set of edges running betweenVL
and VC. There is an edgee ∈ Epl from a node
vl ∈VLto a nodevc ∈VC iff the consonantc is
present in the inventory of the languagel. Figure 1 illustrates the nodes and edges of PlaNet.
2.2 Data Source
inven-tories may lead to different results, though we be-lieve that the basic trends will remain similar. In essence, the results described here should be taken as indicative and not sacrosanct.
There are 317 languages in the database with 541 consonants found across them. From these data we manually sort the languages into five groups representing the five families. Note that we included a language in any group if and only if we could find a direct evidence of its presence in the corresponding family. A brief description of each of these groups and languages found within them are listed below (Haspelmath et al., 2005; Gordon, 2005).
Indo-European:This family includes most of the major languages of Europe and south, central and south-west Asia. Currently, it has around 3 bil-lion native speakers, which is largest among all the recognized families of languages in the world. The total number of languages appearing in this family is 449. The earliest evidences of the Indo-European languages have been found to date 4000 years back.
Languages– Albanian, Lithuanian, Breton, Irish, German, Norwegian, Greek, Bengali, Hindi-Urdu, Kashmiri, Sinhalese, Farsi, Kurdish, Pashto, French, Romanian, Spanish, Russian, Bulgarian. Afro-Asiatic: Afro-Asiatic languages have about 200 million native speakers spread over north, east, west, central and south-west Africa. This family is divided into five subgroups with a total of 375 languages. The proto-language of this family began to diverge into separate branches approxi-mately 6000 years ago.
Languages– Shilha, Margi, Angas, Dera, Hausa, Kanakuru, Ngizim, Awiya, Somali, Iraqw, Dizi, Kefa, Kullo, Hamer, Arabic, Amharic, Socotri. Niger-Congo: The majority of the languages that belong to this family are found in the sub-Saharan parts of Africa. The number of native speakers is around 300 million and the total number of languages is 1514. This family descends from a proto-language, which dates back 5000 years.
Languages – Diola, Temne, Wolof, Akan, Amo, Bariba, Beembe, Birom, Cham, Dagbani, Doayo, Efik, Ga, Gbeya, Igbo, Ik, Koma, Lelemi, Senadi, Tampulma, Tarok, Teke, Zande, Zulu, Kadugli, Moro, Bisa, Dan, Bambara, Kpelle.
Austronesian:The languages of the Austronesian family are widely dispersed throughout the islands of south-east Asia and the Pacific. There are 1268
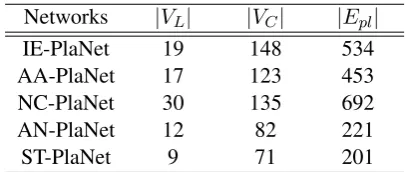
Networks |VL| |VC| |Epl|
IE-PlaNet 19 148 534
AA-PlaNet 17 123 453
NC-PlaNet 30 135 692
AN-PlaNet 12 82 221
[image:3.595.314.517.61.147.2]ST-PlaNet 9 71 201
Table 1: Number of nodes and edges in the five bipartite networks corresponding to the five fami-lies.
languages in this family, which are spoken by a population of 6 million native speakers. Around 4000 years back it separated out from its ancestral branch.
Languages – Rukai, Tsou, Hawaiian, Iai, Adz-era, Kaliai, Roro, Malagasy, Chamorro, Tagalog, Batak, Javanese.
Sino-Tibetan: Most of the languages in this fam-ily are distributed over the entire east Asia. With a population of around 2 billion native speakers it ranks second after Indo-European. The total num-ber of languages in this family is 403. Some of the first evidences of this family can be traced 6000 years back.
Languages– Hakka, Mandarin, Taishan, Jingpho, Ao, Karen, Burmese, Lahu, Dafla.
2.3 Construction of the Networks
We use the consonant inventories of the languages enlisted above to construct the five bipartite net-works – IE-PlaNet, AA-PlaNet, NC-PlaNet, AN-PlaNet and ST-AN-PlaNet. The number of nodes and edges in each of these networks are noted in Ta-ble 1.
3 The Growth Model for the Networks
As mentioned earlier, we employ the growth model introduced in (Choudhury et al., 2006) and later (approximately) solved in (Peruani et al., 2007) to explain the emergence of thedegree dis-tributionof the consonant nodes for the five bipar-tite networks. For the purpose of readability, we briefly summarize the idea below.
Degree Distribution:The degree of a nodev, de-noted by k, is the number of edges incident on
v. The degree distribution is the fraction of nodes
pkthat have a degree equal tok(Newman, 2003).
The cumulative degree distributionPkis the
then,
Pk=
N
X
k=k0
pk0 (1)
Model Description: The model assumes that the size of the consonant inventories (i.e., the degree of the language nodes in PlaNet) are knowna pri-ori.
Let the degree of a language node Li ∈ VL
be denoted by di (i.e., di refers to the inventory
size of the language Li in UPSID). The conso-nant nodes inVCare assumed to be unlabeled, i.e,
they are not marked by the articulatory/acoustic features (see (Trubetzkoy, 1931) for further refer-ence) that characterize them. In other words, the model does not take into account the phonetic sim-ilarity among the segments. The nodesL1through
L317 are sorted in the ascending order of their de-grees. At each time step a node Lj, chosen in
order, preferentially gets connected to dj distinct
nodes (call each such nodeC) of the setVC. The
probability P r(C) with which the node Lj gets
connected to the nodeCis given by,
P r(C) = P k+²
∀C0(k
0
+²) (2)
where k is the current degree of the nodeC, C0
represents the nodes in VC that are not already
connected toLj and²is the model parameter that
is meant to introduce a small amount of random-ness into the growth process. The above steps are repeated until all the language nodesLj ∈VLget
connected todj consonant nodes.
Intuitively, the model works as follows: If a consonant is very frequently found in the invento-ries of the languages, then there is a higher chance of that consonant being included in the inventory of a “new language”. Here the term “new lan-guage” can be interpreted either as a new and hith-erto unseen sample from the universal set of lan-guages, or the formation of a new language due to some form of language change. The param-eter ² on the other hand ensures that the conso-nants which are found in none of the languages from the current sample also have a chance of be-ing included in the new language. It is similar to the add-αsmoothing used to avoid zero probabil-ities while estimating probability distributions. It is easy to see that for very large values of²the fre-quency factor will play a very minor role and the consonants will be chosen randomly by the new language, irrespective of its present prevalence. It
is natural to ask why and how this particular pro-cess would model the growth of the language in-ventories. We defer this question until the last sec-tion of the paper, and instead focus on some empir-ical studies to see if the model can really explain the observed data.
Peruani et al. (2007) analytically derived an ap-proximate expression for the degree distribution of the consonant nodes for this model. Let the aver-age consonant inventory size be denoted byµand the number of consonant nodes be N. The solu-tion obtained in (Peruani et al., 2007) is based on the assumption that at each time stept, a language node gets attached toµconsonant nodes, follow-ing the distribution P r(C). Under the above as-sumptions, the degree distributionpk,tfor the
con-sonant nodes, obtained by solving the model, is a
β-distribution as follows
pk,t'A
µ
k t
¶²−1µ
1− k t
¶N ² µ−²−1
(3)
where A is a constant term. Using equations 1 and 3 one can easily compute the value ofPk,t.
There is a subtle point that needs a mention here. The concept of a time stepis very crucial for a growing network. It might refer to the addi-tion of an edge or a node to the network. While these two concepts coincide when every new node has exactly one edge, there are obvious differences when the new node has degree greater than one. The analysis presented in Peruani et al. (2007) holds good for the case when only one edge is added per time step. However, if the degree of the new node being introduced to the system is much less thanN, then Eq. 3 is a good approximation of the emergent degree distribution for the case when a node with more than one edge is added per time step. Therefore, the experiments presented in the next section attempt to fit the degree distribution of the real networks with Eq. 3 by tuning the pa-rameter².
4 Experiments and Results
In this section, we attempt to fit the degree dis-tribution of the five empirical networks with the expression forPk,t described in the previous sec-tion. For all the experiments we setN = 541,t=
Network ²for leastLSE Value ofLSE
[image:5.595.85.282.61.129.2]IE-PlaNet 0.055 0.16 AA-PlaNet 0.040 0.24 NC-PlaNet 0.035 0.19 AN-PlaNet 0.030 0.17 ST-PlaNet 0.035 0.03 Combined-PlaNet 0.070 1.47
Table 2: The values of²and the leastLSEfor the different networks. Combined-PlaNet refers to the network constructed after mixing all the languages from all the families. For all the experiments
the family. Therefore, given the value of k we can compute pk,t using Eq. 3 if² is known, and
frompk,twe can further computePk,t. In order to find the best fitting theoretical degree distribution, we vary the value of²in steps of 0.005 within the range of 0 to 1 and choose that²for which the log-arithmic standard error1 (LSE) between the
the-oretical degree distribution and the epirically ob-served degree distribution of the real network and the equation is least.LSEis defined as the sum of the square of the difference between the logarithm of the ordinate pairs (sayy andy0) for which the abscissas are equal. The best fits obtained for each of the five networks are shown in Figure 2. The values of ²and the corresponding leastLSE for each of them are noted in Table 2. We make the following significant and interesting observations. Observation I:The very low value of the parame-ter²indicates that the choice of consonants within the languages of a family is strongly preferential. In this context,² may be thought of as modeling the (accidental) errors or drifts that can occur dur-ing language transmission. The fact that the val-ues of ²across the four major language families, namely Afro-Asiatic,Niger-Congo, Sino-Tibetan and Austronesian, are comparable indicates that the rate of error propagation is a universal factor that is largely constant across the families. The value of ² for IE-PlaNet is slightly higher than the other four families, which might be an effect of higher diversification within the family due to geographical or socio-political factors. Neverthe-less, it is still smaller than the²of the
Combined-1LSE = (logy−logy0)2. We useLSEas the
good-ness of the fit because the degree distributions of PlaNets are highly skewed. There are very few high degree nodes and a large number of low degree nodes. The logarithmic error en-sures that even very small errors made while fitting the high degrees are penalized equally as compared to that of the low degrees. Standard error would not capture this fact and de-clare a fit as good if it is able to replicate the distribution for low degrees, but fits the high degrees poorly .
PlaNet.
The optimal²obtained for Combined-PlaNet is higher than that of all the families (see Table 2), though it is comparable to the Indo-European PlaNet. This points to the fact that the choice of consonants within the languages of a family is far more preferential than it is across the families; this fact is possibly an outcome of shared ances-try. In other words, the inventories of genetically related languages are similar (i.e., they share a lot of consonants) because they have evolved from the same parent language through a series of linguis-tic changes, and the chances that they use a large number of consonants used by the parent language is naturally high.
Observation II: We observe a very interesting relationship between the approximate age of the language family and the values of ² obtained in each case (see Table 3). The only anomaly is the Indo-European branch, which possibly indicates that this might be much older than it is believed to be. In fact, a recent study (Balter, 2003) has shown that the age of this family dates back to 8000 years. If this last argument is assumed to be true then the values of²have a one-to-one cor-respondence with the approximate period of ex-istence of the language families. As a matter of fact, this correlation can be intuitively justified – the higher is the period of existence of a family, the higher are the chances of transmission errors lead-ing to its diversification into smaller subgroups, and hence, the values of² comes out to be more for the older families. It should be noted that the difference between the values of²for the language families are not significant2. Therefore, the
afore-mentioned observation should be interpreted only as an interesting possibility; more experimentation is required for making any stronger claim.
4.1 Control Experiment
How could one be sure that the aforementioned observations are not an obvious outcome of the construction of the PlaNet or some spurious cor-relations? To this end, we conduct a control ex-periment where a set of inventories is randomly selected from UPSID to represent a family. The
2Note that in order to obtain the best fit for the cumulative
Figure 2: The degree distribution of the different real networks (black dots) along with the fits obtained from the equation for the optimal values of²(grey lines).
Families Age (in years) ²
Austronasean 4000 0.030 Niger-Congo 5000 0.035 Sino-Tibetan 6000 0.035 Afro-Asiatic 6000 0.040 Indo-European 4000 (or 8000) 0.055
Table 3: Table showing the relationship between the age of a family and the value of².
number of languages chosen is the same as that of the PlaNets of the various language families. We observe that the average value of ²for these ran-domly constructed PlaNets is 0.068, which, as one would expect, is close to that of the Combined-PlaNet. This reinforces the fact that the inherent proximity among the languages of a real family is not due to chance.
4.2 Correlation between Families
It can be shown theoretically that if we merge two PlaNets (say PlaNet1and PlaNet2) synthesized us-ing the growth model described here usus-ing param-eters²1 and²2, then the²of the combined PlaNet can be much greater than both ²1 and ²2 when there is a low correlation between the degrees of the consonant nodes between the two PlaNets. This can be understood as follows. Suppose that the consonant /k/ is very frequent (i.e., has a high degree) in PlaNet1, but the consonant /m/ is not. On the other hand suppose that /m/ is very fre-quenct in PlaNeT2, but /k/ is not. In the combined
PlaNet the degrees of /m/ and /k/ will even out and the degree distribution will therefore, be much less skewed than the original degree distributions of PlaNet1and PlaNet2. This is equivalent to the fact that while²1 and²2 were very small, the²of the combined PlaNet is quite high. By the same logic it follows that if the degrees of the consonants are highly correlated in PlaNet1 and PlaNet2, then the combined PlaNet will have an²that is compara-ble in magnitude to ²1 and ²2. The fact that the
²for the Combined-PlaNet is higher than that of family-specific PlaNets, therefore, implies that the correlation between the frequencies of the conso-nants across language families is not very high.
In order to verify the above observation we esti-mate the correlation between the frequency of oc-currence of the consonants for the different lan-guage family pairs (i.e., how the frequencies of the consonants /p/, /t/, /k/, /m/, /n/ . . . are corre-lated across the different families). Table 4 notes the value of this correlation among the five fami-lies. The values in Table 4 indicate that, in general, the families are somewhat weakly correlated with each other, the average correlation being∼0.47.
[image:6.595.98.269.336.411.2]usu-Families IE AA NC AN ST
IE – 0.49 0.48 0.42 0.25
AA 0.49 – 0.66 0.53 0.43
NC 0.48 0.66 – 0.55 0.37
AN 0.42 0.53 0.55 – 0.50
[image:7.595.74.298.62.125.2]ST 0.25 0.43 0.37 0.50 –
Table 4: The Pearson’s correlation between the frequency distributions obtained for the family pairs. IE: Indo-European, AA: Afro-Asiatic, NC: Niger-Congo, AN: Austronesian, ST: Sino-Tibetan.
ally believed that they share absolutely no genetic connections. Interestingly, similar trends are ob-served for the values of the parameter ². If we combine the languages of the Afro-Asiatic and the Niger-Congo families and try to fit the new data then²turns out to be 0.035 while if we do the same for the Indo-European and the Sino-Tibetan fam-ilies then²is 0.058. For many of the other com-binations the value of²and the correlation coeffi-cient have a one-to-one correspondence. However, there are clear exceptions also. For instance, if we combine the Afro-Asiatic and the Indo-European families then the value of²is very low (close to 0.04) although the correlation between them is not very high. The reasons for these exceptions should be interesting and we plan to further explore this issue in future.
5 Conclusion
In this paper, we presented a method of network evolution to capture the emergence of linguistic diversity that manifests in the five major language families of the world. How does the growth model, if at all, captures the process of language dynam-ics? We argue that preferential attachment is a high level abstraction of language acquisition as well as language change. We sketch out two pos-sible explanations for this fact, both of which are merely speculations at this point and call for de-tailed experimentation.
It is a well known fact that the process of lan-guage acquisition by an individual largely gov-erns the course of language change in a linguis-tic community. In the initial years of language development every child passes through a stage calledbabblingduring which he/she learns to pro-duce non-meaningful sequences of consonants and vowels, some of which are not even used in the language to which they are exposed (Jakobson, 1968; Locke, 1983). Clear preferences can be
observed for learning certain sounds such as plo-sives and nasals, whereas fricatives and liquids are avoided. In fact, this hierarchy of preference dur-ing the babbldur-ing stage follows the cross-ldur-inguistic frequency distribution of the consonants. This in-nate frequency dependent preference towards cer-tain phonemes might be because of phonetic rea-sons (i.e., for articulatory/perceptual benefits). It can be argued that in the current model, this in-nate preference gets captured through the process of preferential attachment.
An alternative explanation could be conceived of based on the phenomenon of language trans-mission. Let there be a community ofN speak-ers communicating among themselves by means of only two consonants say /k/ and /g/. Let the number of /k/ speakers bemand that of /g/ speak-ers ben. If we assume that each speaker hasl de-scendants and that language inventories are trans-mitted with high fidelity then afterigenerations, the number of /k/ speakers should bemliand that
of /g/ speakers should be nli. Now if m > n
and l > 1 then for sufficiently large values of i
we have mli À nli. Stated differently, the /k/
speakers by far outnumbers the /g/ speakers after a few generations even though the initial difference between them is quite small. This phenomenon is similar to that of preferential attachment where language communities get attached to, i.e., select consonants that are already highly preferred. In this context²can be thought to model the acciden-tal errors during transmission. Since these errors accumulate over time, this can intuitively explain why older language families have a higher value of²than the younger ones.
References
T. Arita and C. E. Taylor. 1996. A simple model for the evolution of communication. In L. J. Fo-gel, P. J. Angeline and T. B¨ack, editors,The Fifth Annual Conference On Evolutionary Programming, 405–410. MIT Press.
M. Balter. 2003. Early date for the birth of Indo-European languages.Science302(5650), 1490.
A.-L. Barab´asi and R. Albert. 1999. Emergence of scaling in random networks.Science286, 509-512.
D. Bickerton. 1990. Language and Species, The Uni-versity of Chicago Press, Chicago.
B. de Boer. 2000. Self-organization in vowel systems.
Journal of Phonetics,28(4), 441–465.
R. Ferrer i Cancho and R. V. Sol´e. 2001. The small-world of human language.Proceedings of the Royal Society of London, Series B, Biological Sciences, 268(1482), 1228–1235.
R. Ferrer i Cancho and R. V. Sol´e. 2004. Patterns in syntactic dependency networks. Phys. Rev. E, 69(051915).
R. G. Gordon (ed.) 2005. Ethnologue: Languages of the World, Fifteenth edition, SIL International.
M. Haspelmath, M. S. Dryer, D. Gil and B. Comrie (ed.) 2005. World Atlas of Language Structures, Oxford University Press.
M. Choudhury, A. Mukherjee, A. Basu and N. Gan-guly. 2006. Analysis and synthesis of the distri-bution of consonants over languages: A complex network approach.Proceedings of the 21st
Interna-tional Conference on ComputaInterna-tional Linguistics and 44th Annual Meeting of the Association for
Com-putational Linguistics, Main Conference Poster Ses-sions, 128–135.
M. Choudhury and A. Mukherjee. to appear. The structure and dynamics of linguistic networks. In N. Ganguly, A. Deutsch and A. Mukherjee, editors, Dy-namics on and of Complex Networks: Applications to Biology, Computer Science, Economics, and the Social Sciences, Birkhauser, Springer, Boston.
S. N. Dorogovtsev and J. F. F. Mendes. 2001. Lan-guage as an evolving word web.Proceedings of the Royal Society of London, Series B, Biological Sci-ences,268(1485), 2603–2606.
M. S. Dryer. 1992. The Greenbergian word order cor-relations.Language,68, 81–138.
M. D. Hauser, N. Chomsky and W. T. Fitch. 2002. The faculty of language: What is it, who has it, and how did it evolve?Science,298, 1569–1579.
F. Hinskens and J. Weijer. 2003. Patterns of segmen-tal modification in consonant inventories: a cross-linguistic study.Linguistics,41(6), 1041–1084.
R. Jakobson. 1968. Child Language, Aphasia and Phonological Universals. The Hague: Mouton.
H. Jeong, B. Tombor, R. Albert, Z. N. Oltvai and A. L. Barab´asi. 2000. The large-scale organization of metabolic networks.Nature,406, 651-654.
S. Kirby. 1998. Fitness and the selective adaptation of language. In J. R. Hurford, M. Studdert-Kennedy and C. Knight, editors,Approaches to the Evolution of Language: Social and Cognitive Bases, 359–383. Cambridge: Cambridge University Press.
P. Ladefoged and I. Maddieson. 1996. Sounds of the Worlds Languages, Oxford: Blackwell.
B. Lindblom and I. Maddieson. 1988. Phonetic univer-sals in consonant systems. In L.M. Hyman and C.N. Li, eds., Language, Speech, and Mind, Routledge, London, 62–78.
D. Livingstone and C. Fyfe. 1999. Modelling the evolution of linguistic diversity. In D. Floreano, J. Nicoud and F. Mondada, editors, ECAL 99, 704– 708, Berlin: Springer-Verlag.
J. L. Locke. 1983. Phonological Acquisition and Change. Academic Press New York.
I. Maddieson. 1984. Patterns of Sounds, Cambridge University Press, Cambridge.
D. Nettle. 1999. Is the rate of linguistic change con-stant?Lingua,108(2):119–136.
M. E. J. Newman. 2001. Scientific collaboration net-works.Physical Review E64, 016131.
M. E. J. Newman. 2003. The structure and function of complex networks.SIAM Review45, 167–256.
F. Peruani, M. Choudhury, A. Mukherjee and N. Gan-guly. 2007. Emergence of a non-scaling degree dis-tribution in bipartite networks: a numerical and ana-lytical study.Euro. Phys. Letters76, 28001 (p1–p6).
S. Pinker. 1994. The Language Instinct, New York: William Morrow.
E. Pulleyblank. 1993. The typology of Indo-European.
Journal of Indo-European Studies, p. 109.
Jos´e J. Ramasco, S. N. Dorogovtsev, and Romualdo Pastor-Satorras. 2004. Self-organization of collabo-ration networks.Physical Review E,70, 036106.
R. V. Sol´e , B. C. Murtra, S. Valverde and L. Steels. 2005. Language networks: Their structure, function and evolution.Santa Fe working paper, 05-12-042.
R. Tomlin. 1986. Basic Word Order: Functional Prin-ciples, Croom Helm, London.
N. Trubetzkoy. 1931. Die phonologischen systeme.
TCLP4, 96–116.