Mobile App Retention
Agustin Zuniga, Huber Flores
Eemil Lagerspetz, Sasu Tarkoma
University of Helsinki, Finland [email protected]
Jukka Manner
Aalto University, FinlandPan Hui
University of Helsinki, Finland HKUST, Hong Kong
Petteri Nurmi
University of Helsinki, Finland Lancaster University, United KingdomABSTRACT
We contribute by quantifying the effect of network latency and battery consumption on mobile app performance and retention, i.e., user’s decisions to continue or stop using apps. We perform our analysis by fusing two large-scalecrowdsenseddatasets collected by piggybacking on information captured by mobile apps. We find that app performance has an impact in its retention rate. Our re-sults demonstrate that high energy consumption and high latency decrease the likelihood of retaining an app. Conversely, we show that reducing latency or energy consumption does not guarantee higher likelihood of retention as long as they are within reasonable standards of performance. However, we also demonstrate that what is considered reasonable depends on what users have been accus-tomed to, with device and network characteristics, and app category playing a role. As our second contribution, we develop a model for predicting retention based on performance metrics. We demon-strate the benefits of our model through empirical benchmarks which show that our model not only predicts retention accurately, but generalizes well across application categories, locations and other factors moderating the effect of performance.
CCS CONCEPTS
•General and reference→Cross-computing tools and tech-niques; •Networks→Network performance evaluation; • Com-puting methodologies→ Modeling and simulation.
KEYWORDS
performance evaluation, crowdsensing, data fusion, mobile com-puting, apps retention, mobile networks, energy consumption.
ACM Reference Format:
Agustin Zuniga, Huber Flores, Eemil Lagerspetz, Sasu Tarkoma, Jukka Manner, Pan Hui, and Petteri Nurmi. 2019. Tortoise or Hare? Quantifying the Effects of Performance on Mobile App Retention. InProceedings of the 2019 World Wide Web Conference (WWW ’19), May 13–17, 2019, San
This paper is published under the Creative Commons Attribution 4.0 International (CC-BY 4.0) license. Authors reserve their rights to disseminate the work on their personal and corporate Web sites with the appropriate attribution.
WWW ’19, May 13–17, 2019, San Francisco, CA, USA
© 2019 IW3C2 (International World Wide Web Conference Committee), published under Creative Commons CC-BY 4.0 License.
ACM ISBN 978-1-4503-6674-8/19/05. https://doi.org/10.1145/3308558.3313428
Francisco, CA, USA.ACM, New York, NY, USA, 12 pages. https://doi.org/10. 1145/3308558.3313428
1
INTRODUCTION
Nowadays there is an app for almost everything with Apple App-Store, Google Play and other major marketplaces offering millions of apps to users [48]. While the total number of apps on the mar-ketplaces is high, a large fraction of them vanish without ever attracting a significant user base, and the majority of the rest strug-gle to maintain their user base over time. Specifically, studies on mobile app usage suggest that over a quarter of installed apps are only used once [25], and even apps used for more than a day are unlikely to stay relevant longer than a fortnight [46].
while latency is influenced by mobility, network operator, com-munication technology and available network infrastructure [20]. Characterizing performance would thus require collecting a large number of samples to ensure all relevant contexts are captured – something that would take prohibitively long or require battery heavy sampling when performed on individual device [20, 22].
In this paper, we contribute by quantifying the relationship be-tween mobile application performance and retention, i.e., whether users are willing to continue using an app. We perform our analysis by fusing two large-scale datasets ofcrowdsensedmeasurements collected by piggybacking on information collected by mobile apps. Crowdsensing allows reaching a larger pool of users and usage contexts by taking advantage of existing application distribution channels, such as mobile app marketplaces. By piggybacking on mobile app data, the overhead of data collection is minimized and separate instrumentation of the devices is avoided, unlike in intru-sive client-side monitoring. The first dataset we consider consists of detailed information about network latency [47] and the sec-ond contains information about energy consumption and mobile app usage [32]. To analyze the combined effect of these perfor-mance factors, we build on statistical survey analysis methods (hot deck multiple imputation [2, 41]) to fuse the datasets together. Our analysis focuses on energy consumption and latency as they have been shown to be key components in shaping user’s perceptions of apps [23, 27]. Indeed, energy drain is known to be a major source of frustration and cognitive burden as users are forced to actively take countermeasures to prolong their battery lifetime [6, 38, 39]. Impor-tance of energy is also reflected by the high popularity of energy saving apps on mobile marketplaces [32]. Latency, in turn, affects user engagement and results in shorter interactions and higher degree of frustration [11, 18]. While importance of these perfor-mance parameters has been established beyond doubt, their effect on continued mobile application usage is currently not understood. Our analysis reveals that both high energy consumption and high degree of latency decrease the likelihood of retaining an app. Conversely, we show that decreasing latency or battery consump-tion does not guarantee higher likelihood of retenconsump-tion - as long as they are within reasonable standards of performance. However, what is considered reasonable depends on what the users have been accustomed to, with the app category, device characteristics, and network characteristics having an influence. For example, we find the level of expected latency to be lower in Finland than in USA, thanks to faster network infrastructure and consequently differing user expectations. To provide further insights into app retention and abandonment, as our second contribution, we develop a model thatpredicts the extent that performance affects retention. We demon-strate the benefits of our model through empirical benchmarks which show that our model not only predicts retention accuracy, but generalizes well across application categories, locations and other factors moderating the effect of performance.
Summary of Contributions:
•We demonstrate that latency and energy, two key performance metrics for mobile apps, have a significant adverse effect on mo-bile app retention and abandonment and that this effect is stable across most application categories. However, we also conversely demonstrate that improving latency and energy drain does not
Table 1: Summary statistics of application usage and net-work connectivity datasets.
Dataset Samples Users Apps Time NetRadar[47] 875,907 - - Jan 1 - Dec 31, 2016
Carat[32] 19,608,938 25,402 48,770 Jul 1 - Dec 31, 2016
Combined 1,000,058 (Latency)
2,819,748 (Energy) 1,241 243 Jul 1 - Dec 31, 2016
guarantee improvements in retention as long as the performance metrics are within reasonable levels.
• We derivecritical pointsfor popular applications and applica-tion categories, demonstrating that the point where performance has a significant effect varies depending on the level of perfor-mance people are accustomed to, as well as the functionality and category of the application.
• We further explain our findings through a model that predicts the extent that performance affects retention. Our model achieves an overall error of 1.4 percentage points (measured using Mean Absolute Error MAE) of retention across all data.
2
DATASETS AND PREPARATION
We quantify the effect of performance-related variables on long-term application usage by analyzing two large-scale crowdsensed datasets. Our first dataset, NetRadar [47], contains information about network performance at different locations, whereas the sec-ond dataset, Carat [32], contains information about mobile appli-cation usage and energy drain of appliappli-cations.1To analyze overall impact of performance, we fuse the two datasets using coarse-grained location and timezone information. While instrumenting a single application to monitor both energy and latency is technically feasible, in practice the functionalities for sampling network or en-ergy differ significantly, which would make attracting sufficiently large user base difficult. Indeed, network profilers are typically used sporadically instead of continuous data collection. Continually col-lecting network performance measures, on the other hand, would significantly increase energy overhead from sampling and thus be contrary to the original purpose of energy-awareness apps.
After combining the datasets, we select those countries with highest amounts of data for our analysis. In the intersection of the two datasets, 91% of data is from Finland and USA, and 93% of the USA data is from Eastern USA. This is mainly due to demographics of the user populations of the mobile apps which were used to collect measurements. As a result, we focus our analysis in Finland and USA (EST - Eastern Standard Time). In the remainder of the paper we use EST-USA to refer to the measurements collected from USA that are included in our analysis. The datasets considered in our study are summarized in Table 1.
2.1
Network Latency
Latency directly influences the response time of applications and consequently has a major impact on the observed performance. Several application categories, such as on-line gaming and web conferencing [49], require low latency while for many others it can
1The datasets are available through separate license agreements. More information
cause frustration even if it is not critical for running the app [11, 18]. For these reasons, we consider latency as a performance - related parameter in our experiments. As source of latency data we con-sider data collected through NetRadar, a mobile app designed for end-users to help diagnose network conditions [47]. The data con-sidered in our analysis consists of samples collected during cellular network connectivity and contain timestamp, average RTT latency calculated during a 5 second window interval, mobile network in-formation in the form of mobile country code (MCC) and mobile network code (MNC), and GPS location. We restrict our analysis on cellular network connectivity as Wi-Fi has higher bandwidth than cellular technologies and as its performance has less variation overall [16, 17]. Another reason to limit on cellular networks is that this guarantees our analysis to capture a broad range of usage contexts and higher spectrum of mobility patterns.
Figure 1a compares the latency distributions of Finland and EST-USA in the NetRadar dataset. The two locations have distinct latency distributions with Finland having lower expected latency than EST-USA (median 36ms vs. 66ms). The overall variation within Finland is several orders of magnitude smaller with the majority of values being within 45ms. For EST-USA, latency is mostly in the range between 40 to 100ms, but we can observe smaller peaks at around 140ms and even at 200ms. While the values of the distri-butions differ, the shape of the two distridistri-butions is similar with both being long-tailed and skewed towards lower values. To put the values into context, most latencies for Finland are below 70ms which is within LTE network range. For EST-USA, the majority of values is within LTE range, but we can also observe values over 100ms which are likely to correspond to 3G connectivity - or even 2G at the end of the tail. This would suggest there are differences in network infrastructure, or mobile subscriptions, within the two locations. These differences in latency distributions, and charac-teristics of the underlying network infrastructure motivate us to consider the two locations separately in our analysis.
2.2
Energy Consumption
Our second performance factor, energy, has been shown to be an active source of frustration and a cognitive burden as users actively seek to prolong their battery lifetime [6, 38, 39]. As source of en-ergy consumption measurements we consider Carat [32], a popular mobile energy-awareness application. Carat samples the device whenever battery level changes. Each sample contains current bat-tery level, timestamp, list of running applications and additional attributes, such as device uptime and battery state.
As unit of analysis we considerenergy rateswhich correspond to the relative change in battery in a given time interval. Formally, let ∆bdenote change in battery between successive samples, and let ∆tdenote the difference in timestamps. Energy rate is then defined as the mean change in battery over the interval, i.e.,e =∆b/∆t. We only consider samples where rate is positive (negative rate indicates charging), battery state is not charging (AC or USB), and device uptime has increased from last sample (device has not been turned off in between). We restrict our analysis to samples collected from Android devices as information about running applications cannot be accessed on other platforms and because the sampling granularity on Android devices is better than on iOS devices.
0 0.02 0.04 0.06
30 35 40 50 60 70 80100 150 200 300
Latency[ms]
Density
(a) Latency
0 50 100 150
0 0.003 0.006 0.009 0.012 0.015 0.018 Enery rate [Δbattery/Δtime]
Density
[image:3.612.318.559.84.176.2](b) Energy rate
Figure 1: Comparison of latency and energy rate distribu-tions between Finland and Eastern USA.
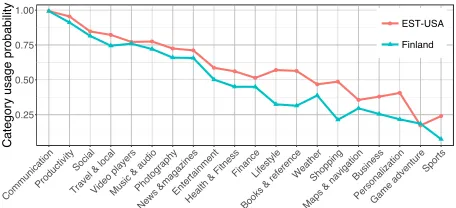
0.25 0.50 0.75 1.00
Communication Productivity
Social
Travel & localVideo playersMusic & audioPhotography News &magazines
Entertainment Health & Fitness
FinanceLifestyle
Books & reference WeatherShopping
Maps & navigation Business
PersonalizationGame adventure Sports
Category usage probability
EST-USA Finland
Figure 2: App category use profile differs between locations.
To study energy consumption of applicationa, we take all rates
eacontainingain the list of currently running apps and calculate the mean rateeafor the application. Since energy consumption fluc-tuates due to environmental variables (e.g., Wi-Fi and strength of cellular signal) and specific system settings (e.g., screen brightness or use of location tracking), and other currently running applica-tions, we represent energy consumption using the 95% standard error of the mean (SEM) confidence interval [32] given by
ea,r anдe=ea±h·√σa
na, (1)
whereh = 1.96 is the confidence interval coefficient,σa is the standard deviation, andnais the number of samples containinga. Figure 1b compares energy consumption distributions of Finland and EST-USA. Compared to latency, the distributions are closer to each other (mean rate 0.0056 for Finland cf. 0.0051 for EST-USA) and have similar variance, with 44% and 45% of apps exceeding the average in Finland and EST-USA, respectively. To put these values into context, the means correspond to around 5 battery life while most apps are in the range of 5-9 hours. Note that Carat flags applications with very heavy energy drain as hogs and recommends the user to remove them [32]. For this reason applications with very low expected battery life are rare in the dataset.
[image:3.612.323.551.223.327.2]2.3
Retention Rate
The main focus of our work is on analyzing and quantifying how performance related factors affect long-term user behavior. As mea-sure of user behavior we considernday retention rate, which is the fraction of users continuing to use an appndays since first use. Retention is widely used to measure the success of apps as higher retention corresponds to higher adoption and level of en-gagement [46]. As source of retention information we use the list of running applications collected by Carat. The list of applications contains all applications running on the device, including those related with the operating system and those pre-installed by the manufacturer. To ensure our analysis focuses on actual usage, we filter the applications by (i) removing all apps for which no category information is found on Google Play; and (ii) removing pre-loaded applications that have not been seen on the foreground, such as Google Exchange Services (com.google.android.exchange).
To estimate retention, letduadenote the number of days between first and last use of an applicationaby useruin the Carat data. To ensure retention is not influenced by the data collection period, we only consider cases where we have measurements for 7 days before first use, and 7 days after last use. Similarly, to ensure the estimated retention patterns are sufficiently robust, we only consider users that have at least 14 days of data, and apps that have at least 10 users that have used them for more than a day. Thenday retention rate ofa, denotedrna, is then given by the fraction of users whose retention timeduais higher thann, i.e.,
rna=#Ua,n
#Ua ·100 (2)
whereUais the set of users to usea, andUa,n⊆Uais the subset of users for whomdua ≥n. Note that retention rate is cumulative so a user withda=3 days also contributes to day 1 and 2 retention.
Table 2 compares the average retention over the first 7 days across the two locations for the 5 most popular applications. From the table we can observe the two locations to have distinct retention patterns with Finland having higher mean retention than EST-USA, but also much higher variation. To highlight differences in usage across the locations, as part of the table, we have also included the number of users, number of samples and summary statistics of the performance variables for the apps. While the number of users tends to be lower in EST-USA than in Finland, we can observe that the number of samples to characterize each performance variable is enough for both locations. In terms of retention behavior, one of the applications, Dropbox, has lower latency but higher energy drain in Finland than in EST-USA, which suggests that it is used in differing situations. These differences in retention and usage patterns further serve to illustrate the need to consider the measurements separately.
2.4
Combining Datasets
Different performance factors are typically closely linked with each other. For example, latency results in energy drain, and networking technology has a major impact on energy use [26, 37, 47]. To analyze and quantify the combined effect of performance factors, we thus need to combine measurements in the two datasets. We perform the combination using hot deck multiple imputation, a widely used method for aligning two datasets that overlap only partially [2, 30, 41]. The idea in hot deck imputation is to fill in missing values
(in the combined set) with items that are similar (in the individual data sets). In our analysis we consider the combined dataset as our primary source of analysis as this ensures the usage contexts where performance is captured are comparable across the datasets.
Data Fusion:We combine the datasets using a combination of timestamp, and coarse grained location information given by Mo-bile Country Code (MCC), MoMo-bile Network Code (MNC) and reverse geocoding of the GPS (time zone from the cellular coverage). The sampling periods of the datasets differ and hence we first need to align them temporally. We perform the alignment by creating hourly bins and mapping each sample in NetRadar and Carat to the closest bin. Next, we match the (MCC, MNC, Time zone) tuples across the two datasets in each bin and calculate hourly latency values for a given location as medians of all matching measure-ments. The measurements in the combined dataset are summarized in Table 1. In total, the combined dataset comprises 243 applications and 1,241 users from July to December, 2016. This is translated in terms of samples to 1,000,058 measurements for analyzing latency, and 2,819,748 measurements for analyzing energy. The reason for differing sample counts for energy and latency is that we perform the matching separately for each application and category consid-ered in our analysis. As the energy dataset is originally larger, this results in a higher total sample count of energy.
Validity:We demonstrate the validity of the combined dataset by comparing statistical characteristics extracted from the combined data against those extracted from the individual datasets. First, we compare mean latency and energy of the individual datasets to those of the combined set. The mean and standard deviation values for both latency (Finland, mean = 38.27, SD = 12.31; EST-USA, mean = 87.45, SD = 61.34; combined, Finland mean = 36.7, SD = 6.6; EST-USA, mean = 84.4, SD = 53.4) and energy (Finland, mean = 0.0053, SD = 0.012; EST-USA, mean = 0.0059, SD = 0.016; combined, Finland mean = 0.0056, SD = 0.003; EST-USA, mean = 0.0051, SD = 0.0023) are closely aligned, suggesting that the statistical characteristics of the individual datasets are preserved in the fusion. Second, we compare the sample distributions between the combined and individual datasets using Kolmogorov-Smirnov distribution tests. No statistically significant differences were found (latency: FinlandKS =0.104; EST-USKS=0.096,p>0.05; energy: FinlandKS =0.04; EST-USKS =0.05,p>0.05).
Representativeness:We assess whether the energy distribution of Eastern USA is representative of USA as a whole by compar-ing energy distributions of all samples from USA against those matched to Eastern USA based on timezone information. Again, no significant differences were found (KS=0.06,p>0.05).
2.5
Privacy
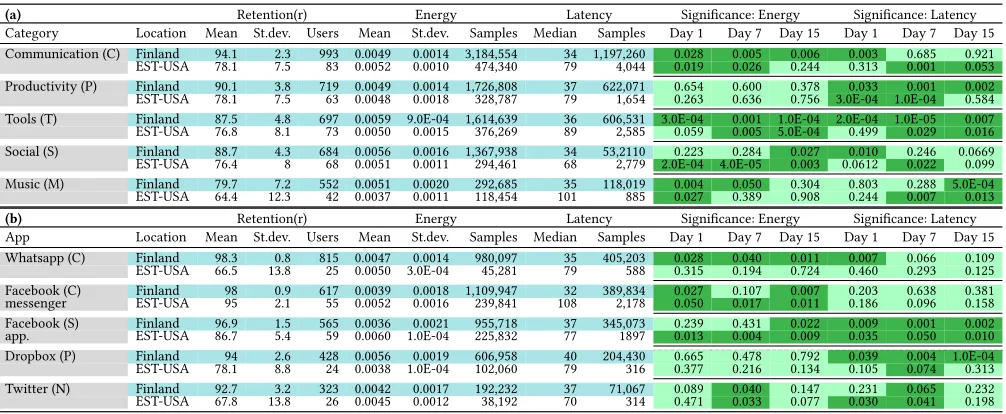
Table 2:Retention rate variation, energy and latency, and influence of app performance in retention for top 5 categories (a) and applications (b) together with statistical analysis results of the importance of performance on retention. Darker colors reflect statistical significance (p ≤0.05).
(a) Retention(r) Energy Latency Significance: Energy Significance: Latency
Category Location Mean St.dev. Users Mean St.dev. Samples Median Samples Day 1 Day 7 Day 15 Day 1 Day 7 Day 15 Communication (C) Finland 94.1 2.3 993 0.0049 0.0014 3,184,554 34 1,197,260 0.028 0.005 0.006 0.003 0.685 0.921 EST-USA 78.1 7.5 83 0.0052 0.0010 474,340 79 4,044 0.019 0.026 0.244 0.313 0.001 0.053 Productivity (P) Finland 90.1 3.8 719 0.0049 0.0014 1,726,808 37 622,071 0.654 0.600 0.378 0.033 0.001 0.002 EST-USA 78.1 7.5 63 0.0048 0.0018 328,787 79 1,654 0.263 0.636 0.756 3.0E-04 1.0E-04 0.584 Tools (T) Finland 87.5 4.8 697 0.0059 9.0E-04 1,614,639 36 606,531 3.0E-04 0.001 1.0E-04 2.0E-04 1.0E-05 0.007 EST-USA 76.8 8.1 73 0.0050 0.0015 376,269 89 2,585 0.059 0.005 5.0E-04 0.499 0.029 0.016 Social (S) Finland 88.7 4.3 684 0.0056 0.0016 1,367,938 34 53,2110 0.223 0.284 0.027 0.010 0.246 0.0669 EST-USA 76.4 8 68 0.0051 0.0011 294,461 68 2,779 2.0E-04 4.0E-05 0.003 0.0612 0.022 0.099 Music (M) Finland 79.7 7.2 552 0.0051 0.0020 292,685 35 118,019 0.004 0.050 0.304 0.803 0.288 5.0E-04 EST-USA 64.4 12.3 42 0.0037 0.0011 118,454 101 885 0.027 0.389 0.908 0.244 0.007 0.013
(b) Retention(r) Energy Latency Significance: Energy Significance: Latency
App Location Mean St.dev. Users Mean St.dev. Samples Median Samples Day 1 Day 7 Day 15 Day 1 Day 7 Day 15 Whatsapp (C) Finland 98.3 0.8 815 0.0047 0.0014 980,097 35 405,203 0.028 0.040 0.011 0.007 0.066 0.109 EST-USA 66.5 13.8 25 0.0050 3.0E-04 45,281 79 588 0.315 0.194 0.724 0.460 0.293 0.125 Facebook (C) Finland 98 0.9 617 0.0039 0.0018 1,109,947 32 389,834 0.027 0.107 0.007 0.203 0.638 0.381 messenger EST-USA 95 2.1 55 0.0052 0.0016 239,841 108 2,178 0.050 0.017 0.011 0.186 0.096 0.158 Facebook (S) Finland 96.9 1.5 565 0.0036 0.0021 955,718 37 345,073 0.239 0.431 0.022 0.009 0.001 0.002 app. EST-USA 86.7 5.4 59 0.0060 1.0E-04 225,832 77 1897 0.013 0.004 0.009 0.035 0.050 0.010 Dropbox (P) Finland 94 2.6 428 0.0056 0.0019 606,958 40 204,430 0.665 0.478 0.792 0.039 0.004 1.0E-04 EST-USA 78.1 8.8 24 0.0038 1.0E-04 102,060 79 316 0.377 0.216 0.134 0.105 0.074 0.313 Twitter (N) Finland 92.7 3.2 323 0.0042 0.0017 192,232 37 71,067 0.089 0.040 0.147 0.231 0.065 0.232 EST-USA 67.8 13.8 26 0.0045 0.0012 38,192 70 314 0.471 0.033 0.077 0.030 0.041 0.198
3
QUANTIFYING EFFECT OF PERFORMANCE
ON RETENTION
In this section, wequantify, for the first time, the impact of perfor-mance related factors on long-term user behavior, as reflected by retention. We focus on latency and energy as the main performance related variables and analyze them using the Netradar and Carat datasets described in the previous section (see Sections 2.1 and 2.2). We first consider the impact of latency and energy individually, showing they indeed have a significant influence on retention. We proceed to quantify the point where the effect of performance be-comes significant, demonstrating that we can identify acritical point beyond with performance has a clear effect. We also demon-strate that the effects of energy and latency are moderated by user expectations and by application functionality. We end the section by analyzing the combined effect of latency and energy, showing them to have a complex relationship where neither variable alone is capable of explaining retention.
3.1
Performance Influences Retention
We begin our analysis by demonstrating and quantifying the overall influence of latency and energy asindividualperformance-related variables on retention, analyzing their combined effect in Sec. 3.6. Both latency and energy have been shown to affect user experi-ence [27], and hexperi-ence to have an indirect effect on long term user behavior. However, whether they have a direct effect on retention has not been previously established. We assess overall effect using Kruskal-Wallis test and considering the five most popular appli-cation categories (Communiappli-cation, Productivity, Tools, Music & Audio, and Social) and applications (Dropbox, Facebook Messenger, Whatsapp, Facebook, Twitter). For each day of the retention period (1−15 days), we compare the mean performance of those that stop using the application and those that retain it.
Table 2 shows results of statistical tests at both category-level and app-level together with corresponding retention and performance
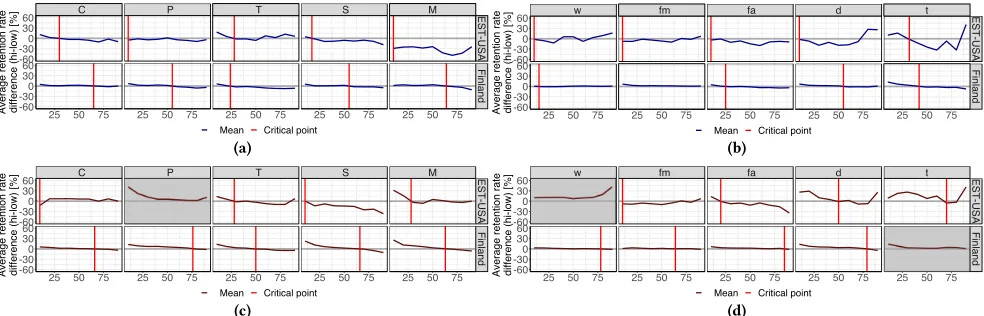
Table 3:Retention rate difference ofhiдhandlowgroups propor-tions for app categories and apps: L: Latency, E: Energy; O: Overall, C: Communications, P: Productivity, T: Tools, S: Social, M: Music, w: Whatsapp, fm: Facebook Msg., fa: Facebook, d: Dropbox, t: Twitter.
Area, Factor O C P T S M w fm fa d t
Finland, L 63 67 58 26 65 67 10 84 30 57 45
Finland, E 69 63 78 50 67 63 50 43 69 78 51
EST-USA, L 24 32 10 18 25 10 10 10 10 10 31
EST-USA, E 52 10 64 25 11 29 10 10 10 10 10
values. From the results, we can observe that performance indeed affects retention, but the effect is moderated by application category and popularity of the app. We can also observe the effects to reflect differing interaction patterns across application categories. For example, messaging apps (Facebook messenger and Whatsapp) that require users to wait for response are not influenced by latency but energy drain has significant effect on their retention. On the other hand, productivity apps, which tend to be used for shorter periods of time, demonstrate significant effect for latency but not for energy. Comparing effects across number of days, we can observe users to have different levels of tolerance for poor performance depending on application category. For example, Music apps show no effect on latency at day 1, and even at day 7 they only show an effect in Eastern USA where latency is higher than in Finland. However, at day 15 latency has a significant effect for both locations. Similarly, effects of energy are higher for later days for both Facebook and Twitter, suggesting users are willing to tolerate more performance issues with them – potentially because other factors, such as user experience, are more important during the first few days.
between performance related variables and retention in more detail, showing that we can identify clear points where decrease in perfor-mance results in lower retention. We refer to these points ascritical pointsof performance. Conversely, we demonstrate that improving performance beyond this point has no influence on retention.
We carry out the analysis by splitting users into two performance groups using a thresholdvon the two performance factor, and com-pare the retention in the two groups using a test of proportions (i.e., a two-tailed z-test). We iterate over different values ofvconsidering values between the 10thand 90thpercentile identifying the range of values where retention is significantly different. We omit the lowest and highest 10 percentiles as these resulted in the smaller group having insufficient data for assessing statistical significance. In the following we refer to the two user groups ashighandlow depending on which side ofvthe average performance of users in the corresponding group is.
Table 3 shows the percentile of latency and energy after which the test of proportions indicates difference in retention rate between the low and high groups to be statistically significant (p<0.05). We show percentiles instead of exact performance values due to the fact that the values vary across categories and applications depending on which samples include the category or application. From the results we can see clear differences in the points where performance start to influence retention. Mirroring the results of previous section, we can see that both the category and applica-tion moderate the results Besides the category and applicaapplica-tion, we can also observelocationto heavily moderate the level where performance starts to influence retention. In Finland, significant differences start to occur only at higher percentiles, whereas in Eastern USA significances start to appear earlier. As an example, latency higher than 60thpercentile has significant effect of reten-tion across all applicareten-tion categories in Finland, whereas in USA the effect is significant already from 30thpercentile onwards. Simi-larly, energy starts to have an effect at much earlier percentile in Eastern USA than in Finland. For latency, this difference can be partially explained by differences in network infrastructure, with users in Finland having lower latency and less variability than users in Eastern USA. However, for energy this is not the case with the distributions being similar across the two locations. Consequently, this suggests that users at different locations either assign different importance to energy or have different levels of tolerance.
3.3
Difference in the Effect of Performance
In the previous section we showed there to be a critical point beyond which performance starts to have a significant effect on retention. We next analyze the extent at which individual performance factors start to have a significant effect on retention during app usage.To perform this analysis, we first calculate the difference in re-tention percentage between the high and low groups. Figure 3 shows the results. We identify in the figure the percentile where the changes first become significant and can start to be quantified (critical point depicted as vertical line). Points where the differ-ence is negative correspond to cases where retention drops in line with performance degradation. From the figure we can observe thestrengthof significance to vary considerably across locations, categories, and applications. We also can see that, depending on the
Table 4: Critical Point and∆Pfor top 5 categories and apps.
Critical Point, EST-US Critical Point, Fin
Category Energ. Lat. ∆P Energ. Lat. ∆P
Communication 10 27 -17 64 67 -3
Productivity N/A 10 N/A 79 58 21
Tools 24 28 -4 50 23 27
Social 11 16 -5 67 58 93
Music 29 10 19 64 67 -3
App Energ. Lat. ∆P Energ. Lat. ∆P
Whatsapp N/A 10 N/A 74 11 63
Facebook Msg. 10 10 0 84 N/A N/A
Facebook App. 19 10 9 87 30 57
Dropbox 46 10 36 80 57 23
Twitter 70 31 39 N/A 45 N/A
category, the percentile at which performance differences become significant varies between energy and latency, with one factor typ-ically having a significant effect much earlier than the other. We also can observe that for a few cases, the performance factor does not seem to influence the retention (gray background). Most of these cases correspond to communications apps, such as Whatsapp and Facebook messenger, which are commonly used within social circles and whose usage is moderated by level of social activity [44]. Even if the performance of these apps would be suboptimal, replac-ing them would require the user’s entire social circle to migrate to a new service, which is unlikely to happen rapidly.
To further analyze these differences in significance, Figure 4 compares the difference in critical points (CP) between energy and latency, represented as difference in percentiles∆P. In the Figure we consider the collection of all applications across all categories for both, Finland and Eastern USA. Interestingly, when the effect of latency is perceived first, the area of∆Pcovers a wider percentile range than in the opposite case. Indeed, when latency is the first to have an effect, energy becomes significant only at much later percentages. This relation is explored in Table 4 for all categories and apps considered in our analysis. We analyze this relation by calculating a (Kendall) correlation between CPs for both factors. We observe a positive correlation between CPs for both categories (0.51,p=0.04) and apps (0.62,p=0.05). From the table, we see indeed greater difference between energy and latency when latency is perceived first to decrease performance. We can observe that this relation is three-times as significant for apps than for categories. Intuitively, energy consumption of a particular application may take a long time for the user to discover, while network conditions can change rapidly within seconds and minutes. Therefore bad latency can be discovered much quicker than high energy con-sumption. Higher latency may also affect the energy consumption of the device, which can result in retention decreasing faster. Be-cause latency is a shorter-term phenomenon than battery life, the decreased retention is easily attributed to latency instead of both energy consumption and latency.
3.4
Effects on Highly-Rated Apps
C P T S M EST-USA
Finland
25 50 75 25 50 75 25 50 75 25 50 75 25 50 75
-60 -30 0 30 60
-60 -30 0 30 60
Average retention rate difference (hi-low) [%]
Mean Critical point (a)
w fm fa d t EST-USA
Finland
25 50 75 25 50 75 25 50 75 25 50 75 25 50 75 -60
-300 30 60
-60 -30 0 30 60
Average retention rate difference (hi-low) [%]
Mean Critical point
(b)
C P T S M EST-USA
Finland
25 50 75 25 50 75 25 50 75 25 50 75 25 50 75
-60 -30 0 30 60
-60 -30 0 30 60
Average retention rate difference (hi-low) [%]
Mean Critical point (c)
w fm fa d t EST-USA
Finland
25 50 75 25 50 75 25 50 75 25 50 75 25 50 75 -60
-30 0 30 60
-60 -30 0 30 60
Average retention rate difference (hi-low) [%]
Mean Critical point
[image:7.612.61.553.83.241.2](d)
Figure 3:Average retention difference forhiдhandlowgroups. (a), (b) Latency, (c), (d) Energy. Categories: O: Overall, C: Communications, P: Productivity, T: Tools, S: Social, M: Music; Apps: o: overall, w: Whatsapp, fm: Facebook Msg., fa: Facebook App., d: Dropbox, t: Twitter
EST-USA Finland
10 20 30 40 50 60 70 80 90 10 20 30 40 50 60 70 80 90 -5
0 5 10 15
Average retention rate difference (hi-low) [%]
Mean Energy Mean Latency Critical point
Figure 4:Overall average retention difference forhiдh andlow groups combining latency and energy "critical point" thresholds.
other factors, we analyze 10 applications that are not among the top apps of their categories but have high user satisfaction. As proxy for user satisfaction, we consider the star rating of the apps on Google Play store. As these applications have predominantly received high ratings, users are likely satisfied with the functionalities and user interface design of the apps. We omit most popular applications to avoid possible popularity biases influencing the retention of these apps. For our selection of apps, we also ensured that any negative ratings would not be caused by differences in functionality between commercial and free versions of the app, e.g., due to high amount of advertisement or restricted functionality.
[image:7.612.59.288.281.348.2]Table 5 shows results together with the applications and their rat-ings. We applied the same method to calculate the critical point(CP) and difference (DeltaP) (see Sec. 3.2). Latency has higher impact than energy for apps that highly depend on displaying on-line con-tent, such as Viaplay. Retention of apps used for personalization, such as Zedge, is more influenced by energy variations. The criti-cal points behave similarly for apps with similar functionality. For example, for both eBay and Aliexpress the critical point on latency is low whereas users are more tolerant to energy. As both applica-tions focus on online shopping are used only intermittently, the importance of latency is understandable. However, for utility apps, such as AVG and Avast, no clear patterns can be identified. Indeed, Avast is more sensitive to latency whereas AVG is more sensitive to energy. In summary, our results show that even for applications with high user ratings, clear critical points can be identified, sug-gesting that performance indeed has a major influence on their retention. Our analysis also suggests that the relative importance of latency and energy is dependent on the functionality of the app.
Table 5:Effect of performance in case study apps. r: retention, CP: Critical Point ,E: Energy, L: Latency; App: ag: AVG antivirus, aa: Avast antivirus, ac: Avast cleanup, f: Firefox, ae: Aliexpress, e: Ebay, v: Viaplay, h: Here WeGo, s: Sports tracker, z: Zedge; Categories: T: Tools, C: Communication, SH: Shopping, E: Entertainment, MA: Maps, H: Health, PE: Personalization.
Categ App Google⋆ r CP,E CP,L ∆P
T ag 4.5 90.2 10 22 -12
T aa 4.5 95.2 33 14 19
T ac 4.5 90 21 12 9
C f 4.4 84.1 37 90 -53
SH ae 4.6 88.2 71 31 40
SH e 4.4 79.2 49 10 39
E v 4.0 84.3 58 17 41
MA h 4.4 71.2 50 28 22
H s 4.5 70.6 56 21 35
PE z 4.6 92 10 73 -63
∆P, graph
10 30 60 90 -25
0 25
-250 25
-25 0 25
-25 0 25
-25 0 25
-25 0 25
-25 0 25
-250 25
-25 0 25
-25 0 25
3.5
Other Factors
To further demonstrate the robustness of our findings, we next demonstrate that the effect of performance is robust across other factors influencing user perceptions and retention.
apps. The sole exception was Twitter, for which we were unable to obtain a clear critical point earlier. In the 2018 data, the critical point is at 66thpercentile, which is in line with the other apps. The results thus suggest that the effect of energy on retention is robust over time. In fact our results suggest it has increased in importance since most critical points have shifted to lower percentiles.
Robustness against Energy Saving Mechanisms:To rule out potential biases resulting from the fact that our application data was collected using an energy-awareness app, we repeated our anal-ysis on all applications with energy rates lower than the average energy rate across all apps. For these apps neither Carat nor energy-efficiency mechanisms of the operating system trigger warnings, suggesting the effects of performance are direct result of user per-ceptions while using the app. The overall effect of energy persists. However, since their overall energy usage is low compared to other apps, critical points shift on average to a 17 percentile higher point.
3.6
Combined Effect of Latency and Energy
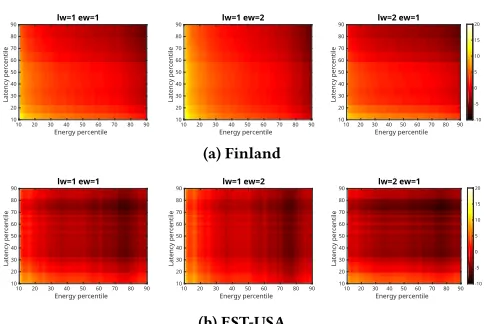
We next assess the combined effect of energy and latency by per-forming a cost-benefit analysis that looks at the combined effect on retention when the importance of individual factors is varied. To perform the analysis, we define a linear cost function that de-termines the overall effect of the two performance variables as a weighted combination of their individual effect. We consider differ-ent relative weightings to see how the importance of individual fac-tors affects retention. Formally, letrl andredenote the differences in retention between thehiдhandlowgroups (See Section 3.2), andlwandewthe weights of latency and energy, respectively. Given energyeandl, we estimate retention for a given performance level, denotedR(e,l), using
R(e,l)=re·ew+rl·lw
ew+lw . (3)
Figure 5 shows the results of our analysis as series of heatmaps. Each heatmap shows the combined effect of latency (y-axis) and energy (x-axis) on retention for different percentiles (10-90) and different weightslw andew. In the figure, lighter colors reflect retention improvement and darker ones worsened retention. The scale is in percentage units of retention.
From the figure we can observe the effect of performance factors to be non-linear with neither variable clearly dominating the other. When latency is twice as important as energy, the effect on retention is slightly higher than in the opposite case. However, even in this case there is a lot of variation and a highly complex relationship between the two performance variables.
4
MODELING RETENTION
Havingquantifiedthe effect of performance on retention, we next develop a mode forpredicting the degree to which performance affects retention. The model is important to estimate how users will respond to apps during their evolving life span, e.g., different releases with extra processing and network functionality.
Model specification:In our general model, app retention is in-fluenced byMfactorsFi,|1<=i<=M. Each factorFi has a per-formance thresholdϵi, whose changes affect the overall retention. Thus,ϵi depicts the starting point to quantify how incremental poor performance of a factor impacts app retention. By analyzing
lw=2 ew=1
10 2030 40 5060 70 8090
Energy percentile 10 20 30 40 50 60 70 80 90 Lat enc y pe rc ent ile -10 -5 0 5 10 15 20 lw=1 ew=2
10 20 30 40 50 60 70 80 90
Energy percentile 10 20 30 40 50 60 70 80 90 Lat enc y pe rc ent ile lw=1 ew=1
10 20 30 40 50 60 70 80 90
Energy percentile 10 20 30 40 50 60 70 80 90 Lat enc y pe rc ent ile lw=1 ew=0
10 20 30 40 50 60 70 80 90
Energy percentile 10 20 30 40 50 60 70 80 90 Lat enc y pe rc ent ile lw=0 ew=1
10 20 30 40 50 60 70 80 90
Energy percentile 10 20 30 40 50 60 70 80 90 Lat enc y pe rc ent ile (a) Finland lw=2 ew=1
10 20 3040 50 6070 80 90 Energy percentile 10 20 30 40 50 60 70 80 90 Lat enc y pe rc ent ile -10 -5 0 5 10 15 20 lw=1 ew=2
10 20 30 40 50 60 70 80 90 Energy percentile 10 20 30 40 50 60 70 80 90 Lat enc y pe rc ent ile lw=1 ew=1
10 20 30 40 50 60 70 80 90 Energy percentile 10 20 30 40 50 60 70 80 90 Lat enc y pe rc ent ile lw=1 ew=0
10 20 30 40 50 60 70 80 90 Energy percentile 10 20 30 40 50 60 70 80 90 Lat enc y pe rc ent ile lw=0 ew=1
[image:8.612.317.559.78.240.2]10 20 30 40 50 60 70 80 90 Energy percentile 10 20 30 40 50 60 70 80 90 Lat enc y pe rc ent ile (b) EST-USA
Figure 5: Retention behaviour for performance-related fac-tor given different weights of latencylwand energyew.
changes in performance relative toϵi, it is possible to estimate the amount of influence that a performance level has on retention. We estimate retention using a step function as depicted in equation 4, wherexis the performance value for a factor, e.g., 30 ms for latency; andдi(x)is an exponential probability function that approximates the retention rate of the factor given expected performance.
Ri(x)=
(
0, x ≤ϵi
дi(x), x >ϵi (4)
We then quantify the overall impact on retention by aggregating the influence of each individual factor. The overall impact of app performance on retention,R, is determined by the factorFi ∈M
whose influence on retention is highest, i.e.R =max(Ri). The expected retention rate is then calculated from the uninfluenced retention rate curver(x)by division as followsr′(x)=r(x)/R
Experimental Setup:We assess performance of our model by per-forming a 80/20 split for each country (Baseline). We also perform a cross-country validation between Finland and EST-USA subsets by training our model with data from Finland and predicting EST-USA retention based on expected performance, and vice versa. Following same approach, we also analyze the effect of mixing data from Fin-land and EST-USA (Mixed) into a single subset to predict retention. We then compare the performance of our model when predicting retention based on combined factors.
Individual factor prediction:The top part of Table 6 shows the results of the baseline. We can observe that our model indeed is able to predict retention values with lower error rate, specially for Finland as it is the country that has most of the data for our analysis. We then explore Cross-country validation. The Cross-countrysections of Table 6 shows the results for both latency and energy. From the result, we can observe that the error rate increases slightly compared to the country baseline. Our model has an average overall prediction MAE of 2.25, which depicts an overhead of 46% when compared with the baseline. However, we can observe a small error window in retention based expected latency for (EST-USA
Table 6:MAE for categories (model data→predicted), O: Overall, C: Communications, M: Music, P: Productivity, S: Social, T: Tools
Retention estimation O C M P S T
(Baseline) Latency
Finland (80%)→(20%) 0.91 0.54 1.67 0.98 0.83 1.72 EST-USA (80%)→(20%) 1.90 3.33 10.03 2.86 3.15 2.13
(Baseline) Battery
Finland (80%)→(20%) 0.63 0.30 0.75 0.73 1.12 1.08 EST-USA (80%)→(20%) 1.51 2.49 3.87 1.69 3.70 2.77
(Cross-country) Latency
Finland→EST-USA 3.58 5.00 31.99 3.76 7.13 2.29 EST-USA→Finland 1.66 6.49 37.06 3.39 8.15 2.01
(Cross-country) Battery
Finland→EST-USA 2.29 5.84 4.98 2.21 15.49 4.61 EST-USA→Finland 1.53 1.30 5.67 2.18 21.29 4.18
(Mixed Finland + EST-USA)
Latency(80%)→(20%) 0.82 0.50 1.10 0.85 0.61 1.49
Battery(80%)→(20%) 0.28 0.27 0.83 0.56 1.11 1.04
(Mixed Finland + EST-USA) Combined Latency+
Battery(80%)→(20%) 0.29 0.45 0.97 0.35 0.47 0.51
instance, when training our model with latency data from Finland to predict EST-USA, we can observe that the observed latency in Finland is between 30−45 ms while the ground truth of EST-USA consists of values around 51−147 ms. Clearly, the accuracy prediction of our model is reduced due to this issue.
On the other hand, when analyzing a specific application cate-gory, we observe a higher error rate, particularly when trying to generalize the data from EST-USA to Finland. The errors for cate-gories are influenced by the number of samples and applications included in the subset that is used to train the model (see Table 2). Additionally, the dominant applications of each category can differ in the two locations. For instance, in the case of the Music category, most of the collected data for Finland is from theSpotifyapp, while in the case of EST-USA, most of the data is from thePandora Music app (not available for installation in Finland), which explains the higher rate of error for the Music category. Similarly, the Tools category contains significant variation across the locations which explains worse predictive performance. However, for categories with similar usage patterns the results are well aligned across the two countries, like in the case of the Productivity category.
We then proceed to analyze the performance of our model when mixing the data of Finland and EST-USA to predict retention. The bottom of Table 6 shows the results. We can observe that our model improves significantly when mixing data from both countries. In-deed, we can observe very accurate predictions with marginal errors up to 1.49 for all the categories and for both factors.
Combined factor prediction:We analyze the effect on retention when multiple performance factors are taken into consideration. Since the accuracy of the prediction clearly is improved when mix-ing the data of both countries, we perform a 80/20 validation usmix-ing both mixed datasets for both energy and latency. In the combined effect, the value of retention is constrained by the factor that in-fluences the performance the most. In other words, the factor that is perceived first by users. Table 6 also shows the results for the combined prediction. Compared to the results of individual factors
(Baseline, Cross-country and Mixed), we can observe an improve-ment in overall retention prediction. We can observe a maximum marginal error of 0.51 for all the categories, which depicts around a 50% reduction in error when compared with our mixed model that performs the best in the individual factor analysis.
5
DISCUSSION
On data validity:The Carat application used as source of energy measurements records samples whenever the battery level changes, and may not be able to record data when the phone is in sleep mode, depending on the operating system version. Therefore, the data we see here is biased towards active use, and the resulting battery life values represent the remaining time for actively us-ing the device with a given application runnus-ing 100% of the time. In the dataset, the most commone(around 0.005) represents an active battery life of 5 hours. To mitigate these biases, we ensure selecting the location and apps with the most samples to foster better characterization of performance factors. Similar considera-tions apply to the NetRadar dataset used as source of latency data, which is predominantly collecting data whenever users explicitly request network performance assessment or periodically at user configurable intervals (between 1 and 120 minutes).
Data Quantity:Our validation of the retention prediction model suggests that number of training samples is critical for ensuring high quality predictions. In the case of Finland, data from several hundreds of users was obtained while for US only few tens of users were retained after data fusion. Our data was collected from two mobile applications that have been in long-term usage worldwide, suggesting that crowdsensing is indeed essential for capturing suffi-cient quantity of measurements. However, our results also highlight the difficulties whenmultiplecrowdsensing datasets need to be com-bined in that their intersection might be small, limiting the power of statistical analyses carried on it.
when battery life issues cause lower retention, latency can vary less before retention degrades further.
Energy efficiency models can influence retention:Extending battery life for smartphones is a primary research topic in academy and industry. Mobile devices are equipped with awareness mech-anisms that monitor energy consumption based on applications usage and resources utilization. Smartphones then can decide based on this information whether to stop, outsource, or moderate the execution of tasks to save energy. While these mechanisms indeed induce gains in energy as the computation of tasks are reduced, they can foster a collateral damage in the perception that users have towards apps. For instance, iOS devices implement a low power mode mechanism that reduces computation of applications in the background to save energy [43] . This suggests that app perfor-mance is reduced and augmented dynamically based on application usage. This can potentially affect retention as the responsiveness of applications is degraded. By using our model in conjunction with energy efficiency models, it is possible to equip smartphones with a smarter mechanism that can save energy without degrading per-formance to an extent in which it is not tolerable to users anymore. As shown in Sec. 3.5, both the overall effect and existence of critical points are robust against effects of these mechanisms.
Influence of performance depends on usage patterns: Appli-cation usage patterns can be very different. For example, Dropbox is a productivity application which mostly runs on the background synchronizing photos. When the user interacts with it, they do so to find or share a file, using it infrequently and for a short period of time, which results in smaller influence of performance degradation. On the other hand, Facebook and Twitter apps provide a continuous feed of updates enabling users to spend hours reading, watching, and interacting with content. Not only does this presenting a larger window of opportunity for performance issues to manifest, but this highlights how different usage patterns are likely to influence the importance of different performance factors.
6
RELATED WORK
Mobile App Quality:Previous research on mobile app quality has focused on exploring user perception of mobile apps. Common techniques include usability studies [42], contextual inquiries [19], sensor data logging [33], interviews [27], and text mining on user reviews [23]. These studies generally focus on the user’s perception instead of factors that affect it. Ickin et al. [27] list bugs, performance issues, and poor match with user needs as factors that influence quality perceptions while Chen et al. [12] show that app ratings are key driver for app downloads. While these factors affect app percep-tions, studies do not explain how these perceptions translate into changes in behaviour. Our research addresses this gap with existing studies, focusing specifically on the effect of app performance.
Mobile App Performance:There has also been research looking at modeling application performance through the steps involved by the user’s task [40] and the response time perceived by the user. Most relevant aspects causing bottlenecks in app performance have been shown to be network communication and processing costs. There have been research efforts to study network performance metrics and relate them with user satisfaction [1, 24]. The general
idea is to capture features, such as bitrate, jitter and delay metrics, and to use machine learning to predict user response times [5, 8, 31]. Approaches for dynamic resource augmentation have been proposed to alleviate bottlenecks, relying solely on the device’s resources [45] or remote infrastructure [21]. While performance has been modeled and improved, the level at which it starts to influence user perceptions has not been quantified previously.
Effect of Energy:Human interface studies have shown that 80% of mobile users will take steps to improve their battery life [39]. Past work have termed unnecessarily high energy consumption in applications asenergy bugs[34] and identified their possible causes, such as the environment or settings of the smartphone [37] and programming problems [35]. Regardless of the cause, an app that reduces battery life may end up getting uninstalled by users [3], and possibly replaced by a different app. Many applications try to improve energy consumption by controlling processes on the device, or helping users identify energy hungry applications [32] and raising the level of energy awareness among users [3].
Effect of Network Quality:Network quality has been studied mainly through the influence of latency on user experience in desk-top contexts and within specific application categories, e.g. online gaming [11, 49], education and video streaming [29, 50]. Studies on the former have shown that latency reduces session times, and that users actively seek countermeasures to reduce latency. In ed-ucation, latency has been a barrier for real-time interaction and collaboration, e.g., in Second Life. These findings, however, do not directly translate to mobile apps, since network quality can change abruptly depending on the technology (WiFi, 3G, LTE) and traffic conditions. Moreover, network quality also influences battery life, raising the impact of network quality on users.
7
SUMMARY AND CONCLUSION
The present paper contributed by quantifying the influence of two performance factors, latency and energy, on app retention. We find poor performance to increase likelihood of app abandonment. How-ever, the point at which the effect becomes significant depends on what the user is accustomed to, with app category, device charac-teristics and network characcharac-teristics having an influence. For exam-ple, Finland has lower expected latency than USA thanks to faster network infrastructure, and consequently user expectations differ between the two countries. Conversely, we find that improving app performance does not have any positive influence on retention as long as performance is within reasonable performance standards. Our results also indicate that latency and energy have a combined effect on app retention, but in most cases the effect of latency is perceived before energy. Lastly, we built a model that estimates retention based on the expected performance of an application. Performance validation considering cross-country performance demonstrated good performance across all application categories. However, this was moderated by application categories with those categories with limited overlap suffering in performance.
8
ACKNOWLEDGEMENTS
REFERENCES
[1] Vaneet Aggarwal, Emir Halepovic, Jeffrey Pang, Shobha Venkataraman, and He Yan. 2014. Prometheus: Toward Quality-of-Experience Estimation for Mobile Apps from Passive Network Measurements. InProceedings of the 15th ACM
Workshop on Mobile Computing Systems and Applications (HotMobile 2014). ACM,
18:1–18:6.
[2] Rebecca R Andridge and Roderick JA Little. 2010. A Review of Hot Deck Im-putation for Survey Non-Response.International Statistical Review78, 1 (2010), 40–64.
[3] Kumaribaba Athukorala, Eemil Lagerspetz, Maria von Kügelgen, Antti Jylhä, Adam J. Oliner, Giulio Jacucci, and Sasu Tarkoma. 2014. How Carat Affects User Behavior: Implications for Mobile Battery Awareness Applications. InProceedings of the ACM SIGCHI Conference on Human Factors in Computing Systems (CHI
2014). ACM, 1029–1038.
[4] Ricardo A. Baeza-Yates, Di Jiang, Fabrizio Silvestri, and Beverly Harrison. 2015. Predicting The Next App That You Are Going To Use. InProceedings of the Eighth
ACM International Conference on Web Search and Data Mining (WSDM 2015).
ACM, 285–294.
[5] Athula Balachandran, Vyas Sekar, Aditya Akella, Srinivasan Seshan, Ion Stoica, and Hui Zhang. 2013. Developing a Predictive Model of Quality of Experience for Internet Video. InProceedings of the Annual ACM International Conference of the
Special Interest Group on Data Communication (SIGCOMM 2013). ACM, 339–350.
[6] Abhijeet Banerjee, Lee Kee Chong, Sudipta Chattopadhyay, and Abhik Roychoud-hury. 2014. Detecting Energy Bugs and Hotspots in Mobile Apps. InProceedings of the 22nd ACM SIGSOFT International Symposium on Foundations of Software
Engineering (FSE 2014). ACM, 588–598.
[7] Matthias Böhmer, Brent Hecht, Johannes Schöning, Antonio Krüger, and Gernot Bauer. 2011. Falling Asleep with Angry Birds, Facebook and Kindle: A Large Scale Study on Mobile Application Usage. InProceedings of the 13th ACM International Conference on Human Computer Interaction with Mobile Devices and Services
(MobileHCI 2011). ACM, 47–56.
[8] Peter Brooks and Bjørn Hestnes. 2010. User Measures of Quality of Experience: Why Being Objective and Quantitative is Important.IEEE Network24, 2 (2010), 8–13.
[9] Maura Canavan. 2017. The 8 Mobile App Metrics That Matter [Checklist]. Re-trieved February 14, 2019 from http://info.localytics.com/blog/the-8-mobile-app-metrics-that-matter
[10] Andrew Chen. 2018. Number of Apps Available in Leading App Stores as of 3rd Quarter 2018. Retrieved February 14, 2019 from https://andrewchen.co/new-data-shows-why-losing-80-of-your-mobile-users-is-normal-and-that-the-best-apps-do-much-better/
[11] Kuan-Ta Chen, Polly Huang, and Chin-Laung Lei. 2006. How Sensitive are Online Gamers to Network Quality?Commun. ACM49, 11 (2006), 34–38.
[12] Ning Chen, Jialiu Lin, Steven CH Hoi, Xiaokui Xiao, and Boshen Zhang. 2014. AR-miner: Mining Informative Reviews for Developers from Mobile App Marketplace.
InProceedings of the 36th ACM International Conference on Software Engineering
(ICSE 2014). ACM, 767–778.
[13] Jamie Condliffe. 2018. Fitness App Data is Revealing Military Bases to Enemy Fighters. Retrieved February 14, 2019 from https://www.technologyreview.com/the-download/610086/fitness-app-data-is-revealing-military-bases-to-enemy-fighters/
[14] Mark de Reuver, Harry Bouwman, Nico Heerschap, and Hannu Verkasalo. 2012. Smartphone Measurement: Do People Use Mobile Applications as They Say They Do?. InProceedings of the 11th AIS International Conference on Mobile Business,
(ICMB 2012). AIS, 2.
[15] Prathap Dendi. 2018. App Attention Index: 80% of Users Delete Apps Due to Poor Performance. Retrieved February 14, 2019 from https://blog.appdynamics.com/ news/deletetheapp-digital-leaders-raise-consumer-expectations-new-heights/ [16] Shuo Deng, Ravi Netravali, Anirudh Sivaraman, and Hari Balakrishnan. 2014.
WiFi, LTE, or Both?: Measuring Multi-Homed Wireless Internet Performance. In
Proceedings of the 10th ACM SIGCOMM Conference on Internet Measurement (IMC
2014). ACM, 181–194.
[17] Pralhad Deshpande, Xiaoxiao Hou, and Samir R Das. 2010. Performance Compar-ison of 3G and Metro-Scale WiFi for Vehicular Network Access. InProceedings
of the 10th SIGCOMM Conference on Internet measurement (IMC 2010). ACM,
301–307.
[18] Florin Dobrian, Vyas Sekar, Asad Awan, Ion Stoica, Dilip Joseph, Aditya Ganjam, Jibin Zhan, and Hui Zhang. 2011. Understanding the Impact of Video Quality on User Engagement. InProceedings of the ACM International Conference of the
Special Interest Group on Data Communication (SIGCOMM 2011). ACM, 362–373.
[19] Denzil Ferreira, Jorge Goncalves, Vassilis Kostakos, Louise Barkhuus, and Anind K. Dey. 2014. Contextual Experience Sampling of Mobile Application Micro-Usage.
InProceedings of the 16th ACM International Conference on Human-Computer
Interaction with Mobile & Services (MobileHCI 2014). ACM, 91–100.
[20] Huber Flores, Pan Hui, Petteri Nurmi, Eemil Lagerspetz, Sasu Tarkoma, Jukka Manner, Vassilis Kostakos, Yong Li, and Xiang Su. 2018. Evidence-Aware Mobile Computational Offloading.IEEE Transactions on Mobile Computing17, 8 (2018),
1834–1850.
[21] Huber Flores, Xiang Su, Vassilis Kostakos, Jukka Riekki, Eemil Lagerspetz, Sasu Tarkoma, Pan Hui, Yong Li, and Jukka Manner. 2017. Modeling Mobile Code Acceleration in the Cloud. InProceedings of the IEEE International Conference on
Distributed Computing Systems (ICDCS 2017). IEEE, 480–491.
[22] Huber Flores, Sasu Tarkoma, Petteri Nurmi, and Pan Hui. 2018. MobileCloudSim: A Context-Aware Simulation Toolkit for Mobile Computational Offloading. In
Proceedings of the ACM International Joint Conference and 2018 International Symposium on Pervasive and Ubiquitous Computing and Wearable Computers
(UbiComp 2018). ACM, 38–41.
[23] Bin Fu, Jialiu Lin, Lei Li, Christos Faloutsos, Jason Hong, and Norman Sadeh. 2013. Why People Hate Your App: Making Sense of User Feedback in a Mobile App Store. InProceedings of the 19th ACM SIGKDD International Conference on
Knowledge Discovery and Data Mining (KDD 2013). ACM, 1276–1284.
[24] Vijay Gabale and Dilip Krishnaswamy. 2015. Mobinsight: On Improving the Performance of Mobile Apps in Cellular Networks. InProceedings of the 24th
International Conference on World Wide Web (WWW 2015). International World
Wide Web Conferences Steering Committee, 355–365.
[25] Dave Hoch. 2017. App User Retention Improves in the U.S., but Declines Interna-tionally. Retrieved February 14, 2019 from http://info.localytics.com/blog/app-user-retention-improves-in-the-us
[26] Junxian Huang, Feng Qian, Alexandre Gerber, Z. Morley Mao, Subhabrata Sen, and Oliver Spatscheck. 2012. A Close Examination of Performance and Power Characteristics of 4G LTE Networks. InProceedings of the 10th ACM International
Conference on Mobile Systems, Applications, and Services (MobiSys 2012). ACM,
225–238.
[27] Selim Ickin, Katarzyna Wac, Markus Fiedler, Lucjan Janowski, Jin-Hyuk Hong, and Anind K Dey. 2012. Factors Influencing Quality of Experience of Commonly Used Mobile applications.IEEE Communications Magazine50, 4 (2012), 48–56. [28] Hammad Khalid, Emad Shihab, Meiyappan Nagappan, and Ahmed E Hassan.
2015. What do Mobile App Users Complain About?IEEE Software32, 3 (2015), 70–77.
[29] Ricky KP Mok, Edmond WW Chan, and Rocky KC Chang. 2011. Measuring the Quality of Experience of HTTP Video Streaming. InProceedings of the IFIP/IEEE
International Symposium on Integrated Network Management (IM 2011). IEEE,
485–492.
[30] Teresa A Myers. 2011. Goodbye, Listwise Deletion: Presenting Hot Deck Imputa-tion as an Easy and Effective Tool for Handling Missing Data.Communication
Methods and Measures5, 4 (2011), 297–310.
[31] Dushyanth Narayanan, Jason Flinn, and Mahadev Satyanarayanan. 2000. Using History to Improve Mobile Application Adaptation. InProceedings of the Third
IEEE Workshop on Mobile Computing Systems and Applications (WMCSA 2000).
IEEE, 31–40.
[32] Adam J Oliner, Anand P Iyer, Ion Stoica, Eemil Lagerspetz, and Sasu Tarkoma. 2013. Carat: Collaborative Energy Diagnosis for Mobile Devices. InProceedings
of the 11th ACM Conference on Embedded Networked Sensor Systems (SenSys 2013).
ACM, 10.
[33] Antti Oulasvirta, Tye Rattenbury, Lingyi Ma, and Eeva Raita. 2012. Habits Make Smartphone Use More Pervasive.Personal and Ubiquitous Computing16, 1 (2012), 105–114.
[34] Abhinav Pathak, Y. Charlie Hu, Ming Zhang, Paramvir Bahl, and Yi-Min Wang. 2011. Fine-Grained Power Modeling for Smartphones Using System Call Tracing.
InProceedings of the Sixth ACM International Conference on Computer Systems
(EuroSys 2011). ACM, 153–168.
[35] Abhinav Pathak, Abhilash Jindal, Y. Charlie Hu, and Sam Midkiff. 2012. What is Keeping My Phone Awake? Characterizing and Detecting No-Sleep Energy Bugs in Smartphone Apps. InProceedings of the 10th International Conference on
Mobile Systems, Applications, and Services (MobiSys 2012). ACM, 267–280.
[36] Ella Peltonen, Eemil Lagerspetz, Jonatan Hamberg, Abhinav Mehrotra, Mirco Musolesi, Petteri Nurmi, and Sasu Tarkoma. 2018. The Hidden Image of Mobile Apps: Geographic, Demographic, and Cultural Factors in Mobile Usage. In Pro-ceedings of the 20th International Conference on Human-Computer Interaction with
Mobile Devices and Services (MobileHCI ’18). ACM, 10:1–10:12.
[37] Ella Peltonen, Eemil Lagerspetz, Petteri Nurmi, and Sasu Tarkoma. 2015. En-ergy Modeling of System Settings: A Crowdsourced Approach. InProceedings of the IEEE International Conference on Pervasive Computing and Communications
(PerCom 2015). IEEE, 37–45.
[38] Ella Peltonen, Eemil Lagerspetz, Petteri Nurmi, and Sasu Tarkoma. 2016. Con-stella: Crowdsourced System Setting Recommendations for Mobile Devices.
Per-vasive and Mobile Computing26 (2016), 71–90.
[39] Ahmad Rahmati, Angela Qian, and Lin Zhong. 2007. Understanding Human-battery Interaction on Mobile Phones. InProceedings of the 9th ACM International Conference on Human Computer Interaction with Mobile Devices and Services
(MobileHCI 2007). ACM, 265–272.
[40] Lenin Ravindranath, Jitendra Padhye, Sharad Agarwal, Ratul Mahajan, Ian Ober-miller, and Shahin Shayandeh. 2012. AppInsight: Mobile App Performance Moni-toring in the Wild. InProceedings of the 10th Symposium on Operating Systems
[41] Marie Reilly. 1993. Data Analysis Using Hot Deck Multiple Imputation.Journal
of the Royal Statistical Society: Series D (The Statistician)42, 3 (1993), 307–313.
[42] Yvonne Rogers, Kay Connelly, Lenore Tedesco, William Hazlewood, Andrew Kurtz, Robert E. Hall, Josh Hursey, and Tammy Toscos. 2007. Why It’s Worth the Hassle: The Value of In-Situ Studies When Designing Ubicomp. InProceedings
of the 9th International Conference on Ubiquitous Computing (UbiComp 2007).
Springer, 336–353.
[43] Tom Rolfe. 2017. Low Power Mode: Automatic Energy Saving | IOS 11 Guide. Retrieved February 14, 2019 from http://www.tapsmart.com/tips-and-tricks/ guide-understanding-low-power-mode-on-iphone-ios-10/
[44] Mohammad Salehan and Arash Negahban. 2013. Social Networking on Smart-phones: When Mobile Phones Become Addictive.Computers in Human Behavior
29, 6 (2013), 2632–2639.
[45] Mahadev Satyanarayanan and Dushyanth Narayanan. 2001. Multi-Fidelity Al-gorithms for Interactive Mobile Applications. Wireless Networks7, 6 (2001), 601–607.
[46] Stephan Sigg, Ella Peltonen, Eemil Lagerspetz, Petteri Nurmi, and Sasu Tarkoma. 2019. Exploiting Usage to Predict Instantaneous App Popularity: Trend Filters and Retention Rates.ACM Transactions on the WEB(2019). Accepted for publication. [47] Sebastian Sonntag, Jukka Manner, and Lennart Schulte. 2013. Netradar-Measuring the Wireless World. InProceedings of the 11th IEEE International Symposium on
Modeling & Optimization in Mobile, Ad Hoc & Wireless Networks (WiOpt, 2013).
IEEE, 29–34.
[48] Statista. 2018. Number of Apps Available in Leading App Stores as of 3rd Quarter 2018. Retrieved February 14, 2019 from https://www.statista.com/statistics/ 276623/number-of-apps-available-in-leading-app-stores/
[49] Po-Han Tseng, Nai-Ching Wang, Ruei-Min Lin, and Kuan-Ta Chen. 2011. On the Battle Between Lag and Online Gamers. InProceedings of the IEEE International Workshop Technical Committee on Communications Quality and Reliability (CQR
2011). IEEE, 1–6.
[50] Steven Warburton. 2009. Second Life in Higher Education: Assessing the Potential for and the Barriers to Deploying Virtual Worlds in Learning and Teaching.British