Wireless Control System for Three Phase Loads
Balancing in Distribution Networks
Abdulmuttalib T. Rashid
Electrical Engineering Dept.
University of Basrah
Basrah, Iraq
Fadhela K. Handhal
Electrical Engineering Dept.
University of Basrah
Basrah, Iraq
Osama T. Rashid
Computer Engineering Dept.
Iraq University Collage
Basrah, Iraq
ABSTRACT
The aim of this paper is to design and construction a wireless control system for three phase loads balancing in a regional transformer. This system is designed to solve the problems of the loads imbalance to avoid the losses of the electricity in the distribution networks and also to protect the elements of the network like transformers from damages. The important parts of the wireless control system are the three phase smart energy meters which equipped at each house within this system. These meters send their electrical measurement quantities wirelessly to the main control system (base station). The base station uses the received electrical measurement quantities of the smart meters to investigate the equilibrium among the three phase lines of the transformer by swapping some phases of the houses. The swap phases are chosen according to the heuristic search algorithm and the equilibrium is achieved when the maximum acceptable rate of PUI (phasing unbalance index) is 10 %. Each smart meter in each house is equipped by six contactors used for the phases swapping. The designed wireless control system is tested in several experiment results to indicate it is performance.
General Terms
Distribution network, Loads balancing system.
Keywords
Smart energy meter, wireless control system, heuristic search algorithm, contactors.
1.
INTRODUCTION
The unbalanced electric distribution network adversely affects the process of power production in terms of increasing the losses of network. As well as increases the operation and maintenance costs of network equipment like transformers, circuit breakers and others. Many ways can be used to solve the problem of unbalance, but some are expensive, such as redistribution and transfer of electrical transformers, using Scott transformer and Steinmetz, connect circuit breakers and capacitors, using static-VAR-compensators (SVC), feeder reconfiguration, and phase swapping [1].
The switching power supplies can be used as a practical method for load balancing which enable to add the active power in each phase. The current of neutral conductor in substation transformer can be reduced by this method but the cost of the used device is another problem [2]. Another method for balancing the current in the substation transformer is by always measuring the output currents and exchanging the connection of largest and smallest load phases [3]. Another research compounded this method with intelligent Neural Network [4]. In a simulation method that related to the last one, the instant current of each load was measured at the transformer via Power Line Carrier. The total balancing in this transformer was performed by applying an optimization process [5].
Two ways can be used for solving the problem of load balancing: feeder reconfiguration, and phase swapping. These ways are the processes through which the network order is changed once at the system level and once at the feeder level respectively by open/close switches [6, 7]. The feeder reconfiguration method is done by opening and closing the keys tied at the beginning and end of each feeder which is designed to balance the feeders in the electrical grid, and thus transfer several houses linked to the feeder present in each balancing process. This method is less efficient if compared to the way of phase swapping [8, 9]. In South Africa, the unbalance current in certain feeder is suppressed by changing the connection phases of some feeders manually. However, this method is time consuming and unreasonable. Furthermore, the obtained result is sometimes not precise since it depends on the load characteristics and the day time. Due to the presence of the unplanned relay elegant that is resulted from the large neutral line current, trial and error technique is utilized to insure the balance of the feeder current [10, 11]. This method is inappropriate to achieve an optimal phase distribution for balancing the load and the current of each feeder. Many researchers [12, 13] have produced acceptable results either with large execution time or with practically inapplicable structures. The feeder reconfiguration process is implemented by altering the open/closed status of switches of the distribution system. The high number of feasible states for the switching combinations makes the reconfiguration process more difficult. The artificial intelligence techniques are now usually used for the solution of feeder reconfiguration problem, such as: artificial neural networks [14], genetic algorithm [15, 16] and refined GA [17], fuzzy logic [18] and ant colony optimization (ACO) [19].
In this paper, a new method was introduced to restore balance in electric distribution network by phase swapping. This method is designed to operate within a region consisting of a re-distribution and balancing device (at the transformer) and intelligent devices (smart meters) in each house that switches between the three phases by using number of contactors. The balancing is achieved by swapping the phases on one or more specific houses according to a suitable algorithm.
2.
UNBALANCEED VOLTAGE AND
CURRENT IN DISTRIBUTION
NETWRK
[image:2.595.56.281.240.328.2]Each change occurs in the value of magnitude or phase shift in each phase for the ideal values of current or voltage (Fig 1) termed as unbalance.
Fig 1: Three Phase supply voltage (a) Balanced System,
(b) UnbalancedSystem
As the operating time of the network increases, the percentage of consumption of electricity will increase and in the same time the imbalance between the three phases will increase [2]. The tendency to increase in unbalance load is due to [1]:
Loads increase only on one of the phases.
The manual switching in the single phase houses from one phase to another.
The distribution of single phase loads is unequal among the three phase lines.
The impedances of the power transmission or distribution are unequal.
It is possible to calculate the unbalance ratio (Voltage unbalance index (VUI)) for distribution networks by calculating the ratio between the negative and the positive sequence component of the voltage in each house. This ratio can be approximated as the ratio between the maximum deviation values of one phase from the mean of the three phases using the following equation [3]:
𝑉𝑜𝑙𝑡𝑎𝑔𝑒 𝑢𝑛𝑏𝑎𝑙𝑎𝑛𝑐𝑒 𝑟𝑎𝑡𝑖𝑜 %
= 𝑀𝑎𝑥. 𝑑𝑒𝑣. 𝑓𝑟𝑜𝑚 𝑡𝑒 𝑎𝑣𝑒𝑟𝑎𝑔𝑒 𝑜𝑓 𝑡𝑒 3 𝑝. 𝑣𝑜𝑙𝑡𝑎𝑔𝑒𝑠 𝑎𝑣𝑒𝑟𝑎𝑔𝑒 𝑜𝑓 𝑡𝑒 𝑡𝑟𝑒𝑒 𝑝𝑎𝑠𝑒 𝑣𝑜𝑙𝑡𝑎𝑔𝑒𝑠 × 100%
𝑉𝑈𝐼 =
𝑀𝑎𝑥 ( 𝑉𝑅−𝑉𝑎𝑣𝑔 , 𝑉𝑆−𝑉𝑎𝑣𝑔 , 𝑉𝑇−𝑉𝑎𝑣𝑔 )𝑉𝑎𝑣𝑔
× 100%
(1)
The unbalance ratio (phasing unbalance index (PUI)) of current can be calculated in the same way as voltage unbalance ratio using the following equation [4, 5]:
𝑃𝑈𝐼 =
𝑀𝑎𝑥 ( 𝐼𝑅−𝐼𝑎𝑣𝑔 , 𝐼𝑆−𝐼𝑎𝑣𝑔 , 𝐼𝑇−𝐼𝑎𝑣𝑔 )𝐼𝑎𝑣𝑔
× 100%
(2)
Where IR, IS and IT represent the currents of the three phases
and Iavg represents the average of the three phase currents.
The maximum acceptable rate of imbalance current is 10%. The exceeding of this ratio leads to increase temperature of the transformer windings and this will affect the life span of
the transformer. Also exceeds the maximum value of PUI, leads to increase the windings losses and active power, and thus reducing the efficiency.
3.
THE HEURISTIC SEARCH
ALGORITHM
The heuristic search algorithm is a strategy that can be used to search, discover and solve the problems [5]. Also, this algorithm is used to find the best and closest solution among a number of possible solutions. Unlike many search algorithms which need a re-sorting of all the elements, thus losing the original order of the houses, which is the most important requirement of balance. The heuristic algorithm is therefore used to search for the best balance options. In this paper, the heuristic algorithm is used to search for homes that swapping from one phase to another.
4.
THE LOAD BALANCING SYSTEM
This section describes the control panel for the load balancing system and also, describes the software used for achievement this balancing. This system is provided by smart meter [25] as well as six relays and six contactors used for swapping the loads among phases in ordered to achieve the balancing.
4.1
The smart energy meter
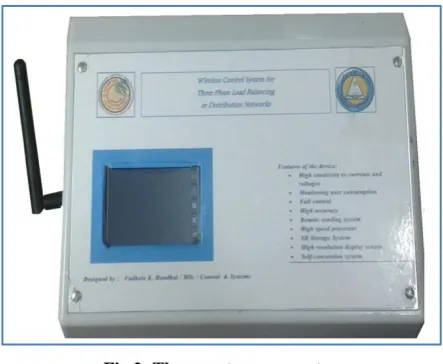
The architecture of the designed smart energy meter (Fig 2) consists of the voltage and current sensing units, automatic changeover switch, AC / DC adapter module, LCD module, transceiver module, the SD storage unit and microcontroller unit [25]. The voltage and current sensor readings are fed to the microcontrollers to compute the consumed power. The computed values are sent wirelessly, to the base station through the NRF24L01 RF Transceiver unit. Also, the computed values are displayed on a digital screen (TFT LCD). Fig 3 shows the front face of the smart energy meter.
Fig 2: The smart energy meter
4.2
Prototype Design for Three Phase loads
balancing panel
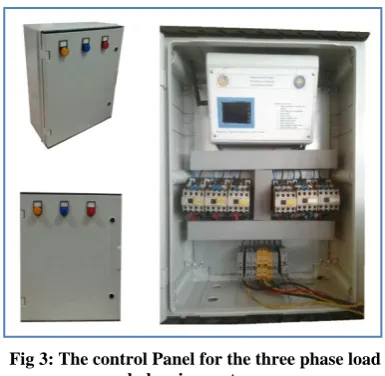
[image:2.595.318.540.439.621.2]Fig 3: The control Panel for the three phase load balancing system.
The contactors are electrical devices that used in this panel for swapping the high voltage and current loads among the three supply phases. The internal structure of the contactor is composed of three sections: the iron heart, the main contact points and the auxiliary points. The iron heart consists of two parts: a fixed part contains an electrical coil and a moving part. When the current passes through the coil, the two parts are contact together else they return to their normal place. The two sides of the coil are symbolized by: A1, A2 or A, B. The coil of a single conductor can work with a 24 or 380 volts. The main contact points are the three power supply points that the loads are connected to them so they must withstand the high load current. The main points usually consist of three points in normally open position abbreviated as (NO). (L1, L2, L3) or (R, S, T) are entered as inputs (where the inputs of the contactors are the output of the cutter), (2, 4, 6) or (T1, T2, T3) or (U, V, W). The auxiliary points are several points, some of them are opened (called normally opened (NO)), and the others are closed points (called normally close (NC)). After identifying the main points and the auxiliary points, six connectors were connected as shown in the Fig. 4. Relays were used as a driver to control the work of contractors. The previous link provides the probability of switching among the three supply phases into six possibilities. These possibilities can be classified into three groups: No changing group as shown in Fig. 5 (f) (all the phases are balanced). Two changing group as shown in Fig. 5 (a), (b) and (c) (one phase is balance and the others are exchanged). Three changing group as shown in Fig. 5 (d) and (e) (all the phases are not balanced).
The three phase control panel is found in each house and connects wirelessly to the base station to gives the orders for the three phases balancing. The principle of balancing is dependent on the load balancing algorithm [26]. According to this algorithm, the base station at first, search for the first phase balancing by swapping the first phase R with either phase S or phase T in some houses. This swapping is indicated in first column in Fig. 6 which represents by the cases in Fig. 5 (a) and (c). After that, the base station search for balancing between phases S and T in some houses. Second
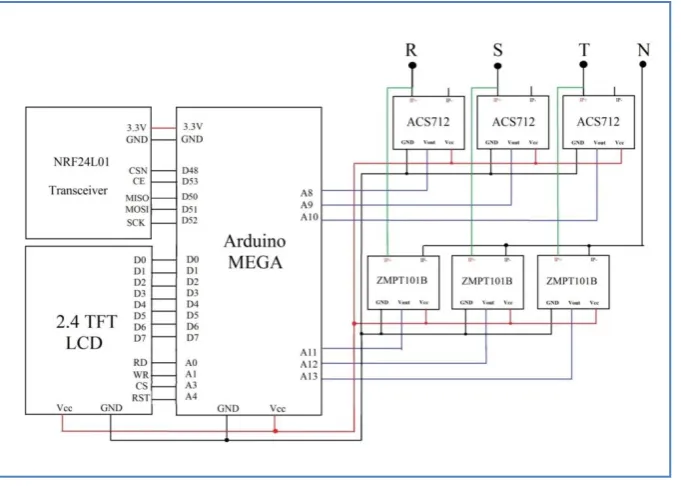
[image:3.595.321.534.126.708.2]column in Fig. 6 shows this cases which represent the case in Fig. 5 (b). Third column in Fig. 6 shows the swapping occur in some houses to achieve the balancing among the three phases. This column represents the cases in Fig. 5 (d) and (e). The schematic diagram for the 3-phase load balancing panel is shown in Fig. 7.
Fig 4: The connection of the six contactors in the control panel.
Fig 5: The possibilities of the switching among the three phases system.
[image:3.595.334.525.139.449.2]Fig 7: The schematic diagram for the 3-phase load balancing panel.
4.3
Software for The loads balancing panel
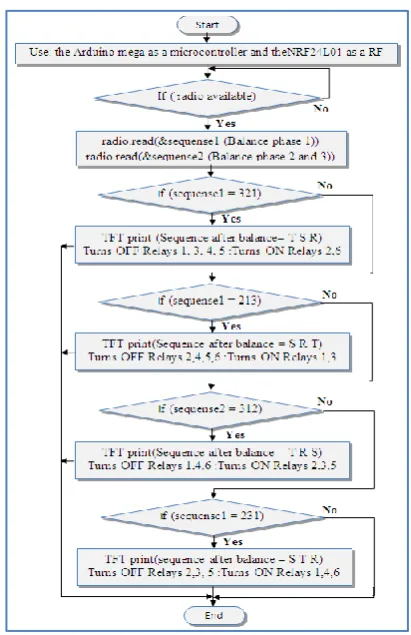
This software is used to investigate the three phase loads balancing on all the system by swapping some phases in some houses. The swapping is achievement by controlling the operation of the contactors found in the control panels. Each contactor is drive by on relay found inside the smart meter. At first, the control panel sends all the measuring parameters to the base station [25]. In this case this panel waits to receive the orders from the base station to swap the phases by controlling the operation of the contactors found inside the control panel. Fig. 8 shows the flowchart to the program that added to the smart meter program to swap the contactors.
5.
THE BASE STATION SYSTEM
This section describes the base station unit for the load balancing system and also, describes the software used for achievement this balancing. This system is provided by voltage and current sensors for measuring the three phase total currents and voltages.
5.1
Prototype design of the base station
The base station unit represents the main control unit that fixed at the main electrical transformer in the residential square. The architecture of the designed base station consists of the voltage sensing unit, the current sensing unit, TFT LCD touch screen module, the NRF24L01 RF transceiver module and microcontroller unit as shown in Fig. 9. The photos to the inner structure and front face of this station shown in Fig. 10. The sensor readings represent the main three phase supply currents that spent by all the houses that connect to the electrical transformer. The three phase currents spent by each house in the system are sent wirelessly through the NRF24L01 RF Transceiver unit at each house to the base station. The base station collects these currents with the local currents and applies the load balancing algorithm toachievement the equilibrium on the main supply currents [26]. This process is done by give orders to some houses in the system to swap some phases.
[image:4.595.325.531.409.727.2]Fig 9: The schematic diagram for the base station unit.
[image:5.595.114.526.80.512.2](a) (b)
Fig 10: The base station unit: (a) The front face (b) The inner structure.
5.2
Software for the loads balancing in the
base station
This software is used by the base station to investigate the three phase loads balancing on all the system by swapping some phases in some houses. The procedure used to investigate this process is according to the following steps: Step 1: Use the three current sensors and three voltage sensors in base station to compute the three phase total currents and voltage supplied by the base station.
Step 2: Display the three phase total currents and voltage before balancing on the local TFT touch screen module. Step 3: Use the local NRF24L01 RF Transceiver unit to receive all the three phase currents that sent by all the houses in the system.
Step 4: Use the load balancing algorithm to compute IR, IS, IT, Iavg, X, Y, Z [26].
Step 5: Compute
∆S = IR-IS (3)
∆T = IR-IT (4)
And use the Heuristic search algorithm to search for the case:
∆S + ∆T = X (5)
Which lead to satisfy the balancing of phase R. Step 6: Compute
∆ST = IS - IT (6) And use the Heuristic search algorithm to search for the case:
∆ST = Y (7) Which lead to satisfy the balancing of phase S and phase T. Step 7: Repeat the load balancing algorithm until the PUI has a value less than 10%.
Step 8: Use the local NRF24L01 RF Transceiver unit to send orders to sum houses for swapping IR with IS or IT (balance
phase R (X = 0)).
Fig 11: Flowchart for the base station program.
6.
EXPERIMENTAL RESULTS
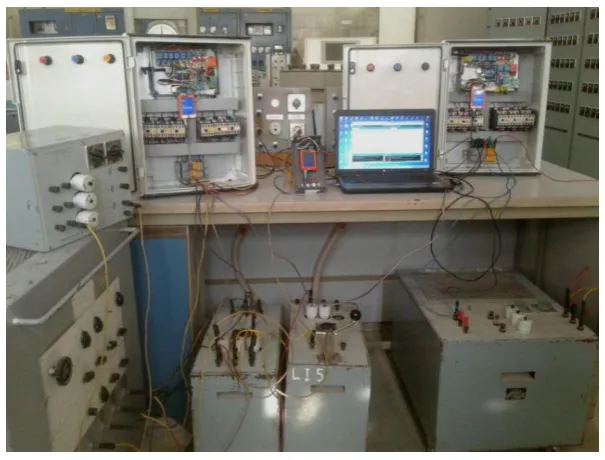
In the experimental results the environment is assumed with one electrical transformer loaded by 20 houses, a quarter of them are single phase and the others are three phases. For the case of six contactors, the currents of all phases are randomly chosen. It is very difficult to represent such system in practical because it needs to build 20 control panels with their loads. So that, in this experiment only two control panels are built each has six contactors loaded by actual loads as shown in Fig. 12 and the currents of the other houses are theoretically represented by random numbers.
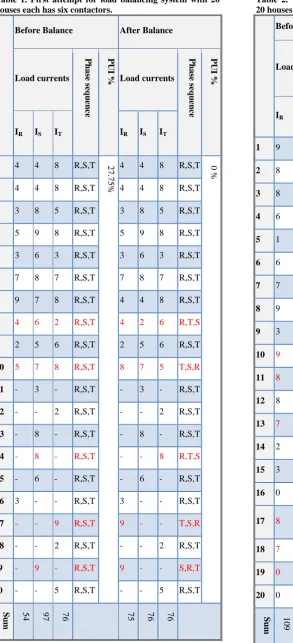
This experiment is repeated for two attempts with different values of loads and currents for all houses as shown in tables 1 and 2. Each table has two cases before and after the balancing and has different value of PUI before balancing and PUI equal to 0 % after balancing. By repeating these attempts for thirty times to achieve the balancing for different values of PUI string from 2 % to 20 % we can obtain a relationship between the percentage of PUI and the percentage of the changed houses as shown in Fig. 13.
7.
CONCLUSIONS
In this paper a new load balancing system is designed and constructed to solve the problem of imbalance by using the phases swapping process. This system has many advantages, like restoring the state of balance among bound loads, reducing the losses in the network and protects the electrical transformers from damages. The system is remodeled wirelessly through the use of modern technology and the use of smart devices to control and monitor loads.
From the experiment results, it founds that as the percentage of the PUI increases the percentage of the number of the changed houses decreases. But at the acceptable value of the PUI (10 %), the percentage of the number of the changed houses is about 23 % when the total number of houses is 20. In actual systems each electrical transformer supplies more than 20 houses and this lead to increases the loads balancing because in this case the value of the PUI is decreases.
[image:6.595.147.450.485.715.2]Table 1. First attempt for load balancing system with 20 houses each has six contactors.
Before Balance After Balance
Load currents
Phase
sequ
ence
PUI %
Load currents
Phase
sequ
ence
PUI %
IR IS IT IR IS IT
1 4 4 8 R,S,T 27.
75%
4 4 8 R,S,T 0 %
2 4 4 8 R,S,T 4 4 8 R,S,T
3 3 8 5 R,S,T 3 8 5 R,S,T
4 5 9 8 R,S,T 5 9 8 R,S,T
5 3 6 3 R,S,T 3 6 3 R,S,T
6 7 8 7 R,S,T 7 8 7 R,S,T
7 9 7 8 R,S,T 4 4 8 R,S,T
8 4 6 2 R,S,T 4 2 6 R,T,S
9 2 5 6 R,S,T 2 5 6 R,S,T
10 5 7 8 R,S,T 8 7 5 T,S,R
11 - 3 - R,S,T - 3 - R,S,T
12 - - 2 R,S,T - - 2 R,S,T
13 - 8 - R,S,T - 8 - R,S,T
14 - 8 - R,S,T - - 8 R,T,S
15 - 6 - R,S,T - 6 - R,S,T
16 3 - - R,S,T 3 - - R,S,T
17 - - 9 R,S,T 9 - - T,S,R
18 - - 2 R,S,T - - 2 R,S,T
19 - 9 - R,S,T 9 - - S,R,T
20 - - 5 R,S,T - - 5 R,S,T
Sum 54 97 76 75 76 76
Table 2. Second attempt for load balancing system with 20 houses each has six contactors.
Before Balance After Balance
Load currents
Phase
sequ
ence
PUI %
Load currents
Phase
sequ
ence
PUI %
IR IS IT IR IS IT
1 9 1 2 R,S,T 47.
3%
9 1 2 R,S,T 0 %
2 8 7 2 R,S,T 8 7 2 R,S,T
3 8 3 3 R,S,T 8 3 3 R,S,T
4 6 1 1 R,S,T 6 1 1 R,S,T
5 1 2 8 R,S,T 1 2 8 R,S,T
6 6 2 2 R,S,T 6 2 2 R,S,T
7 7 5 9 R,S,T 7 5 9 R,S,T
8 9 1 1 R,S,T 9 1 1 R,S,T
9 3 8 2 R,S,T 3 8 2 R,S,T
10 9 6 1 R,S,T 1 6 9 T,S,R
11 8 4 2 R,S,T 2 4 8 T,S,R
12 8 4 3 R,S,T 8 4 3 R,S,T
13 7 1 1 R,S,T 1 1 7 T,S,R
14 2 5 4 R,S,T 2 5 4 R,S,T
15 3 2 6 R,S,T 3 2 6 R,S,T
16 0 8 0 R,S,T 0 8 0 R,S,T
17 8 0 0 R,S,T 0 8 0 T,
R,S
18 7 0 0 R,S,T 0 0 7 T,S,R
19 0 0 2 R,S,T 0 2 0 R,T,S
20 0 4 0 R,S,T 0 4 0 R,S,T
[image:7.595.59.353.78.723.2] [image:7.595.292.540.83.735.2]Fig 13: The relationship between the percentage of PUI and the percentage of the changed houses.
8.
REFERENCES
[1] M. O. Shakeel, S. A. Jaffar, M. F. Ali,and S. S. Zaidi, “LV three phase automatic load balancing system”, 4th International Conference on Energy, Environment and Sustainable Development (EESD), 2016.
[2] M. A. Hormozi, M. B. Jahromi, and G. Nasiri, “Optimal Network Reconfiguration and Distributed Generation Placement in Distribution System Using a Hybrid Algorithm”, International Journal of Energy and Power Engineering, pp.163-170, 2016.
[3] Y. Zhen, L. Zou, J. He, Y. Su, and Z. Feng, “Fast unbalanced three-phase adjustment based on single-phase load switching”, Indonesian Journal of Electrical Engineering and Computer Science, Vol. 11, No. 8, pp. 4327-4334, 2013.
[4] A. Abdelaziz, R. A. Osama, S. M. Elkhodary, and E. F. El-Saadany," Reconfiguration of distribution systems with distributed generators using ant colony optimization and harmony search algorithms." Power and Energy Society General Meeting, IEEE, 2012
[5] A. Pasdar, and S. Mirzakuchaki. "Three phase power line balancing based on smart energy meters." EUROCON 2009, IEEE, 2009.
[6] Y. Hong and S. Ho. “Determination of network configuration considering multi objective in distribution systems using genetic algorithms”, IEEE Transactions on Power Systems, Vol. 20, No. 2, pp. 1062-1069, 2005.
[7] B. Enacheanu, B. Raison,R. Caire, O. Devaux, W. Bienia, and N. HadjSaid, “Radial network reconfiguration using genetic algorithm based on the Metroid theory”, IEEE Transactions on Power Systems, Vol. 23, No. 1, pp. 186-195, 2008.
[8] A. M. Saffar, R. Hooshmand, and A. Khodabakhshian, “A new fuzzy optimal reconfiguration of distribution systems for loss reduction and load balancing using ant colony search-based algorithm”, Elsevier, Applied Soft Computing, pp. 4021- 4028, 2011.
[9] S. Ghasemi, and J. Moshtagh. “A novel codification and modified heuristic approaches for optimal reconfiguration of distribution networks considering
losses cost and cost benefit from voltage profile improvement”, Elsevier, Applied Soft Computing, Vol. 25, pp. 360-368, 2014.
[10] A. Hasanzadeh, M. Parniani, and S.M.R. Sadriyeh, “A comparative study on current control methods for load balancing and power factor correction using STATCOM", IEEE Power Tech. conf., Russia, pp. 1-7, 2005.
[11] S. Civanlar, J. J. Grainger, H. Yin , and S. S. H. Lee, “Distribution feeder reconfiguration for loss reduction”, IEEE Transactions on Power Delivery, Vol. 3, No. 3, pp. 1217-1223, 1988.
[12] A. B. Knolseisen, J. Coelho, S. F. Mayerle, F. J. S. Pimentel and R. H. Guembarovski, “A Model for the Improvement of Load Balancing in Secondary Networks", IEEE Bologna Power Tech conference, Bologna, Italy, 2003.
[13] S. Patel, “Power Load Balancing Using Fuzzy Logic”, MSC thesis, California State University, Sacramento, 2010.
[14] J. B. Hoover, “The Changing World of Power Monitoring”, Twenty-Second International Telecommunications Energy Conference (INTELEC), pp. 103–108, 2000.
[15] Govinda, K. "Design of Smart Meter Using Atmel 89S52 Microcontroller." Elsevier, Procardia Technology, pp. 376-380, 2015.
[16] M. T. Rashid, “Design and Implementation of Smart Electrical Power Meter System”, Iraqi Journal for Electrical & Electronic Engineering, Vol. 10 No. 1, pp. 1-14, 2014.
[17] A. Ellerbrock, A. Abdel-Majeed, and S. Tenbohlen, “Design and building of a cheap smart meter”, Institute of Power Transmission and High Voltage Technology, University of Stuttgart, Tech. Rep. 2012.
[18]L. Huang, H. Chang, C. Chen,and C. Kuo, "A ZigBee-based monitoring and protection system for building electrical safety”, Elsevier, Energy and Buildings, Vol. 43 No. 6 ,pp. 1418-1426, 2011.
[19] D. R. Muñoz, D. Pérez, J. S. Moreno, S. C. Berga, and E. C. Montero, “Design and experimental verification of a smart sensor to measure the energy and power consumption in a one-phase AC line”, Elsevier, Measurement ,Vol 42 pp. 412-419, 2009.
[20] K. A. Bakshi , A. V. Bakshi and U. A. Bakshi, “Electrical Measurements”, Technical Publications Pune, 2009.
[21] R. S. TURGEL, “Digital Wattmeter Using a Sampling Method”, IEEE Transaction on Instrumentation and Measurement, Vol. 23, No. 4, 1974
[22] G. n. Stenbakken, “A Wideband Sampling Wattmeter”, IEEE Trans. on Instrumentation and Measurement, Vol. PAS-103, No. 10, 1984.
[23] G. n. Stenbakken, “High-Accuracy Sampling Wattmeter”, IEEE Transaction on Instrumentation and Measurement, Vol. 41 No. 6 , 1992.
IEEE, Instrumentation and Measurement Technology Conference (IMTC-91), Atlanta, GA, USA, 1991. [25] F. K. Handhal, A. T. Rashid, “A prototype Design for
Three Phase Smart Energy Meter”, Second Al-Sadiq International Conference on Multidisciplinary in IT and Communication Science and Applications (2nd-AIC-MITC’17), Iraq, 2017.