Effect of Injection Moulding Process Parameter on Warpage of using
Taguchi Method
Gurjeet Singh
1, Mahazbeen Sayad
21
Assistant Professor, Department of Mechanical Engineering, IES University, BHOPAL-India
2,Assistant Professor, Department of Physics, IES University, Bhopal-India
---***---
Abstract: The growth of plastic industry is increasing very rapidly in the world. Plastic industry plays important role in the development of economy of any country progress. The plastic products are light in weight in comparison to metals and nonmetals products. Metal and non-metals are rarely available on the earth. So to manufacture plastic products is beneficial for us. Generally plastic products are manufactured by injection moulding process. The process parameters which affect the product quality are necessary to control. The aim of this paper is to minimize the surface defect warpage which occur in plastic products. By controlling the process parameter we can control warpagedefect. Since handling the different process parameter is mammoth task that costs time, effort and money. The process parameter melt temperature, mould temperature, packing pressure, packing time and cooling time are studied. The Taguchi method is used by exploiting mold analyses based on two levels. Orthogonal arrays of Taguchi, Signal-to- noise ratio, the analysis of variance are utilized to find optimal the optimal levels and effect of process parameters on sink marks defect.
Keywords: Injection moulding, Taguchi method, Warpage, Polypropylene polymer
1. Introduction:
Injection molding is one of the major net shape forming processes for thermoplastic polymers. Over 30% of all the plastic parts manufactured are by injection molding. Injection molding is ideally suited for manufacturing large quantities of mass produced plastic parts of complex shapes and sizes. In the injection molding process, hot melt of plastic is forced into a cold empty cavity of desired shape called mold. Then, the hot melt is allowed to solidify. Solidified net shape product is ejected out of the mold upon opening. Although the process is simple, prediction of final part quality is a complex phenomenon due to the numerous processing variables. We can study defects on the basis of two categories in the injection moulding. One is dimensional defect and other is attributed defect.
Dimensional related defects can be controlled by correcting the mold dimensions. But, attribute related defects are generally dependent on the processing parameters. Some of the common attribute related defects are warpage, splay marks, sink marks, voids, weld/meld lines, poor surface finish, air traps, burn marks etc. Of all attribute defects, warpage marks are considered to be perennial. The warpage can be defined as the difference between the geometry of the CAD model created for manufacture of the mold and the dimensions of the molded part and the warpage are effects of variations in shrinkage. The shrinkage can be characterized by two broad classifications: volumetric and linearized. The volumetric shrinkage is the result of thermal contraction, which occurs in all polymers, and of crystallization which occurs in semi-crystalline polymers.
uniform product weight that any traditional methods after study the filling condition in the mold. Rezavand, S. A. M et.al. (2007) presented a simplified wax model of gas turbine blade. Their study on the mold filling condition in the investment casting process, they explain that major steps in investment casting processes are injection molding of Wax pattern, ceramic coating, removing wax, drying and material casing. In the mold manufacturing they consider injection temperature and holding time as processing variables. They found that holding time to be more dominant than that of injection temperature.
Sahputra, I. H.et.al. (2007, December).study on the mold flow condition of injection moulding process with the help of SIMPOL and MPI software. They compare the software result. They find MPI software generated simulation analysis report gave good results in comparison to SIMPOL software.
2. Methodology:
A. Taguchi method:
Taguchi method was developed by Dr. Genichi Taguchi of Japan. The objective of the method is to produce high quality product at low cost and time to the manufacturer. The experimental design proposed by Taguchi involves using orthogonal arrays to organize the parameters that affect process and the levels. Orthogonal Arrays (often referred to Taguchi Methods) are often employed in industrial experiments to study the effect of several control factors.
B. Signal-to-Noise Ratio (S/N Ratio): The S/N ratio is the ratio of mean (signal) to standard deviation (Noise), which indicates scattering around a target value. This ratio helps to identify the optimum level of process parameters. The combination of process parameters with the highest S/N ratio will be the optimum setting of process parameters. A high S/N ratio is desirable as the signal level is much higher than the random noise level that leads to best performance. The calculation of S/N ratio depends on the quality characteristics of the product or process to be optimized.Generally, there are three categories of quality characteristic in the analysis of the S/N ratio, i.e. smaller-is-better, larger-is-better, and nominal-is-better. In the present experimental design, the smaller-is-better type quality characteristics is used which is expressed as:
S/N=-10 log10(MSD) ---(1)
For smaller is better
∑
Where MSD = Mean Square Deviation
y = Observations n= No. of tests in a trial.
3. Experimental plan:
A. Selection of Process Parameters and their Levels:For the present experimental work the four process parameters each at three levels have been decided. Experiment has been planned according to existing data. It is desirable to have three minimum levels of process parameters to reflect the true behavior of output parameters of study. The process parameters are renamed as factors and they are given in the adjacent column. The levels of the individual process parameters/factors are given in Table.1:
Table.1
Process parameter and their levels:
Melt temperature(MT) 230 235 240
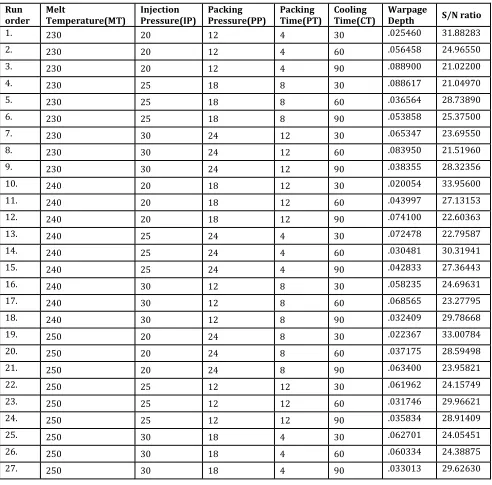
Table 2: Warpage height for various Experiments numbers
Run
order Melt Temperature(MT) Injection Pressure(IP) Packing Pressure(PP) Packing Time(PT) Cooling Time(CT) Warpage Depth S/N ratio
1. 230 20 12 4 30 .025460 31.88283
2. 230 20 12 4 60 .056458 24.96550
3. 230 20 12 4 90 .088900 21.02200
4. 230 25 18 8 30 .088617 21.04970
5. 230 25 18 8 60 .036564 28.73890
6. 230 25 18 8 90 .053858 25.37500
7. 230 30 24 12 30 .065347 23.69550
8. 230 30 24 12 60 .083950 21.51960
9. 230 30 24 12 90 .038355 28.32356
10. 240 20 18 12 30 .020054 33.95600
11. 240 20 18 12 60 .043997 27.13153
12. 240 20 18 12 90 .074100 22.60363
13. 240 25 24 4 30 .072478 22.79587
14. 240 25 24 4 60 .030481 30.31941
15. 240 25 24 4 90 .042833 27.36443
16. 240 30 12 8 30 .058235 24.69631
17. 240 30 12 8 60 .068565 23.27795
18. 240 30 12 8 90 .032409 29.78668
19. 250 20 24 8 30 .022367 33.00784
20. 250 20 24 8 60 .037175 28.59498
21. 250 20 24 8 90 .063400 23.95821
22. 250 25 12 12 30 .061962 24.15749
23. 250 25 12 12 60 .031746 29.96621
24. 250 25 12 12 90 .035834 28.91409
25. 250 30 18 4 30 .062701 24.05451
26. 250 30 18 4 60 .060334 24.38875
27. 250 30 18 4 90 .033013 29.62630
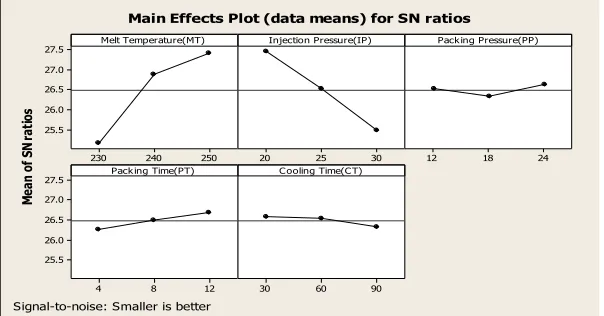
4. Response effect for signal to noise ratio (S/N) of Warpage:
Table 3: Response Table for Signal to Noise Ratios Smaller is better
Level Melt
temperature(MT) Injection Pressure(IP) Packing Pressure(PP) Packing Time(PT) Cooling Time(CT)
1 25.17 27.46 26.59 26.27 26.59
2 26.88 26.52 26.54 26.50 26.54
3 27.41 25.49 26.33 26.70 26.33
Delta 2.23 1.97 0.30 0.43 .26
Rank 1 2 4 3 5
[image:4.612.156.458.250.408.2]From the table 3 the overall mean for the S/N ratio of the Warpage height is found to be .53576 mm.The analysis was made using popular software specially used for design of experiment applications known as MINITAB 16
Fig: 1 Effect of control factors on Warpage Depth
5. Confirmation Test:
Once the optimal level of the cutting parameters is recognized, acquired from the analysis, it is customary to verify.
Table 4: Optimal setting for Warpage depth
Melt
Temperature(MT) Injection Pressure(IP) Packing Pressure(PP) Packing Time(PT) Cooling Time(CT)
230 30 18 4 90
The confirmation experiments are performed to facilitate the verification of the injection moulding process at the obtained feasible optimal input parametric setting.
6. Conclusion:
Plastic injection moulding is quite important field in manufacturing process. There are many plastic products that produced by injection moulding. So manipulation of numerous processing variables of the injection moulding process to control defects is mammoth task that costs time, effort and money. This paper describes a simple and efficient approach to study the influence of injection molding variables on warpage using Taguchi method. Application of Taguchi approach also helps to find out optimal parameter setting. The result shows the ability of this approach to predict Sink depth for various combination of
M ea n of S N ra tio s 250 240 230 27.5 27.0 26.5 26.0 25.5 30 25
20 12 18 24
12 8 4 27.5 27.0 26.5 26.0 25.5 90 60 30
Melt Temperature(MT) Injection Pressure(IP) Pack ing Pressure(PP)
Pack ing Time(PT) C ooling Time(C T)
Main Effects Plot (data means) for SN ratios
Ackowledgement:
This work has been done with the help of CIPET Jaipur. In this project Mr. Vanmali, Mr. Mahesh, Mr. Chandrma Yadav, Mr. Prabhat all supporting staff Production department of CIPET help a lot for experiment work and give their valuable suggestion during experiments.
7. References:
1. Erzurumlu, T., &Ozcelik, B. (2006). Minimization of warpage and sink index in injection-molded thermoplastic parts using Taguchi optimization method.Materials& design, 27(10), 853-861.
2. Ozcelik, B., Ozbay, A., &Demirbas, E. (2010). Influence of injection parameters and mold materials on mechanical properties of ABS in plastic injection molding. International Communications in Heat and Mass Transfer,37(9), 1359-1365.
3. Longzhi, Z., Binghui, C., Jianyun, L., &Shangbing, Z. (2010, June). Optimization of plastics injection molding processing parameters based on the minimization of sink marks. In Mechanic Automation and Control Engineering (MACE), 2010 International Conference on (pp. 593-595). IEEE.
4. Stanek, M., Manas, D., Manas, M., &Javorik, J. (2011, May). Simulation of injection molding process. In Proc. 13th WSEAS International Conference on Automatic Control, Modelling& Simulation (pp. 231-234).
5.Huang, M. S. (2007). Cavity pressure based grey prediction of the filling-to-packing switchover point for injection molding. Journal of materials processing technology, 183(2), 419-424.
6. Rezavand, S. A. M., &Behravesh, A. H. (2007). An experimental investigation on dimensional stability of injected wax patterns of gas turbine blades. Journal of materials processing technology, 182(1), 580-587.