© 2019, IRJET | Impact Factor value: 7.34 | ISO 9001:2008 Certified Journal
| Page 2848
FORCED DAMPED VIBRATION ANALYSIS OF OPTIMIZED CANTILEVER
BEAM USING DIFFERENT METHODS
Mohaniraj Gopale
1, Prof. Dr. Santosh Shelke
21
M.E(Design) Student, Sir Visvesvaraya Institute of Technology, Nashik, Maharashtra, India
2
Prof, Dept of Mechanical Engineering, Sir Visvesvaraya Institute of Technology, Nashik, Maharashtra, India
---***---Abstract -The Paper focuses on the study of the vibration analysis of different materials that can be used for manufacturing of the engine casing i.e. structural steels (namely Mild Steel and Stainless Steel) and aluminum or its alloys. The objective of the paper is to identify a suitable material for the manufacturing of Engine casing considering the parameters such as Material of the beam to be used, weight of the beam, Damping Co-efficient, Spring stiffness and the natural frequency of the material using the Taguchi Method (Regression Analysis) the effect of several variables which are involved in the experimental setup of Forced damped vibrations such as Material of the beam to be used, weight of the beam, Damping Co-efficient, Spring stiffness and the natural frequency of the material etc. The natural frequency of the optimized material is then evaluated and verified using theoretical, experimental methods (FFT) and software (Ansys).
Key Words: Cantilever Beam, Forced Vibration, Regression
Analysis, FFT.
1. INTRODUCTION
Horizontal cantilever beam is a beam, which carries transverse load at its end point. Due to exciting load the vibration occurs in the beam. We know that, when the shaft or disc moves approximately perpendicular to the axis of shaft, then the vibrations are called transverse vibrations. If the body vibrates under influence of external force, then the body is under forced vibration. In case of forced vibrations, an external periodic disturbing force keeps the system vibrating. The vibrations of air compressors, internal combustion engines, machine tools and various other machinery are all examples of forced vibrations.
In some cases, the excitation is non deterministic or random. This will mean that the excitation magnitude at any instance is unknown. In such situations, sufficient data is required statistically determine the excitation characteristics. Some of the examples of random vibration are the excitations produced by winds, seismic activities and road surfaces.
If the value or magnitude of the excitation is known at any given time, the excitation is called deterministic and resulting vibration is called as deterministic vibration. When the external force is SHM, the corresponding vibrations are said to be with harmonic excitation. Many mechanical systems are subjected to forced vibrations. Such systems normally do have some form of damping in the system.
Forced vibration can be explained as when an alternating force or motion is applied to a mechanical system. Examples of this type of vibration include a washing machine imbalance, vibration during transportation (by engine, springs, road, etc), or the vibration of a building during an earthquake. In case of forced vibration the vibrating frequency is the frequency of the force applied, with its magnitude dependent on the actual mechanical system. The Engine casing particularly is subjected to forced damped vibration and becomes essential to study the effect of damped vibrations using different types of material with different densities, springs having different spring stiffness and oils with different damping co-efficient.
1.1 Problem Statement
For many years Cast Iron has been used for the manufacturing of engine casing, it is due to its low cost and it is due to its strength and low cost and its wear resistance. But as the engine become more complicated engineers found new materials to reduce its weight as well as to increase strength and wear resistance such as structural steel & aluminum alloy.
For Engine application engine is to be operated at high speed with min amplitude of vibration. Hence it becomes very essential that the proper material is selected for Engine application and its behavior is studied under forced damped vibration (which is the typical working conditions of the engine).
1.2 Methodology
1. Beam Material Selection
2. Taguchi Method of Orthogonal Arrays using Minitab Software
3. Analytical Method 4. Experimental Analysis 5. Analysis using FFT Analyzer 6. Analysis using Ansys Software
1.3 Objective
1. To do the regression analysis considering three different density beam material, three oils with different damping coefficient and three spring stiffness.
2. Selection of the optimum parameters such as material, damping coefficient, and spring stiffness.
3. Development of the experimental setup for forced damped vibration of Cantilever beam.
4. Vibration analysis of the beam considering optimum material, damping coefficient and spring stiffness.
5. Obtaining results by theoretical and numerical method with the help of FFT Analyzer Forced vibration of cantilever beam.
6. To obtain frequency response of the cantilever beam under the excitation force and damped conditions.
7. To validate the results using theoretical method, FFT Analyzer and Ansys.
2. TAGUCHI METHOD OF ORTHOGONAL ARRAYS
The goal of experimental work is to find out the best material from Mild Steel, Stainless Steel (SS306) and Aluminum alloy (3003) in manufacturing of and engine casing which usually faces forced damped vibrations. This is done by analyzing the parameters that have direct effect such as Damping Co-efficient of the Oil used for damping, Spring Stiffness and the natural frequency of the material used which influencing optimum selection of the material.
Parameters
[image:2.595.307.545.192.637.2]1. Mass of the beam- e.g. m1, m2, m3 2. Damping Co-efficient - e.g.C1, C2, C3 3. Spring Stiffness – K1, K2, K3
Table -1: Process Parameters with their values at corresponding levels
Process Parameters Level 1 Level 2 Level 3 Mass of the beam(m)
in Kg 2.07 2.11 0.71
Damping Co-efficient
(C) in N/mm 0.69 0.78 0.86
Spring Stiffness (K) in
N/m 146 102 X
147.15X
102 148 X 102
2.1 Taguchi orthogonal array design by MINITAB software:
L9(3^3)
Factors: 3
Runs: 9
Columns of L9(3^4) Array
1 2 3
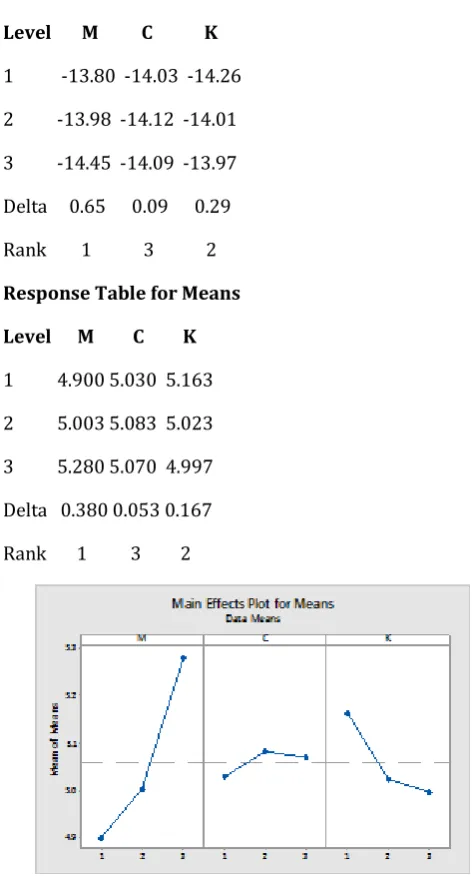
Response Table for Signal to Noise Ratios
Smaller is better
Level M C K
1 -13.80 -14.03 -14.26
2 -13.98 -14.12 -14.01
3 -14.45 -14.09 -13.97
Delta 0.65 0.09 0.29
Rank 1 3 2
Response Table for Means
Level M C K
1 4.900 5.030 5.163
2 5.003 5.083 5.023
3 5.280 5.070 4.997
Delta 0.380 0.053 0.167
Rank 1 3 2
© 2019, IRJET | Impact Factor value: 7.34 | ISO 9001:2008 Certified Journal
| Page 2850
Chart.2 Main Effect Plot for SN ratios
Regression Equation
Wn = 4.808 + 0.1900 M + 0.0200 C - 0.0833 K
From signal to noise ratio (which is minimum) it’s cleared that M3 material means Aluminum and C2 and K1 are the optimum parameter to be used in application.
3. ANALYTICAL METHOD:
3.1 Mathematical Model of Forced Damped Vibrating System
The System comprises of the following elements,
a.Mass (M)
b.Spring of Stiffness (K)
c.Damper having damping coefficient (C)
d.An external periodic vibrating force having magnitude Foand frequency ω
Fig .1 Mathematical model of Spring-Mass-Damper [7]
The free body diagram of the mass is shown in the Fig 1. The equation of motion can be worked out using the FBD method.
From Newton’s Law of Motion,
mẍ + Cẋ + Kx = Fosin ωt (1)
Inertia Force + Damping Force + Stiffness Force = External Force
This is linear, non-homogenous, second order differential equation. The solution of this equation consists of complementary function and particular integral.
X = Xc + Xp (2)
Complimentary Solution,
Xc = Me-ωnξt sin (ωd t + ɸ)
Where, damped frequency
ωd = ωn√1 – ξ2
Particular Solution, Xp = X Sin (ωt - ɸ) (3)
3.2 Analytical Analysis:
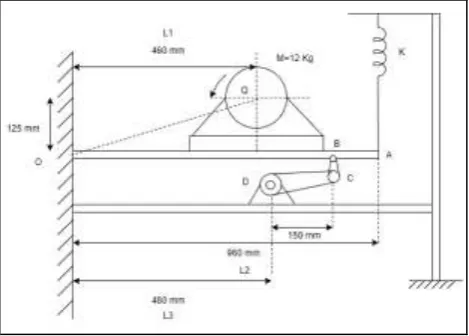
[image:3.595.317.552.403.571.2]Below diagram shows Mathematical model of Cantilever beam with spring-mass-damper
Fig .2 Model for Cantilever beam with spring-mass-damper
IA = +
I=2.74 Kg m2
K = 147.15 x 10² N/m
ξ = 0.5
l(OQ) =
= 476.68 mm
Consider the angular deflection of Stand and the damper as shown in the Fig .3. For Analysis, it is assumed that the angular defections are small.
Fig . 3 Force analysis of cantilever beam
If the end of A deflects by A’ by a distance x,
x = 0.96 ɸ
Or ɸ = 1.04 x
ɸ’= 1.04 x’
ɸ” = 1.04 x” (4)
For this deflection, the points B and C move by a distance y to B’ and C’ respectively. The angular deflection θ of the damper will be the same as that of the link CD.
Also, y = 0.5 x = 0.15 θ θ = 3.33 x
θ’ = 3.33 x’ (5)
The damping torque in the rotational damper about the damper axis would be CT θ’. This torque can be expressed in the form of force F as:
Force x Distance = Torque
F x 0.15 = CT θ’= 3.33 CTx’
F =22.2 CT x’ (6)
[image:4.595.64.260.137.265.2]This force acts at point Consider the Freebody diagram of the arrangement as shown in the fig 4
Fig.4. Free Body Diagram
From Newton’s Law of Motion,
Iɸ’ + F x 0.48 + K X x0.96= mT0
5.98 x’’+ 10.65CTx’ + 309.13 x 10²x= me ω2 sin ωt (7)
Hence,
M1= 5.98
C1= 10.65 CT
K1= 309.13 x 10³
The natural frequency will be,
= 33.71rad/sec (8)
= 5.36 Hz
4. EXPERIMENTAL METHOD:
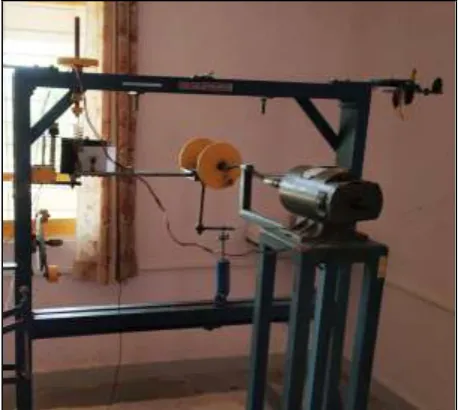
[image:4.595.319.549.432.637.2]Below picture shows experimental setup of Cantilever beam with spring-mass-damper.
Fig.5 Experimental Setup of Cantilever beam with spring-mass-damper
© 2019, IRJET | Impact Factor value: 7.34 | ISO 9001:2008 Certified Journal
| Page 2852
added masses placed on the platform attached. Two out of disks on the output shaft of the belt -driven unit provide the exciting force. The exciting frequency can be adjusted by the means of the speed control unit.
The Chart recorder fits to the left-hand vertical member of the frame and provides the means of obtaining a trace for the vibration. The recorder unit consists of slowly rotating drum driven by synchronous motor, operated from auxiliary supply on the speed control unit. A role of the recorder paper is next to the drum and is wound round the drum so that the paper is driven at constant speed. A felt -tilted pen fits to the free end of the beam; so that the pen just traces graph on the paper. By switching the motor on, we can obtain a trace to show the oscillatory motion of beam. Damping can be introduced with the help of dashpot assembly near the pivoted end of the beam.
.
Chart.2 Time Graph, f1 = 5.35 Hz
Chart.3 Time Graph, f2= 20 Hz
Chart.4Time Graph, f3= 30 Hz
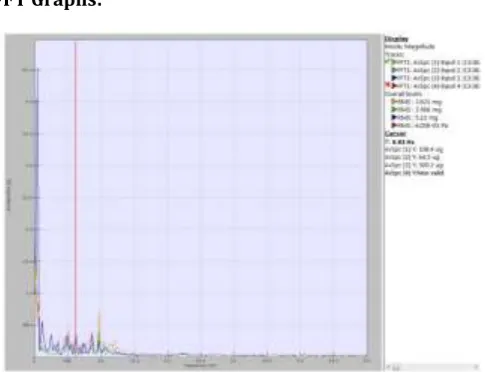
5. Analysis using FFT Analyzer
Frequency analysis based on the Fast-Former Transform (FFT) Algorithm is the tool of choice for measurement and diagnostic of vibration. The FFT Analyzer is recently developed pc based virtual instrument. It uses impulse execution and either frequency domain analysis or time – domain Analysis to entrant the model parameter from the response measurement in real time. Following impulse are execution of the specimen, the measured analog response signal may be digitalized and analyzed using the domain techniques or transformed for analysis in the frequency domain using FFT Analyzer. The peaks in the frequency response spectrum are the location of natural frequency.
FFT Graphs:
Chart.5 FFT reading observed for 30 rpm at frequency 5.83 Hz
Chart.6 FFT reading observed for 40 rpm at frequency 26.89 Hz
Chart.6 FFT reading observed for 60 rpm at frequency 33.2 Hz
6. Analysis using Ansys Software (FEA):
[image:6.595.40.283.100.286.2]The problem involves a structure or structural component subjected to certain loads. The conversion of the physical problem to a mathematical model requires certain assumptions that collectively lead to differential Eq.s governing the mathematical model. Since the finite element solution technique is a numerical procedure, it is required to access the solution correctness. If the accuracy criteria are not met, the numerical solution must be repeated with revised solution parameters until a sufficient precision is reached. Division of whole into parts, which allows illustration of geometrically complex domains as collection of simple domains that, enables a systematic derivation of the approximation functions. Derivation of approximation functions over each element the approximation functions are algebraic polynomials that are resultant of interpolation theory. Group of elements, which are based on continuity of the solution and equilibrium of internal fluxes.
Table -2: Experimental Parameters for Al Beam
Parameters Symbol Value
Material AL -
Total Effective
Length L 0.96 m
Width B 0.023 m
Thickness T 0.015 m
Moment of
Inertia I 2.74 Kg m2
Young’s Modulus E 0.69 x10¹¹ N/m2
Mass Density ρ 2700 kg/m3
A. Boundary conditions
Fig.7– Beam Element (Plane 82)
[image:6.595.311.559.344.480.2]© 2019, IRJET | Impact Factor value: 7.34 | ISO 9001:2008 Certified Journal
| Page 2854
Table 3 Natural frequencies at different mode
Mode Numerical Frequency in Hz (for Al Beam)
1 5.10
2 25.54
3 31.95
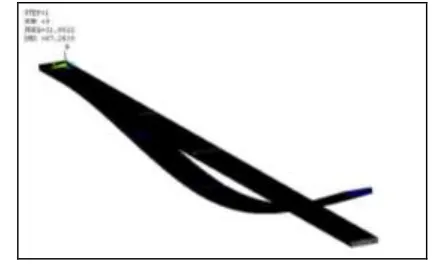
B. Vibration Analysis of Beam
The first step in the vibration analysis of the beam is to find its natural frequencies. In ANSYS, Eigen natural frequencies are found by modal analysis. A minimum of first three mode shapes and natural frequencies are obtained. The mode shape and obtained lowest frequency for the beam are shown in in Fig.8
Fig . 8(a)Mode Shape1 with first node observed at frequency 5.10 Hz
Fig . 8(b)Mode shape Mode Shape2 with first node observed at frequency 25.54 Hz
Fig . 8(c) Mode Shape3 with first node observed at frequency 31.95Hz
8. RESULT AND DISCUSSION
[image:7.595.60.263.289.414.2]Comparison table of the frequencies obtained by Analytical, Experimental, by FFT Analyzer and by Ansys have been tabulated in the below table,
Table -4: Result Comparison
Sr
No Speed (n) Fn(Hz) Ana Fn(Hz) Exp Fn(Hz) FFT Fn (Hz) Ansys
Max Deviation (%) 1 30
5.36 5.35 5.83 5.1 8%
2 40 20 26.89 25.54 26%
3 60 30 33.2 31.95 10%
Following observations can be made:
1.8% is the Maximum deviation occurs between analytical and other methods at 30 RPM
2.26% is the Maximum deviation occurs between analytical and other methods at 40 RPM
3.26% is the Maximum deviation occurs between analytical and other methods at 60 RPM
9. CONCLUSIONS
1.From the present study it is revealed that Aluminum alloy material is optimum using regression analysis.
2.This material is further chosen for manufacturing of cantilever beam and its vibration analysis is carried for the case of forced damped condition.
3.From the analytical vibration analysis, frequency response curve shows that as the frequency ration increases then the amplitude decreases with increase in damping ratio. 4.Similarly, from the experimental Time Graph it can be
observed that the as the damping increased the amplitude decreases.
Vibration analysis of beam is studied under forced damped vibration is studied by analytical, experimental, using FFT Analyzer and Ansys.
It is observed that at different values of damping factor under damped case with increase in the damping ratio amplitude of the vibration goes on decreasing with increase in the frequency ratio for Aluminum Alloy which is the most suitable material for the engine casing because in practical application engine is to be operated at high speed with minimum amplitude of vibration and low natural frequency.
REFERENCES
[image:7.595.59.266.459.582.2] [image:7.595.50.269.625.762.2][2]TarsicioBeleândez, Cristianneipp and Augusto beleândez, “Numerical and Experimental Analysis of a Cantilever Beam: A Laboratory Project to Introduce Geometric Nonlinearity in Mechanics of Materials”, International journal of Engineering, Vol. 19, No. 6, pp. 885- 892, 2003.
[3] H HYoo and S H Shin, “Vibration Analysis of Rotating Cantilever Beams", Journal of Sound and Vibration, Pages 807-828, 12 Dec.1997.
[4] Chih Ling Huang, Wen Yi Lin, Luo Mo Hsio, "Free Vibration Analysis of Rotating Euler Beams and High Angular Velocity", Dept. of Mechanical Engineering; National Chiao Tung University, HsinchuTiawan 14 Nov. 2005.
[5] H. Ding, G.C. Zhang, LQ Chen, "Supercritical Vibration of Non-linear Coupled Moving Beams based on Discrete Fourier Transform", International Journal of Nonlinear Mechanics, 2011.
[6] Nguyen, Van Khang ,“ a procedure for optimal design of a dynamic vibration absorber installed in the damped primary system based on taguchi’s method”, Vietnam Journal of Science and Technology , 10.15625/2525-2518/56/5/11175 2018/10/10
[7] G.C.Mekalke, R.R.Kolhapure," Analytical and Parametric Optimization of Force Transmissibility by Taguchi Method for Double Stage Engine Mountings”, International Journal of Computer Engineering In Research Trends, Volume 3, Issue 9, September-2016, pp. 461-471
[8] D.P. Kamble1, Chandan Kumar2, Shivprasad R. Sontakke3, Ratnadip T. Gaikwad4 “Analytical and Experimental Analysis of Cantilever Beam under forced Vibration “ International Journal of Engineering Science and Computing “ IJESC ISSN -2321 3361 Volume 6 Issue 3.
[9] Pooja Deepak Mane1, Aditya Arvind Yadav2, AnamikaMahadev Pol3, Venkatesh Appasaheb Kumbhar4, | Feb-2018 “Comparative analysis of natural frequency for cantilever beam through analytical and software approach” International Research Journal of Engineering and Technology (IRJET) Volume: 05 Issue: 02 e-ISSN: 2395 -0056, p-ISSN: 2395-0072
[10] Ravindra R. Navthar et al. “Forced damped vibrations : Frequency response curve for Steel and Aluminium bars / International Journal of Engineering Science and Technology (IJEST) , Oct 2011 , ISSN : 0975-5462 , Vol. 3 No. 10 October 2011.
[11]Gargi Majumder1, Kaushik Kumar2 ,” Deflection and Stress Analysis of a Simply Supported Beam and its Validation Using ANSYS, International Journal of Mechanical Engineering and Computer Applications, Vol 1, Issue 5,Special Issue, October 2013, ISSN 2320-6349