ISSN Print: 2327-5219
DOI: 10.4236/jcc.2018.67002 Jul. 25, 2018 14 Journal of Computer and Communications
Visualized Analysis Model for Hadoop
Business Data
Zhongxi Wang
Major of Measurement and Control Technology and Instrument, Northeastern University, Qinhuangdao, China
Abstract
With the social development, we are stepping into an information technology world. In such a world, our life is getting more and more diversified and rich because of e-business. E-business not only provides us convenience but also large amounts of business data. However, how shall we better store, manage and use these business data has become a major field being studied by e-business. With the rapid growth of data volume, the relational database sys-tem cannot meet the requirements of the current status. In this paper, focus-ing on the visualized analysis model of Hadoop business data, it analyzed the business data in terms of the visualized platform, database and analysis model etc. Depending on the analysis, offline-data analysis and data visualization for Hive database will be greatly improved, so that references and suggestions can be provided for the visualized analysis model of Hadoop business data.
Keywords
Hadoop, Business Data Visualization, Analysis Model
1. Introduction
With the great development of the society, people are living in a world full of information. Today, the world where we live has more and more information carriers, for example mobile intelligent device and TV commerce website are the commonly-used information carrier. Because of these information carriers, large amounts of business data have been generated and delivered. For the business data, there are useful one which can help people correctly analyze the trend and make a right decision if people are able to timely realize the information value and rationally use the information. For data visualization, it is that valuable in-formation is extracted from a large group of inin-formation, which will be pre-sented by charts and figures. So we can say that data visualization is a kind of How to cite this paper: Wang, Z.X. (2018)
Visualized Analysis Model for Hadoop Business Data. Journal of Computer and Communications, 6, 14-21.
https://doi.org/10.4236/jcc.2018.67002
Received: June 26, 2018 Accepted: July 22, 2018 Published: July 25, 2018
Copyright © 2018 by author and Scientific Research Publishing Inc. This work is licensed under the Creative Commons Attribution International License (CC BY 4.0).
http://creativecommons.org/licenses/by/4.0/
DOI: 10.4236/jcc.2018.67002 15 Journal of Computer and Communications form whose presentation is visualized. Normally, under the ground of business intelligence, decision-maker must make a conclusion and analysis on the pre-viously-obtained data experience, trying to make innovations and perfections based on the original data. In this way, one is able to get a favorable advantage in the competition. But the way to extract valuable information from a large amount of information is quite complicated and complex, which will not only waste the human resources but also adversely affect the extraction efficiency. Therefore, data visualization can get the business data deliver to people via charts or figures, so that people can get valid information in a more convenient way. Anyway, data visualization can greatly help the analysis of business data [1]. This paper analyzes the existing Hadoop platform technology and the tech-nologies concerned, studies on visualized analysis model for Hadoop business data, proposes experiment of visualized analysis model for Hadoop business da-ta.
2. Analysis on Existing Hadoop Platform Technology
With the advancement of the society, the servers used to establish the traditional e-business system were quite expensive and relational database system is used as the business database. Being affected by cloud computing and internet, business data is experiencing an exponential growth and the traditional database system is unable to well handle such a situation and fails to satisfy the basic require-ments on data analysis and data processing. Under this background, here comes Hadoop technology, by which large amounts of business data can be rationally processed. But what is Hadoop platform technology? Normally, Hadoop plat-form technology has two major cores—HDFS (the distributed file system) and MapReduce (parallel computation framework). For HDFS, it has a superior abil-ity of fault tolerance, which is mainly used by low-price hardware. HDFS can provide a high throughput for the users so that they can conveniently visit the data. Therefore, HDFS can greatly push forward the business with large amounts of data sets. What’s more, HDFS loosens the restrictions to POSIX so that the form to visit the data information existed in the file system can be greatly im-proved. Now, many Chinese enterprises are utilizing HDFS. According to the current situation in China, this paper studied the Hadoop platform, hoping to realize the business data visualization; also, this paper analyzed how to solve the existing problems and how to get it feasible [2].
3. Analysis on Technologies Concerned
3.1. Study on Hadoop and Other Technologies
clus-DOI: 10.4236/jcc.2018.67002 16 Journal of Computer and Communications
ter [3]. Hadoop has both narrow meaning and broad meaning. Normally, the
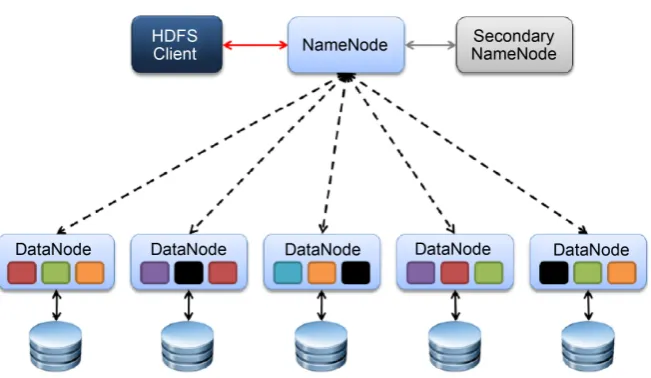
narrow meaning is that Hadoop is equivalent to HadoopCore, which consists of HDFS and MapReduce engine; the broad meaning is Hadoop ecological system, which consists of Hadoop and some source-opening tools like HBase, Sqoop and Zookeeper etc. In the following, a detailed study will focus on HDFS framework, MapReduce framework, Hive data warehouse and HBase database. For Hive da-ta warehouse, it is a distributed warehouse tool existed in Hadoop, where all the data is stored in HDFS. By Hive data warehouse and HDFS, structural data file can be changed into a database list which can better present the data informa-tion. What’s more, data inquiry can be done by pushing forward the mode of SQL language inquiry. It seems that HDFS high-level design is rather simple and easy because there are only two parts—NameNode and DataNode, whose com-munication is done via TCP/IP. Normally, one HDFS cluster has one Name-Node and several DataName-Nodes, where there is also a special machine to run the NameNode cases. From Figure 1, we can see that the NameNode does not have a direct communication with DataNode. Therefore, when designing the cluster, NameNode will not proactively make RPC. Instead, NameNode uses the RPC requirement from the user terminal [4], which is shown in Figure 1.
3.2. Study on Data Visualization
[image:3.595.210.533.507.709.2]Today, several data visualization forms are being widely used by business activi-ties, including matrix graph, teaching coordinate diagram and cloud chart, etc. Every data visualization has its own advantages and disadvantages, whose appli-cation value will not come into play unless a rational choice is made. However, the selection mainly depends on that whether the data visualization is able to help us better observe the data. Normally, visualized graphs consist of several basic parts, including primary area, graphics primitive and legend etc. Primary area, the most important part, is the major board and model used to make
DOI: 10.4236/jcc.2018.67002 17 Journal of Computer and Communications visualized graphs, which is in the shape of square or rectangle. Actually, if the visualized graphs are organized differently, the contents delivered to the user will be different accordingly. For example, taking bar diagrams and maps as the re-search subject, rectangular coordinate is always the benchmark existed in bar diagram, whose vertical axis and horizontal axis represents the metrics and types respectively. Contrarily, geographic map is the benchmark of map, whose me-trics are presented in different colors. From the aforementioned, we can know that once data visualization is to be done, it is mandatory to get the data orga-nized and converted differently. For example, if bar chart is used to show the sales volume and amount of a commodity, key elements can be expressed ab-stractly, which will be used to form a visualized analysis model. Then depending on data visualization technology and Hadoop, a visualized analysis mode for Hadoop business data can be established more conveniently [5].
4. Study on Visualized Analysis Model for Hadoop
Business Data
First of all, it is necessary to know that the study is based on Hadoop cloud computation platform. After the foundation is defined, visualized analysis model for Hadoop business data can be designed and established. For business, all business data is stored in the relational database so it is necessary to deliver the business data to HDFS. After the delivery, Hive data warehouse can be con-structed. As long as data is transferred to Hive, the analysis results can be put into Hbase database. If so, the final results will blend with the already-existed visualized model, by which a visualized analysis model for Hadoop business data will be formed.
4.1. Data Integration of Visualized Analysis Model for
Hadoop Business Data
For data integration of visualized analysis model for Hadoop business data, it is a process that valuable business data is extracted from the enterprise database and stored to Hadoop HDFS. Normally, data storage includes two stag-es—full-amount import of original data and increment import. In this experi-ment, Sqoop was used to do the data import. See Figure 2 for Sqoop structure. Sqoop belongs to Hadoop ecological system, whose role is to do the data delivery between Hadoop and relational database. Furthermore, Sqoop is able to deliver the valuable data existed in relational database to HFDS [5].
4.2. Study on Transformation and Storage of Hadoop
Business Data
DOI: 10.4236/jcc.2018.67002 18 Journal of Computer and Communications
Figure 2. The model for Hadoop business data.
independent from each other, without any connection [6]. If the business data is composed to integrate with each other, conflicts will be caused. Therefore, it is mandatory to establish a temporary Hive list to get all business data imported to the list temporarily. This is the field combination. After that, field combination will be rationally done via HiveQL, which will make sure that the business data is totally professional and exclusive. Field split: time attribute is a kind of time in-formation which is relatively complete, thus, if detailed inquiry and high effi-cient inquiry are required, it is mandatory to split the time field, making them become an independent information only including year, month and day. Oper-ation process: first, design a temporary Hive list and partition table, import business data into the temporary Hive list; split the independent time field via HiveQL and import the split field into the partition table [7].
4.3. Study on Visualized Data Analysis and Visualized Model
Establishment for Hadoop Business Data
DOI: 10.4236/jcc.2018.67002 19 Journal of Computer and Communications of formation”. Analysis theme is used to distinguish the statistical analysis sults while time of formation is used to identify when the statistical analysis re-sult is formed.
According to Table 1, we can know about the key design. For example, how many columns of the key are not always ascertained, and which can be rationally set based on the actual business data. Analysis models about attribute set are mainly stored in the column. The member property is that an inquiry record can be accurately identified in the inquiry result.
Compared with the Category 1 key, the Category 2 key is more complicated and more detailed. For Category 2 key, the design is in the mode “analysis theme + member property + time of formation”. Actually, Category 1 and Category 2 have the same column family while their columns are different. And the attribute value of inquiry result is stored in each column.
5. Proposal for Experiment of Visualized Analysis Model for
Hadoop Business Data
5.1. Analysis on Hadoop Cluster Configuration
The feasibility of visualized analysis model for Hadoop business data can be ve-rified by experiments and the experiment can be further veve-rified by establishing Hadoop cloud computation platform via computer network center and knowing about the Hadoop cluster, hardware configuration, system version, software ver-sion and relevant parameters [7].
5.2. Verify Experiment of Visualized Analysis Model for Hadoop
Business Data
Purchase-sell-stock management platform existed in small and micro enterprises were used to verify the visualized analysis model for Hadoop business data. See Figure 3 for the structure of Hadoop cloud computation system. From the fig-ure, we can know that Hadoop cloud computation platform system uses a dis-tributed database consisting of router and database server. Being as the database of business data, Oracle requires that each database server shall have a corres-ponding database example while each example should have several table spaces. On Hadoop cloud computation platform, all enterprises can be divided into two groups—independent enterprise and chain enterprise. For independent enter-prise, their table space is relatively independent while chain enterprises com-monly possess an independent table space. On Hadoop cloud computation plat-form, about 1000,000 enterprises can be existed at most, each can only have 1000 orders at most every day. Since Hadoop cloud computation platform uses a
Table 1. Key and column family.
KEY COLUMNFAMINLY
DOI: 10.4236/jcc.2018.67002 20 Journal of Computer and Communications
Figure 3. The structure of Hadoop cloud computation system.
distributed system, data existed in Hadoop cloud computation platform will be distributed on each server. Thus, it is mandatory for us to do the data integration via some efficient measures, by which decentralized data can be integrated onto Hadoop cloud computation platform. Then a model can be established for all the data integrated on Hadoop cloud computation platform [8].
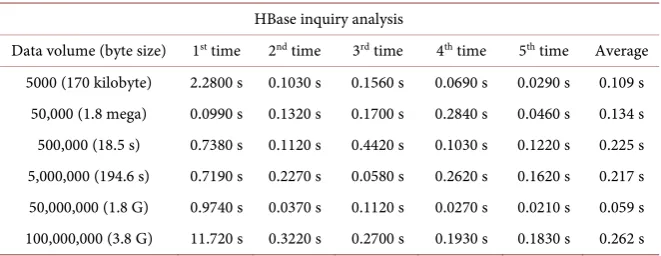
After the experiment is done, it is mandatory to analyze the experiment. The reason is that when storing data analysis results and establishing data visualized model, HBase database was used by Hadoop cloud computation platform [9]. Besides, high requirements are set to the response speed of Hadoop business da-ta visualization, it is also mandatory to repeat the experiment to test the inquiry performance of HBase and compare the experiment results. See Table 2 (analy-sis on the time spent inquiring the data for five times and the time spent on common inquiry).
By analyzing the experiment and the table, conclusions can be obtained. For the 1st inquiry, connection between the client terminal and cluster shall be set up, which makes the inquiry time long. Actually, the time required by inquiry is greatly affected by the network and cluster status etc. After the connection is set up, the inquiry time becomes more stable, millisecond is needed only. So ac-cording to the experiment, we can know that Hbase can satisfy the requirements.
According to the analysis on Hadoop technologies, data visualization tech-nology and experiments, we can know that the visualized analysis model for Hadoop business data is feasible and it will play a positive role in the actual ap-plication [10].
6. Conclusion
DOI: 10.4236/jcc.2018.67002 21 Journal of Computer and Communications
Table 2. HBase inquiry analysis.
HBase inquiry analysis
Data volume (byte size) 1st time 2nd time 3rd time 4th time 5th time Average
5000 (170 kilobyte) 2.2800 s 0.1030 s 0.1560 s 0.0690 s 0.0290 s 0.109 s 50,000 (1.8 mega) 0.0990 s 0.1320 s 0.1700 s 0.2840 s 0.0460 s 0.134 s 500,000 (18.5 s) 0.7380 s 0.1120 s 0.4420 s 0.1030 s 0.1220 s 0.225 s 5,000,000 (194.6 s) 0.7190 s 0.2270 s 0.0580 s 0.2620 s 0.1620 s 0.217 s 50,000,000 (1.8 G) 0.9740 s 0.0370 s 0.1120 s 0.0270 s 0.0210 s 0.059 s 100,000,000 (3.8 G) 11.720 s 0.3220 s 0.2700 s 0.1930 s 0.1830 s 0.262 s
After the analysis and study, business data will be transferred to Hadoop plat-form from the relational database. Then the data on Hadoop platplat-form will be processed and studied by the way of statistical analysis. If we want to get the whole process smooth, all researchers shall attach great emphasis to data analy-sis, establishment and storage of analysis model. The feasibility and application value of Hadoop’s commercial data visualization analysis model can only be rea-lized and verified when all aspects are fully considered.
Conflicts of Interest
The authors declare no conflicts of interest regarding the publication of this paper.
References
[1] Gao, X.W. (2015) Hadoop Based Context Aware Recommendation System Research and Design. North Central University, Qinhuangdao.
[2] Chen, X.Z. (2015) Design and Implementation of Hadoop Based Data Job Man-agement Platform. School of Engineering and Information Technology, Chinese Academy of Sciences, Beijing.
[3] Battle, Y. (2015) Multi Database System. North China University of Technology, Beijing.
[4] Tang, R.W. (2015) Application Research Based on HIVE Multi-Dimensional Analy-sis Technology. North China University of Technology, Beijing.
[5] Zhang, H.A. (2015) Hadoop Based Multi Data Source Data Mining Technology Re-search. North China University of Technology, Beijing.
[6] Zhang, W.Z. (2012) Business Intelligence Based on B/S Mode. Ocean University of China, Qingdao.
[7] Wei, Q. (2012) Analysis and Design of Visualization System for Social and Eco-nomic Statistics. Yunnan University, Yunnan.
[8] Zhu, Z. (2008) Research and Application of Massive Data Processing Model Based on Hadoop. Beijing University of Posts and Telecommunications, Beijing.
[9] Li, H., Zhao, T., Li, N., Cai, Q. and Du, J. (2017) Feature Matching of Multi-View 3D Models Based on Hash Binary Encoding. Neural Network World, 27, 95-106. https://doi.org/10.14311/NNW.2017.27.005