A
B
IG
D
ATA
A
NALYTICS AND
P
ROCESSING FOR
U
RBAN
S
URVEILLANCE
S
YSTEMS
L
ING
H
U
School of Computing and Communications
Lancaster University
A thesis submitted for the degree of Doctor of
Philosophy
I
Declaration
I hereby confirm that the content presented in this thesis is totally original and have
not been submitted in whole or in part for consideration for any other degree or
qualification of any other university. Any information which derived from other
sources has been indicated inside this thesis.
Ling Hu
II
Acknowledgements
The author would like to acknowledge Professor Qiang Ni for his guidance and
support throughout this work. Furthermore, the production of this thesis would not
have been possible without the support from the Institute of Software Application
Technology, Guangzhou & Chinese Academy of Sciences (CAS) and the Dongguan
III
Abstract
Urban surveillance systems will be more demanding in the future towards smart city
to improve the intelligence of cities. Big data analytics and processing for urban
surveillance systems become increasingly important research areas because of infinite
generation of massive data volumes all over the world.
This thesis focused on solving several challenging big data issues in urban
surveillance systems.
First, we proposed several simple yet efficient video data recoding algorithms to be
used in urban surveillance systems. The key idea is to record the important video
frames when cutting the number of unimportant video frames.
Second, since the DCT based JPEG standard encounters problems such as block
artifacts, we proposed a very simple but effective method which results in better
quality than widely used filters while consuming much less computer CPU resources.
Third, we designed a novel filter to detect either the vehicle license plates or the
vehicles from the images captured by the digital camera imaging sensors. We are the
first to design this kind of filter to detect the vehicle/license plate objects.
Fourth, we proposed novel grate filter to identify whether there are objects in these
images captured by the cameras. In this way the background images can be updated
from time to time when no object is detected.
Finally, we combined image hash with our novel density scan method to solve the
IV
Table of Contents
Chapter 1 ... 1
Introduction ... 1
1.1 Background ... 1
1.1.1 Motivation and Research Objectives ... 1
1.1.2 Our Research Topics ... 3
1.2 Thesis Contributions ... 3
1.2.1 Feature-Based Low-Complexity Intelligent Big Video Data Recording Algorithms for Urban Surveillance Systems ... 3
1.2.2 Reducing the Visual Block Artifacts of JPEG Images ... 5
1.2.3 Novel License Plate (or Vehicle) Recognition Methods ... 6
1.2.4 Low-Complexity Automatic Background Subtraction Techniques ... 9
1.2.5 Fast Saliency-Aware Image Hash for Near Duplicate Images Retrieval ... 9
1.3 List of Publications... 10
Chapter 2 ... 11
Low-Complexity Big Video Data Recording Algorithms For Urban Surveillance Systems ... 11
2.1 Introduction ... 12
2.2 Novelty and Contributions ... 14
2.3 Urban Surveillance System Model ... 15
2.4 Our Proposed Schemes... 16
2.4.1 Bayesian-Based Analysis ... 16
2.4.2 Pre-Treatment Scheme ... 18
2.4.3 Post-Treatment Scheme ... 19
2.4.4 Combined-Treatment Scheme ... 20
2.4.5 Complexity Analysis ... 23
V
2.5.1 Pre-Treatment Scheme ... 23
2.5.2 Post-Treatment Scheme ... 28
2.5.3Combined-Treatment Scheme ... 31
2.6 Summary ... 35
Chapter 3 ... 36
Big Data-Driven Fast Reducing the Visual Block Artifacts of DCT Compressed Images for Urban Surveillance Systems ... 36
3.1 JPEG Introduction ... 37
3.2 Background ... 41
3.3 Our Proposed Method and Results ... 43
3.4 Summary ... 49
Chapter 4 ... 50
IoT-Driven Automated Object Detection Algorithm for Urban Surveillance Systems in Smart Cities... 50
4.1 Introduction ... 51
4.2 Our Proposed Algorithm ... 54
4.2.1 Pre-Treatment of the Image ... 54
4.2.2 Design of Novel Filter ... 57
4.2.3 Improvement of the Filter ... 60
4.2.4 Object Area in the Horizontal Direction ... 62
4.2.5 Use Filter to Detect the Perpendicular Direction Area ... 63
4.3 The Flow Chart of Our Proposed Method ... 66
4.4 Experimental Results of Our Proposed Filters ... 67
4.4.1 Use Our Filter to Detect Vehicle License Plates ... 67
4.4.2 Use Our Filter to Detect Vehicles... 71
4.5 Summary ... 77
VI
Big Data Oriented Novel Background Subtraction Algorithm for Urban Surveillance
Systems ... 78
5.1 Introduction ... 79
5.2 Our Proposed Algorithm ... 81
5.2.1 Pre-Treatment of the Captured Image ... 81
5.2.2 Design of Our Effective Filter ... 83
5.3 The Flow Chart of the Proposed Algorithm ... 87
5.4 Experimental Results of Our Proposed Filters ... 88
5.5 Summary ... 102
Chapter 6 ... 103
Fast Saliency-aware Image Hash for near duplicated Images retrieval ... 103
6.1 Introduction ... 104
6.2 Solving Object Position Tampering Problem ... 106
6.2.1 Tampering Images and Pre-treatment... 106
6.2.2 Our Density Scan method ... 108
6.2.3 Further Testing on Our Proposed Method on Car Images ... 113
6.3 The Flow Chart of Our Method... 119
6.4 Experimental Results... 120
6.5 Summary ... 132
Chapter 7 ... 133
Conclusion ... 133
1
C
HAPTER
1
I
NTRODUCTION
1.1 Background
1.1.1 Motivation and Research Objectives
As we know, according to the 3V’s definition, big data has three main characteristics,
which are volume, velocity and variety [1]. Especially, the videos data is the biggest
among all types of data. It is obvious that the research of videos data is the key point
of big data research areas. According to Cisco’s statistics, images and videos make up
about 90 percent of overall IP traffic [2]. Hence video data analysis is receiving more
and more attention due to its increasing applications and huge data volume. For
instance, the data volume of all video surveillance devices in Shanghai, China is up to
1 TB every day [3]. The explosive increasing number of video resources has brought
an urgent need to develop intelligent methods to reduce the pressure on the
management processes [4].
The applications of urban surveillance systems include counter surveillance in banks,
entrance monitoring of a safeguard region, traffic monitoring of crossroad, and so on.
In most cases, the video cameras are fixed and the surveillance regions are also
located constantly. In current urban video surveillance systems, there are huge amount
of cameras working 24 hours per day, 7 days a week. Every camera focuses on a
2
second (FPS) of every camera is normally kept at 30. In order to get higher quality for
instant monitoring, some cameras increase the speed from 30 FPS to 60 FPS, or even
higher (e.g. some cameras even reach 100 FPS). In these systems, digital video
recorders (DVRs) are used to record the video frames; the most common number of
inputs for a DVR is 1, 2, 4, 8, 16 and 32. Obviously the key components of the DVRs
are huge hard discs (HDs). There are three key research challenges which motivate
my PhD research work: 1) Although various compression techniques are currently
used to reduce the size of every frame, the demand for high capacity HDs still
increases rapidly due to huge amount of frames generated and to be generated
explosively in the future. 2) As videos are composed of visual images, reducing the
sizes of images while keeping a reasonable visual quality is an important research
topic. However, the widely used JPEG image compression techniques have
insurmountable problems. For instance, image encoding deficiencies such as block
artifacts have to be removed frequently which demands research. 3) Intelligent vehicle
license plates (or vehicles) recognition is a key component of Urban Surveillance
Systems, with important applications, such as road traffic monitoring, security control
of restricted areas, automatic parking lots access control, searching for stolen vehicles,
etc. This is a challenging research topic given its high computational complexity.
Therefore, the main objectives of my PhD research are as follows:
To develop low-complexity intelligent big video data recording algorithms to
reduce the HDs’ space.
To reduce the visual block artifacts of JPEG Images by using/designing novel
3
To design novel low-complexity intelligent vehicle license plate (or vehicle)
recognition methods.
1.1.2 Our Research Topics
First, we research on low-complexity intelligent big video data recording algorithms
to save the HDs’ space. The second topic is to reduce the visual block artifacts of
JPEC images for Urban Surveillance Systems. The third one is to design a novel filter
to recognize vehicle plates (or vehicles) inside the images. Then we improve our filter
to identify whether there are objects in these images captured by the cameras, hence
the background subtraction is easy to be achieved. At last, our research is to combine
the image Hash methods with our proposed filters to retrieve similar duplicate images,
which is difficult of accomplishment with only the image Hash methods.
1.2 Thesis Contributions
The main contributions of this thesis can be summarized as five parts, which are
described in section 1.2.1 to 1.2.5.
1.2.1 Feature-Based Low-Complexity Intelligent Big Video Data
Recording Algorithms for Urban Surveillance Systems
In order to obtain useful information from huge images and videos, many researchers
focus on object detection from videos. For example, an application for vehicle search
in crowded urban surveillance videos was proposed [5]. Another work proposed a
new visual object tracking algorithm using a novel Bayesian Kalman filter with
4
Concerning the video data analytics, researchers focus on compressing every single
image frame. For example, some people proposed a method for simultaneously
estimating the high-resolution frames and the corresponding motion field from a
compressed low-resolution video sequence [7]. Another research hybrids
motion-compensation and transform coding schemes, uses Bayesian method to enhance the
resolution of compressed video data [8]. In order to cope with the high computing
complexity, some researches focus on implementing the computing on hardwired
design, such as embedded compression engine targeting the reduction of full HD
video transmission bandwidth over the wireless networks [9]; or a CMOS image
sensor for tracking the moving objects in region-of-interest and suppressing motion
blur [10].
Although there are some work focusing on the single frame compression of video
data, currently there is no work done to solve the recording processes of huge video
data. We proposed simple and effective methods to dramatically cut the image frame
number which needs to be stored up in the hard discs (HD) of the urban surveillance
systems. The schemes we proposed include pre-treatment scheme, post-treatment
scheme and combined-treatment scheme. To the best of our knowledge, we are the
first to propose these schemes.
The novelty of our methods is to only record those important frames. The simulation
results show that under normal situations, the occupation space of the HDs could be
only a little part of the original one. In this way, the same HDs can record many more
5
A more important aspect of our schemes is the avoidance of complex calculation. The
time complexity of our methods is only O(n), which means they are very efficient and
economic, hence they are practical to be used in real urban surveillance systems.
1.2.2 Reducing the Visual Block Artifacts of JPEG Images
Since videos are piled up by images, researching on effective image compression
techniques is an important research topic. Although the JPEG compression techniques
are widely used nowadays, it encounters insurmountable problems. For instance,
image encoding deficiencies such as block artifacts have to be removed frequently.
In the mid 80’s, the joint collaboration of International Telecommunication Union
(ITU) and International organization for Standard (ISO) introduced the standard for
the compression of grey scale and colour images. This standard is named the Joint
Photographic Experts Group (JPEG) [11]. It has high compression ratio and it is easy
to be implemented, hence the JPEG is widely used nowadays [12].
The core codec method of JPEG is Discrete Cosine Transform (DCT). DCT expresses
a sequence of data points in terms of a sum of cosine functions oscillating at
different frequencies.
The two-dimensional DCT transform is used in JPEG image compression.
In order to get the results of JPEG transform , we programmed in Matlab and
simulated the different compression ratio.
In 2000, a new image standard JPEG2000 is emerging. JPEG2000 is the latest image
compression standard from the Joint Photographic Expert Group. It was established as
6
compression standard JPEG2000 is based on the DWT algorithm. JPEG2000 has
excellent compression performance while at the same time it provides a rich set of
features, e.g., resolution and signal to noise ratio (SNR). In each of the JPEG2000
operational modes, there exists separate wavelet transform [13]. Wavelet analysis is a
very important research area in digital image processing. It is a Joint time-frequency
analysis and gives both the information in the time and frequency areas.
The process for wavelet transform is to let the image to pass through a low pass filter
first, and then pass through a high pass filter. In this way, an image is divided into
four parts, which are LL, HL, LH and HH, as shown in Figure 1.1. This is the process
of one stage two-dimension wavelet transforms, and the process can be extended
further to two stages or more stages.
In this thesis, we have reduced the block artifacts of the urban surveillance systems by
proposing a low-complexity and effective method.
image L H
LL
LH HH HL
Figure 1.1. One Stage Two-dimension Wavelet transforms
1.2.3 Novel License Plate (or Vehicle) Recognition Methods
Intelligent Vehicle Licence Plate Recognition (VLPR) is an important component of
Urban Surveillance Systems. It can be used for automated car identification. Since the
vehicle licence plate number is a unique identification for a vehicle, the VLPR is a
7
monitoring, security control of restricted areas, automatic parking lots access control,
searching for stolen vehicles, etc. The research of VLPR has become a worldwide hot
topic.
VLPR algorithms in images are generally composed of three steps. The first step is
the license plate localization, which is the extraction of a license plate region from an
image. The second step is the segmentation of the plate characters into single
character images. The third step is the recognition of each character. Among the three
steps, the licence plate recognition (LTR) is usually the most important and difficult
module in VLPR systems [14], which influences the accuracy of the system
significantly.
Numerous techniques have been proposed for locating the plate through visual image
processing [15]. A typical way is vertical edge matching [16]: If the two vertical
edges of a licence plate can be detected correctly, four corners of the plate can then be
located, so that the license plate can be extracted. Based on the contrast between the
grayscale values, [17] also proposed a fast vertical edge based method for LTR, to
reduce the computational time of the whole VLPR systems.
A commonly used technology is morphology based license plate detection. A
morphology based method is to extract important contrast features as guides to search
the desired license plates [18]. In [19], to extract text information from the picture, an
adaptive threshold, fractal filter and morphological analysis has been used. Papers
[20] and [21] combined edge statistics with morphological steps to eliminate
unwanted edges in the images.
Another important technology is colour based methods, which make use of the colour
8
model into HSV model or HSI model, where the H, S, V, I represent hue, saturation,
value intensity respectively. In papers [23] [24], the combination of edge information
and plate colour are used to detect the place of vehicle plates.
Some neural network-based vehicle license plate recognition methods are also
proposed. These methods attempted to train a classifier to give a proper response to
the plate image. In [25], the authors introduced genetic algorithm (GA) to the training
process, combined the structure feature with the statistical feature to compensate
mutually. In [26], a license plate recognition system based on neural networks was
designed and developed. The system used a neural network chip named as CogniMem
to recognize license plates. In [27], the authors proposed method based on wavelet
transform to decompose the images into different layers, and then use the low
frequency images to combine with neural networks. In this way, the recognition time
of the license recognition system can be reduced.
Another method was proposed based on the horizontal and vertical frequency energy
differences. In [28], the authors used Daubechies wavelet to calculate the vertical and
horizontal frequency energy curves, since the frequency is the highest near the
number plate.
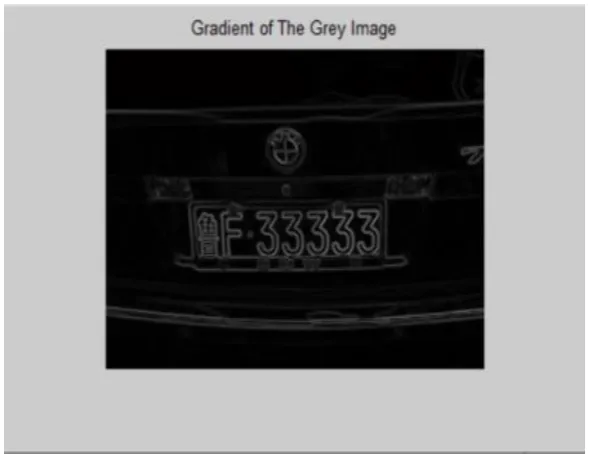
Our research has investigated the frequency characteristics of vehicle images, in order
to design a novel filter to search the images, and to filter out the vehicle license plate
area or vehicles area. Since our research focused on the frequency characteristics of
these images, it made the search process comparably simple when comparing to
9
1.2.4 Low-Complexity Automatic Background Subtraction Techniques
Due to the tremendous data generated by urban surveillance systems, the demand for
big data oriented low-complexity automatic background subtraction techniques is
increasing.
Background subtraction method firstly builds the background model, and then uses
the current frame image to subtract the background model. In this way the targets are
picked out.
The background subtraction method depends mainly on the background modelling
techniques, in which Gaussian mixture models (GMMs) are now the popular methods.
It depends on the moving situation of objects.
We propose an automatic background subtraction method which is not depend on the
moving situation of objects. In this way the computer can automatically renew the
image as the new background when no object is detected. This method is simple and
also robust to the impact of light changing.
1.2.5 Fast Saliency-Aware Image Hash for Near Duplicate Images
Retrieval
Hash methods have been widely used in image search. In image Hash methods,
unique codes which are extracted from images are used as the identifications for
images.
The basic principle of image Hash methods determine that the positions of the main
objects inside an image should be unmoved, which limits the wide usage of image
10
In this part, we will combine image Hash method with our proposed method to find
near duplicate images. In this way, the slight moving of the object will be detected
and near duplicated images with same source will be determined automatically. By
using this simple algorithm, our proposed Image Hash method is fast, saliency-aware
and practical.
1.3 List of Publications
L. Hu, Q. Ni, F. Yuan, “Big data oriented novel background subtraction
algorithm for urban surveillance systems”, Big Data Mining and Analytics,
Volume: 1, Issue: 2, Pages: 137-145, June 2018.
L. Hu, Q. Ni, “IoT-Driven Automated Object Detection Algorithm for Urban
Surveillance Systems in Smart Cities”, IEEE Internet of Things Journal,
Volume: 5, Issue: 2, Pages: 747-754, April 2018.
L. Hu, Q. Ni, “Low-Complexity Big Video Data Recording Algorithms for
Urban Surveillance Systems”, International Journal of Data Mining &
Knowledge Management Process, Vol. 6, Number 6, pp. 1-16, November
2016.
L. Hu, Q. Ni, “Big Data-Driven Fast Reducing the Visual Block Artifacts of
DCT Compressed Images for Urban Surveillance Systems”, International
Journal of Data Mining & Knowledge Management Process, Vol. 6, Number
11
C
HAPTER
2
L
OW
-C
OMPLEXITY
B
IG
V
IDEO
D
ATA
R
ECORDING
A
LGORITHMS
F
OR
U
RBAN
S
URVEILLANCE
S
YSTEMS
Part of this chapter was published as a research paper below:
L. Hu, Q. Ni, “Low-Complexity Big Video Data Recording Algorithms for Urban
Surveillance Systems”, International Journal of Data Mining & Knowledge
12
Big Video data analytics and processing are becoming increasingly important research
areas because of infinite generation of massive video data volumes all over the world.
In this chapter, by utilizing Bayesian-based importance analysis, we propose a set of
novel, simple but effective video recording methodologies and intelligent algorithms
to solve the so-called big video data volume problem in urban surveillance systems.
The complexity of our proposed algorithms are only O(n), hence they can be easily
implemented in real video urban surveillance systems without complicated
computational cost. The simulation results show amazing recording efficiency. Our
methods can dramatically reduce the hard discs (HD) occupation space requirement
so that the recording time of HDs can be greatly enlarged.
2.1 Introduction
Big data is used to describe a massive volume of both structured and unstructured data
sets which is very large and beyond the ability of traditional database tools to capture,
manage, record and process them. According to the 3V's definition, big data has three
main characteristics, which are Volume, Velocity and Variety [1][29]. Volume refers
to an extreme amount of data; the examples of big data might be petabytes (1,024
terabytes) and exabytes (1,024 petabytes) of data consisting of billions to trillions of
records, from different sources (e.g. Web, sales, customer contact centres, social
media, mobile data and so on). Velocity describes how fast the data is produced and
must be processed. Variety means a wide range of data types. For example, data can
be collected/stored in multiple formats, which may include image, audio, video, texts
and other forms of data.
Among all these different varieties of big data, videos are the biggest. According to
13
[30]. Hence video data analysis receives an increasing attention due to its
fast-growing applications and huge data volumes. For instance, the data volume of all
video surveillance devices in Shanghai, China is up to 1 TB every day [31] and is
expected to keep growing substantially in the future. The explosive increasing number
of video resources has brought an urgent need to develop intelligent methods to
reduce the pressure on the database management processes [32].
In order to dig out useful information from huge image and video data, many
researchers focus on object detection from videos. For example, an application for
vehicle search in crowded urban surveillance videos was proposed [33]. Another work
proposed a new visual object tracking algorithm using a Bayesian Kalman filter with
simplified Gaussian mixture [34].
Concerning the video data analysis, most researchers in the literature focus on
compressing every single image frame. For example, some people proposed a method
for simultaneously estimating the high-resolution frames and the corresponding
motion field from a compressed low-resolution video sequence [35]. Another research
combines motion-compensation and transform coding schemes, and uses Bayesian
method to enhance the resolution of compressed video data [36]. In order to cope with
the high computational complexity, some researches focus on implementing the
computation on a hardwired design, such as embedded compression engine targeting
the reduction of full high definition video transmission bandwidth over the wireless
networks [37]; or a CMOS image sensor for tracking the moving objects in
region-of-interest and suppressing motion blur [38].
Although there is much work focusing on the detecting information from frames and
14
volume in the video recording processes. Even though it is important to deal with the
single images, efforts need to be done on the recording processes to solve the big
video data recording problem. Nowadays the big video data increases rapidly, which
makes its volume much higher than the potential hard discs (HD) capacity. In this
chapter, we propose a set of simple and effective methods to intelligently and
dramatically reduce the video frame number which are needed to be stored up in the
HDs for the urban surveillance systems. To the best of our knowledge, we are the first
to propose these schemes.
2.2 Novelty and Contributions
In this chapter, we propose several new simple but effective methods to dramatically
reduce the space of the HDs in order to record the huge amount of video data
generated by urban surveillance systems.
Different from the current efforts in the literature which focus on single video frame
compression, the novelty of our methods is to analyse and to only record those
important frames according to feature requirement. Using Bayesian-based importance
analysis, we propose three intelligent mechanisms, called pre-treatment scheme,
post-treatment scheme and combined-post-treatment scheme. We first determine which are
unimportant frames and then remove part of them in the recording process to
dramatically reduce the video recording data volume while at the same time to keep
acceptable visual quality. The simulation results demonstrate that using our proposed
methods, the occupation space of the HDs can be significantly reduced.
An important advantage of our schemes is their low complexity features. The
15
hence they are easy to be adopted and deployed in real video urban surveillance
systems.
2.3 Urban Surveillance System Model
Urban surveillance systems are widely used now to improve the intelligence of cities.
The normal applications include counter surveillance in banks, entrance monitoring of
safeguard regions, traffic monitoring of crossroads, and so on. In most cases, the
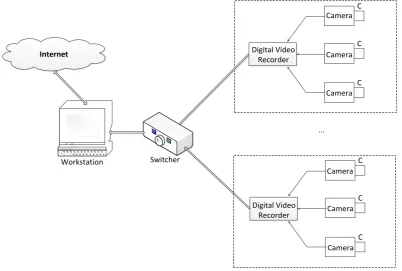
cameras are fixed and the surveillance regions are also located constantly. A typical
diagram of urban surveillance system is shown in Figure 2.1. In current urban video
surveillance systems, there are huge number of cameras working 24 hours per day,
and 7 days a week. Every camera focuses on a fixed area, in order to show the
scenarios instantly, clearly and fluently. The frame per second (FPS) of every camera
is normally kept at 30. In order to get higher quality for instant monitoring, some
cameras increase the frame rate from 30 FPS to 60 FPS, or even higher (some
cameras may even adopt 100 FPS). In these systems, digital video recorders (DVRs)
are used to record the video frames; the most common number of inputs for a DVR is
1, 2, 4, 8, 16 and 32. Obviously the key components of the DVRs are huge HDs.
Although various compression techniques are currently used to reduce the size of
every frame, the demand for high capacity HDs still increases rapidly due to the huge
number of frames generated and to be generated explosively in the future.
A widely used way of urban surveillance systems is to monitor the traffic accident
scenes of the roads. Research work has shown that there are four factors to influence
safety management of traffic accident scenes, which are human factor, vehicle factor,
16
factor and management factor normally do not change between a 24 hour period; but
the roads are more crowded at the peak time periods, it can worsen the road and
environment factor and affect the psychological diathesis of drivers, which makes the
probability of traffic accidents occurring to increase [39].
[image:23.595.97.500.195.466.2]C C C C C C Digital Video Recorder Digital Video Recorder Camera Camera Camera Camera Camera Camera Switcher Workstation ... Internet
Figure 2.1. The Basic Diagram of Urban Surveillance Systems
2.4 Our Proposed Schemes
2.4.1 Bayesian-Based Analysis
Concerning the urban video surveillance systems, in order to reduce the number of
recorded video frames, we propose the idea of only recording those frames which are
potentially important. But, how do the systems know or determine which frames are
important without extremely complex analysis of huge video frames data generated
17
theoretical guidance on how to design simple approaches of importance analysis. Let
us assume that there is a camera installed at a bus station to monitor the traffic
situations. We denote A1 and A2 as the events if the time duration is a peak time
period and a non-peak time period, respectively. B is defined as the event if an
accident happens.
A1: The traffic is crowded (i.e. peak time).
A2: The traffic is not crowded (i.e. non-peak time).
B: The event when an accident occurs.
Without loss of generality, we assume that the probabilities of peak time and
non-peak time are the same, that is P(A1)=0.5 and P(A2)=0.5. Since evidences show that it
is more prone for an accident to appear when the traffic is crowded [11], we can
assume the probability of an accident happening at peak time is P(B|A1)=0.03 and the
probability of an accident happening at non-peak time is P(B|A2)=0.01. As defined,
the probability of an accident happening is P(B). Now the problems are, at what time
periods do an accident happen mostly? What is the probability that it happens in the
peak time period? What is the probability that it happens in non-peak time period?
According to Bayesian rule, the probability of the accident happening in peak time
period can be calculated as:
𝑃(𝐴1|𝐵) = 𝑃(𝐴1)𝑃(𝐵|𝐴1)
𝑃(𝐴1)𝑃(𝐵|𝐴1)+𝑃(𝐴2)𝑃(𝐵|𝐴 2) =
0.5×0.03
0.5×0.03+0.5×0.01= 75% (1)
The probability of an accident happening in non-peak time period is obtained as:
𝑃(𝐴2|𝐵) = 𝑃(𝐴2)𝑃(𝐵|𝐴2)
𝑃(𝐴1)𝑃(𝐵|𝐴1)+𝑃(𝐴2)𝑃(𝐵|𝐴2)=
0.5×0.01
18
The Bayesian rule is guidance for us to cut some unimportant frames in the recoding
processes. From the above example we conclude that the probability of an accident
happening in peak time period is much higher than that in off-peak time period even
when the probabilities of peak time and off-peak time are the same. Although the high
quality frames can be shown at 30 FPS or even higher instantly for the surveillants to
keep watching on the scenarios in real time, it is not necessary for all the huge number
of video frames to be recorded into the HDs.
2.4.2 Pre-Treatment Scheme
Our pre-treatment scheme is to divide a whole day into two parts: peak time period
and non-peak time period. How to divide the time period is dependent on different
scenarios. In the peak time period, we keep all the frames to be recorded into the HDs,
which is normally 30 FPS. In this way, the comparably important frames are kept
without loss, because they have higher probability to be reviewed in the future. On the
other hand, we may cut some frames in the non-peak time periods, that is, to reduce
the FPS. Even the FPS is as low as 1, it will effectively record the scenarios with
human being's activities. Considering 1 FPS is only around 3% of the normally 30
FPS, the frames to be recorded could be reduced dramatically. The pseudo-code of
our proposed pre-treatment is outlined in Algorithm 1.
Algorithm 1: Pre-treatment algorithm
Input: The video frames generated by cameras
Return: The video frames needed to be recorded to HD
1. Check current time t
19
3. Goto 6
4. Else
5. Cut the FPS to the pre-defined number of non-peak time period
6. End
7. Record the video frames to HD
As we already know, a typical camera generates 5.4G bytes video data per day.
Hence, with a commonly 25 inputs DVR, it will need 4050G bytes space to record the
videos only for 30 days, which is a tremendous volume. In order to save the space of
HDs, currently the DVRs have the program for the surveillants to choose which days'
video should be recorded. This is obviously a simple but coarse method, which may
cause some important frames to get lost if we cut frames randomly.
Using our scheme, the calculation could be low-cost. Our model is simple to be
implemented within the video processor, concerning the significant efficiency of
cutting big video data. With the same HD space, obviously the total recording time
will be extended.
2.4.3 Post-Treatment Scheme
In some cases, it is not practical to divide a day into two parts, as every time instant
along the whole day could be equally important. Hence we propose a new
post-treatment scheme. In most circumstances, people need to review the recorded video
shortly after something happened. In practice, the probability of the need to review
the recorded videos in the near several days is the highest. When the time flies away,
the need to review the history videos reduces rapidly. By taking this into account, we
20
recorded into the HDs initially, which is normally 30 FPS. Since the importance of the
recorded video frames reduces rapidly with time passing, we thus introduce a cut-off
day. For instance, if we define the cut-off day as 3 days, this means that after the 3
days we could discard some of the recorded video frames, from normal 30 FPS to a
lower FPS. In this way, the re-recorded files will then be significantly smaller to be
saved concerning the space of the HDs.
The process of our proposed post-treatment is depicted in Algorithm 2.
Algorithm 2: Post-treatment algorithm
Input: The recorded video frames
Return: The video frames needed to be re-recorded to HD
1. Check current day d after the frames recorded day
2. if d = cutoff day
3. Discard some frames according to pre-defined FPS
4. Re-record the video frames to HD
5. Else
6. End
2.4.4 Combined-Treatment Scheme
Finally, our pre-treatment and post-treatment may be combined together to achieve
better results. The process of the combined-treatment scheme is shown in Figure 2.2.
When an HD receives the video frames occurred from the surveillance cameras, it can
begin to run the pre-treatment scheme, that is, to cut some frames from the non-peak
21
At later days, the system will check the recorded files to see whether or not the cut-off
day is due. When the cut-off day is due, the post-treatment scheme will begin to work.
The recorded files may be re-recorded with the pre-defined lower FPS; hence the size
of the files will be reduced again.
By combining intelligent video analysis with high performance computing
technology, our proposed methods will help to develop intelligent surveillance video
22 Peak hours?
Received frames at normal FPS from
camera
Pre-defined frames per
second No
Record to HD Yes
Cut-off day?
Do nothing No
Discard some frames
Yes
Re-record to HD
Pre-defined frames per
[image:29.595.139.478.66.630.2]second Next day
23
2.4.5 Complexity Analysis
Let n denote the number of video frames. As for the time complexity of the
pre-treatment scheme, the calculation time cost is only linear with the off-peak time's
number of video frames, hence the time complexity of this scheme is only O(n).
As for the post-treatment scheme, the calculation time cost is linear with the
pre-defined re-record frames' number after cut-off day, hence the time complexity of this
scheme is also O(n).
For our combined-treatment method, the calculation time cost is also linear with the
frame number at off-peak time or after the cut-off day, hence the time complexity of
our combined-treatment scheme is still O(n).
2.5 Simulation Results
2.5.1 Pre-Treatment Scheme
We simulate our schemes and plot the simulation results in figures. In order to reflect
the most common scenarios, we set the FPS at peak time period as 30. The FPS at
off-peak time period may be set from 1 to 30. The off-peak time hours per day could be
chosen from 0 to 24. The simulation results are illustrated in 3-dimensional plots.
24
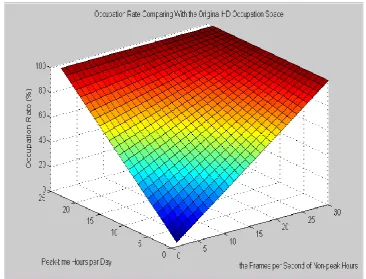
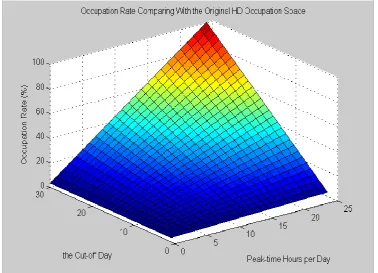
Figure 2.3. Occupation Rate Comparing with the Original HD Occupation Space
(3D)
Figure 2.3 illustrates the occupation rate comparing with the original HD occupation
space for a 24 hours period. X-axis is the frames per second of non-peak hours;
Y-axis shows the peak time hours per day; and Z-Y-axis shows the results of the HD
occupation rate in percentage comparing with the original HD occupation space.
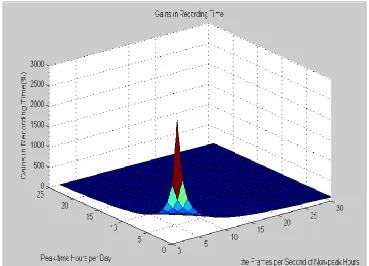
Figure 2.4 shows the gains in recording time comparing with the original time period
with the same HD. X-axis is the frames per second of non-peak hours, which ranges
from 1 to 30. Y-axis shows the peak time hours per day, which is from 0 to 24. Z-axis
shows the gains in recording time with the same HD, which are displayed in
percentage.
Figure 2.3 and Figure 2.4 show significant improvement of the urban video
25
second of non-peak time period, the occupation rate comparing with the original HD
occupation space falls down sharply. At the same time, the gains in recording time
rise up at very high speed, concerning the same HD space. While our scheme is very
[image:32.595.112.482.193.459.2]simple and easy to be implemented, the performance gain is amazing.
Figure 2.4. Gain of Recording Time (3D)
Since Figures 2.3 and Figure 2.4 are 3-dimensional figures, it is not easy for people to
investigate further details. We choose the situations of peak time from 0 to 8 hours per
day, which may cover most common scenarios, to plot the results in 2-dimensions.
The 2-dimensional results are plotted in Figures 2.5 and Figure 2.6.
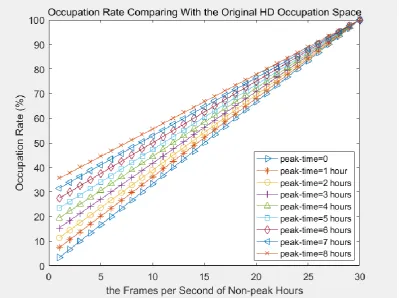
Figure 2.5 is the occupation rate comparing with the original HD occupation space for
a 24 hours period. X-axis is the frames per second of non-peak hours, and Y-axis
26
HD occupation space. For different peak-time hours per day, the results are plotted in
different lines.
Figure 2.6 illustrates the recording time gain comparing with the original time period
with the same HD. X-axis is the frames per second of non-peak hours, and Y-axis
shows the gains in recording time in percentage. For different peak-time hours per
[image:33.595.99.499.263.561.2]day, the results are plotted in different lines.
27
Figure 2.6. Gains of Recording Time
As shown in Figures 2.5 and Figure 2.6, at each different peak time hours per day, the
occupation rate comparing with the original HD occupation space is a linear result,
the lower FPS of non-peak time hours leads to the lower occupation rate.
At the same time, the time gain comparing with the original time period shows the
amazing results. For example, when a camera watches at a never crowded road, the
peak time may be set at 0. When the recorded FPS is set to 1, the system will not lose
the main activities of cars and pedestrians. The occupation rate may be as low as
around 3.3% of original HD space for a 24 hours period; and the recording time gain
28
2.5.2 Post-Treatment Scheme
Again, we plot here the simulation results. We still set the original FPS as 30. The
cut-off days could be chosen from 1 to 30. The FPSs after the cut-off days are set
from 1 to 30. The calculation is based on the original recorded period of 30 days. The
simulation results are also plotted in 3-dimensions. They are illustrated in Figure 2.7
and Figure 2.8.
Figure 2.7. Occupation Rate Comparing with the Original HD Occupation Space
(3D)
Figure 2.7 is the occupation rate comparing with the original HD occupation space for
a 30 days period. X-axis shows the pre-defined cut-off days. After the cut-off day, the
recorded video frames will be discarded partly. Y-axis shows the re-recorded FPSs
after the cut-off day and Z-axis are the results of the HD occupation rate in percentage
29
Figure 2.8. Gains of Recording Time(3D)
Figure 2.8 shows the gain of recording time in percentage using our post-treatment
method, concerning using the same HD occupation space of the original period of 30
days. X-axis are the cut-off days. Y-axis shows the re-recorded FPSs after the cut-off
day. Z-axis shows the gain of recording time in percentage.
Figures 2.7 and Figure 2.8 also show significant improvement of the urban video
surveillance systems. The occupation rate comparing with the original HD occupation
space falls down sharply when we choose smaller cut-off day and smaller re-recorded
FPS after the cut-off day. At the same time, the gain in recording time rises up sharply
in comparison with the same HD space of original 30 days' images.
Again we choose the cut-off days from 1 day to 8 days to plot the 2-dimensional
30
Figure 2.9 shows the occupation rate comparing with the original HD occupation
space for a 30 days period using our post-treatment method. X-axis are the
re-recorded FPSs after a cut-off day, and Y-axis shows the results of the HD occupation
rate in percentage comparing with the original HD occupation space. For different
cases of cut-off day settings, the results are plotted in different lines.
Figure 2.10 illustrates the gain of recording time, concerning using the same HD
space of the original period of 30 days. Again X-axis shows the re-recorded FPSs
after the cut-off day and Y-axis are the results.
Figure 2.9. Occupation Rate Comparing with the Original HD Occupation Space
As shown in Figures 2.9 and Figure 2.10, at each different cut-off day, the occupation
rate comparing with the original HD occupation space is a linear result. The gains of
31
cut-off day is set at 1, it will not lose the main activities of human being and cars. In
these cases, the gain of recording time in percentage are extremely high, which may
easily reach several hundred, or even higher than one thousand percentage in common
use scenarios.
Figure 2.10. Gains of Recording Time
2.5.3
Combined-Treatment Scheme
For our combined-treatment scheme, in order to get the occupation rate comparing
with the original HD occupation space for a 30 days period, we may use X-axis to
represent the peak-time hours per day, and use the Y-axis to show the cut-off day. At
peak time hours and before the cut-off day, the original FPS is still set at 30. At
32
the occupation rate comparing with the original HD occupation space for a 30 days
period. The 3-dimensional simulation results are shown in Figure 2.11.
Figure 2.12 shows the gain of recording time using our combined-treatment method,
as compared to concerning using the same HD occupation space of the original period
of 30 days. The X-axis represents the peak-time hours per day, and the Y-axis shows
the cut-off days. The Z-axis shows the results in percentage, which are the gains of
recording time comparing with using the same HD space of the original video frames
[image:39.595.109.488.317.590.2]of 30 days.
Figure 2.11. Occupation Rate Comparing with the Original HD Occupation Space
(3D)
Figures 2.11 and Figure 2.12 show significant improvement of the urban video
surveillance systems. The occupation rate comparing with the original HD occupation
33
smaller cut-off days, and the corresponding gains of recording time again increase
sharply. The figures show that the proposed combined-treatment scheme achieves
better efficiency than the pre-treatment method or post-treatment method.
Figure 2.12. Gains of Recording Time (3D)
Now we choose the cut-off day from 1 to 8 days situations, which may cover most
common use scenarios, to plot the results in 2-dimensions. The results are shown in
Figure 2.13 and Figure 2.14.
Figure 2.13 shows the occupation rate comparison by varying peak hours per day and
cut-off day duration using our combined treatment method. During the peak time
hours and before the cut-off day, the original FPS is set at 30. During the off-peak
time or after the cut-off day, the FPSs are all set at 1 FPS. X-axis is the peak-time
hours per day, and Y-axis is the results of the HD occupation rate in percentage
comparing with the original HD occupation space. For different settings of cut-off
34
Figure 2.13. Occupation Rate Comparing with the Original HD Occupation Space
35
Figure 2.14 illustrates the gain of recording time between the proposed
combined-treatment scheme and the existing method. Again during the peak time hours and
before the cut-off day, the original FPS is set to 30. During the off-peak time or after
the cut-off day, the FPSs are set to 1. X-axis is the peak-time hours per day, and
Y-axis shows the results, which are the gain of recording time in percentage. For
different sets of cut-off days, the results are plotted in different lines. The gains of
recording time in percentage reach several thousand. This indicates that our scheme
can help to save the HD storage space dramatically.
2.6 Summary
In this chapter we proposed several simple yet efficient video data recoding
algorithms to be used in urban surveillance systems. The main idea of our schemes is
to intelligently record the important video frames with the number of unimportant
video frames to be reduced as small as possible. Our proposed methods are very easy
to be implemented on real time urban surveillance systems with low complexity and
can efficiently save huge amount of the HDs storage space.
The simulation results demonstrated that, using our combined-treatment scheme, the
occupation rate may be as low as around 3% of original HD space. The gains of
recording time may easily reach several thousand percentages, comparing with the
same HD space recording the original video frames of 30 days period.
Since currently the urban surveillance systems sometimes only record key frames to
reduce the space of HDs, our method can combined with the key frames techniques to
36
C
HAPTER
3
B
IG
D
ATA
-D
RIVEN
F
AST
R
EDUCING THE
V
ISUAL
B
LOCK
A
RTIFACTS OF
DCT
C
OMPRESSED
I
MAGES
FOR
U
RBAN
S
URVEILLANCE
S
YSTEMS
Part of this chapter was published as a research paper below:
L. Hu, Q. Ni, “Big Data-Driven Fast Reducing the Visual Block Artifacts of DCT
Compressed Images for Urban Surveillance Systems”, International Journal of Data
37
The Urban Surveillance Systems generate huge amount of video and image data and
impose high pressure onto the recording disks. It is obvious that the research of video
is a key point of big data research areas. Since videos are composed of images, the
degree and efficiency of image compression are of great importance. Although the
DCT based JPEG standard are widely used, it encounters insurmountable problems.
For instance, image encoding deficiencies such as block artifacts have to be removed
frequently. In this chapter, we propose a new, simple but effective method to fast
reduce the visual block artifacts of DCT compressed images for urban surveillance
systems. The simulation results demonstrate that our proposed method achieves better
quality than widely used filters while consuming much less computer CPU resources.
3.1 JPEG Introduction
The widespread use of video cameras in Urban Surveillance Systems has resulted in
an enormous amount of image and video data, hence the compression of those image
and video data become more and more important in big data research areas. In the mid
80’s, the joint collaboration of International Telecommunication Union (ITU) and
International organization for Standard (ISO) introduced the standard to compress
images which is called the Joint Photographic Experts Group (JPEG) [40]. The core
codec method of JPEG is Discrete Cosine Transform (DCT). It may get high
compression ratio and it is easy to be implemented, hence the DCT based JPEG is
widely used [41]. DCT is a Fourier-related transform expresses, it sum up a sequence
of cosine functions at different frequencies.
38
𝐹(𝑘, 𝑙) = 𝑎𝑘𝑎𝑙∑ ∑ 𝑓(𝑚, 𝑛) cos
(2𝑚+1)𝑘𝜋 2𝑀 𝑁−1
𝑛=0 𝑀−1
𝑚=0 cos
(2𝑛+1)𝑙𝜋
2𝑁 (3.1)
𝑘 = 0,1,2 … 𝑀 − 1; 𝑙 = 0,1,2 … 𝑁 − 1
𝑎𝑘 = {
1
√𝑀 , 𝑘 = 0
√2
𝑀 , 1 ≤ 𝑘 ≤ 𝑀 − 1
; 𝑎𝑙 = {
1
√𝑁 , 𝑙 = 0
√2
𝑁 , 1 ≤ 𝑙 ≤ 𝑁 − 1
The two-dimension DCT transform is used in JPEG image compression. And the
block diagram of DCT based JPEG transform can be shown below:
Break down to
n*n sub-block DCT Quantizer
Symbol Encoder
Symbol
Decoder Inverse DCT
n*n Sub-block combination Input Image Reconstructed Image Compressed Image Compressed Image
Figure 3.1: the Block Diagram of DCT based JPEG Transform
In the coding process, we first break down the image to n*n sub-blocks, normally 8*8
sub-blocks are chosen. The two-dimension DCT transform is used to get 64
coefficients for every sub-block. From the two-dimension DCT transform, we can get
the 64 coefficients as follows:
From the two-dimension DCT transform, we can get the 64 coefficients as follows:
𝐹(𝑢, 𝑣) = ∑ ∑ 𝑓(𝑥, 𝑦)𝑎𝑢cos(2𝑥+1)𝑢𝜋
16 7
𝑦=0 7
𝑥=0 𝑎𝑣 cos
(2𝑦+1)𝑣𝜋
16 (3.2)
𝑢 = 0,1, … 7; 𝑣 = 0,1, … 7
𝑎𝑢 = {
1
√8 , 𝑢 = 0
√2
8 , 𝑢 > 0
; 𝑎𝑣 = {
1
√8 , 𝑣 = 0
√2
39
Although the application of the DCT formulas would require O(N2) operations, it is
possible to compute the same thing with only O(N log N) complexity. This method is
known as fast cosine transform (FCT) algorithms. In this way, by paying the cost of
more additions, we get speed faster since the CPUs are more excellent to do additions.
It makes the DCT become applicable in real image compression processes. Due to
good compression ratio, DCT get efficient memory utilization and it is widely used in
practice.
In fact, the DCT transform does not compress the images, but the quantization process
brings errors into the system. The quantization process is to divide the 64 coefficients
by the quantization matrix and round the results into integers. We know this process
will incur errors into the systems.
Let us assume the quantization matrix is Q[u,v], If the quantization errors are
expressed as e[u,v], then the quantitated coefficient matrix is:
𝐹𝑄[𝑢, 𝑣] = 𝐹[𝑢,𝑣]
𝑄[𝑢,𝑣]+ 𝑒[𝑢, 𝑣] (3.3)
In order to compress the image, some high frequency information is discarded since
human eye are not sensitive to high frequency information, but this process also incur
errors into the systems.
It is obvious that the errors will distribute inside the whole rebuilt image. Every
sub-block bring different errors since they are calculated independently, hence the
correlation between different sub-blocks are destroyed. This leads to the block
40
artifacts. Since the block artifacts effect comes from the DCT transform, it becomes
the major disadvantage of the JPEG.
In order to show the results of DCT transform, we first simulate the DCT compression
effects. We use an ‘autumn’ image to be our experiment object. Inside our code, we
use different bit rates to compress the image.
Figure 3.2 and Figure 3.3 are both run with the scheme of 8*8 sub-blocks. The
compressed images are more and more blur, and the block artifacts effect shows up
more and more severely.
Figure 3.2 shows the original image and some DCT transformed images with light
compression. Since the qualities of the compressed images are falling down little by
little, the details are shown clearly and the qualities are satisfying for our eyes. The
DCT transform appears to be very strong with light compression.
41
Figure 3.3. DCT Transform – Autumn 2
Figure 3.3 shows the DCT transformed images with lower bit rate than that of Figure
3.2. Inside this Figure, the block artifacts become more and more obvious, and it is
not easy to view the details inside the image.
3.2 Background
In order to reduce the block artifacts with minimal change of the original coding
system, many researchers have tried different methods. One common method to deal
with images is to use filters to filter the received images. Among the filters, median
filtered is a kind of non-linear filter and is considered suitable to eliminate the random
noise [42]. Median filters are widely used in digital image processing. The idea of the
median filter is to run through the signal pixel by pixel, replacing each pixel with the
42
"window". For image signals, the windows are normally chosen as 3*3 pixels boxes,
other shapes may be chosen. Another type of widely used filter is adaptive filter [43].
A common used adaptive filter is wiener filter. Wiener filter is a filter used to produce
an estimate of a desired or target random process by linear filtering of an observed
noisy process. It minimizes the mean square error between the estimated random
process and the desired process.
Other methods are used to reduce the block artifacts effect. In [44], the authors
proposed a hybrid method which acts both in the frequency and the spatial domains,
to enhance the visual result of the reconstructed image and reduce the blocking
artifacts. In [45], a semi-local approximation scheme to large-scale Gaussian
processed was proposed. This allows learning of task-specific image enhancements
from example images without reducing quality. Similar knowledge-based algorithms
also include simultaneously removed JPEG blocking artifacts and recovers skin
features [46]. On the other hand, some researchers use the property that the original
pixel levels in the same block provide continuity and the correlation between the
neighbouring blocks to reduce the discontinuity of the pixels across the boundaries
[47]. [48] Proposes to remove artificial edges with a one-time nonlinear smoothing.
But the shortcoming for all these methods is that they are very complex, which will
consume a lot of computer CPU and memory resources. Note that the Urban
Surveillance Systems accumulate huge number of images every second, it is
impossible to deal with every image with long time process. It is important to propose
very simple but effective methods to solve the block artifacts effect. The best method
should be kept at a single step after receiving the already affected image. In this way,
all the invested hardware and software may be kept and the cost will be kept low. This
43
3.3 Our Proposed Method and Results
We notice that the block artifacts bring some sharp changes between the vertical and
horizontal adjacent blocks. The situation is shown in Figure 3.4. Hence our idea is to
only deal with the sudden changes. In order to keep as much as the original image, our
proposed method is to smooth only the connection edges of the vertical and horizontal
adjacent of the blocks while keeping other parts of the image unchanged.
Figure 3.4. Vertical and horizontal adjacent blocks
Using an example of horizontal direction, our proposed method is illustrated as
follows:
First we calculate the difference between the two adjacent blocks, which can be
written as ∆=abs(x(i)-x(i-1)) , where x(i) and x(i-1) are the grey values at the right
and left of the line of the sudden change. In order to make the change smooth, we
divide the ∆ by 3. The last step is to adjust the grey values of the right and left of the
sudden change line by adding or subtracting the value by ∆/3. In this way, the sudden
change is smoothed while keeping most pixels unchanged, hence to alleviate the
block artifacts. The flow chart of our proposed method is shown in Figure 3.5 (shown
44
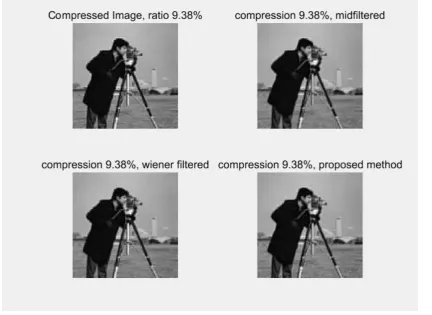
We simulate the effect of our proposed method and compare with the two kinds of
widely used filters: the median filter and wiener filter. As we already know, at those
lightly compressed images, the block artifacts are not obvious; hence we only need to
deal with the poor quality received images, which are the images with deep
compression. The results are shown in Figures 3.6, 3.7 and 3.8. Inside these figures,
the compression ratio means the size ratio of the compressed image file and the
original image file.
Begin
For every row,Search for the block boder line columns I(x), I(x-1)
I(x)>I(x-1)
end Delta=abs(I(x)-I(x-1))
I(x)=I(x)-delta/3 I(x-1)=I(x-1)+dellta/3
I(x)=I(x)+delta/3 I(x-1)=I(x-1)-delta/3
Yes No
45
Figure 3.6. The effects of different methods (compression ratio is 9.38%)
46
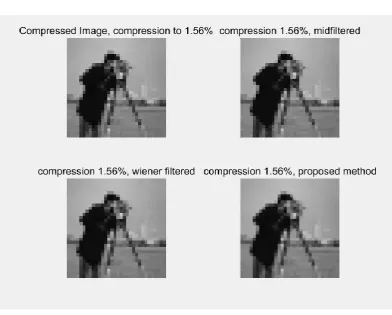
Figure 3.8. The effects of different methods (compression ratio is 1.56%)
Since it is not easy to compare the effects by our eyes, we need some actual numerical
results. Hence, we calculated the Peak Signal to Noise Ratio (PSNR) of all the
different methods. PSNR represents a measure of the peak error; it is a widely used
metric to compare image compression quality. With higher PSNR value, the quality of
an image is considered better. Here we show the PSNR results in Table 3.1.
Bit rate Unfiltered Median filtered Wiener filtered Our method
0.0938 24.9777 25.0860 25.0572 25.2193
0.0469 23.1011 23.2140 23.2074 23.3213
0.0156 20.9932 21.0514 21.1097 21.4136
Table 3.1. The PSNR of different situations (Autumn)
This table shows that, when the images are heavily compressed, the filters and our
proposed method do effect to smooth the sudden changes caused by block artifacts,
47
than these widely used filters. Our method results in higher PSNRs, which means
better qualities.
In order to test our proposed method, we simulate the effects of our proposed method
and the two kinds of widely used filters on another famous image: cameraman. The
results are shown in Figures 3.9, 3.10 and 3.11. We also calculated the PSNRs of all
[image:54.595.88.521.263.578.2]the different methods. Here we show the PSNR results in Table 3.2.
48
Figure 3.10. The effects of different methods (compression ratio is 4.69%)
[image:55.595.101.494.407.722.2]49
Bit rate Unfiltered Median filtered Wiener filtered Our method
0.0938 23.7897 23.9410 23.8822 23.9571
0.0469 21.9168 22.1191 22.0286 22.1938
0.0156 19.4785 19.5574 19.5837 19.8362
Table 3.2. The PSNR of different situations (Cameraman)
Table 3.2 again shows that our proposed method results in better quality. The main
benefit of our proposed method is that the comparably better PSNR results are gotten
with very simple calculations. Considering that normal filters need to calculate every
pixel for an M*N image while our proposed method only need to calculate the pixels
at the block borders, our method only need a small fraction of the CPU calculation
source comparing with a normal image filter.
3.4 Summary
The Urban Surveillance Systems are facing the problem of huge amount of video
data, and the compression technique is the most fundamental and important to deal
with the data. Although the DCT based JPEG standard are widely used, it encounters
problems such as block artifacts. In this chapter, in order to reduce the block artifacts,
we proposed a very simple but effective method. The simulation results show that our
proposed method results in better quality than widely used filters while consuming
much less computer CPU resources. In this way, we could reduce the visual block
50
C
HAPTER
4
I
O
T-D
RIVEN
A
UTOMATED
O
BJECT
D
ETECTION
A
LGORITHM
FOR
U
RBAN
S
URVEILLANCE
S
YSTEMS IN
S
MART
C
ITIES
Part of this chapter was published as a research paper below:
L. Hu, Q. Ni, “IoT-Driven Automated Object Detection Algorithm for Urban
Surveillance Systems in Smart Cities”, IEEE Internet of Things Journal, Volume: 5,