warwick.ac.uk/lib-publications
Original citation:
Hughes, Robert R. and Dixon, Steve M. (2018) Analysis of electrical resonance distortion for
inductive sensing applications. IEEE Sensors Journal. doi:10.1109/JSEN.2018.2841506
Permanent WRAP URL:
http://wrap.warwick.ac.uk/103258
Copyright and reuse:
The Warwick Research Archive Portal (WRAP) makes this work by researchers of the
University of Warwick available open access under the following conditions. Copyright ©
and all moral rights to the version of the paper presented here belong to the individual
author(s) and/or other copyright owners. To the extent reasonable and practicable the
material made available in WRAP has been checked for eligibility before being made
available.
Copies of full items can be used for personal research or study, educational, or not-for profit
purposes without prior permission or charge. Provided that the authors, title and full
bibliographic details are credited, a hyperlink and/or URL is given for the original metadata
page and the content is not changed in any way.
Publisher’s statement:
“© 2018 IEEE. Personal use of this material is permitted. Permission from IEEE must be
obtained for all other uses, in any current or future media, including reprinting
/republishing this material for advertising or promotional purposes, creating new collective
works, for resale or redistribution to servers or lists, or reuse of any copyrighted component
of this work in other works.”
A note on versions:
The version presented here may differ from the published version or, version of record, if
you wish to cite this item you are advised to consult the publisher’s version. Please see the
‘permanent WRAP URL’ above for details on accessing the published version and note that
access may require a subscription.
Analysis of electrical resonance distortion for
inductive sensing applications
Robert R. Hughes
∗and Steve Dixon
†∗
Department of Mechanical Engineering, CAME School, University of Bristol, Bristol, UK, BS8 1TR
†
Department of Physics and School of Engineering, University of Warwick, Coventry, UK, CV4 7AL
Abstract—Resonating inductive sensors are increasingly popular for numerous measurement techniques, not least in non-destructive testing (NDT), due to the increased sensitivity obtained at frequencies approaching electrical resonance. The highly unstable nature of resonance limits the practical application of such methods while no comprehensive understanding exists of the resonance distorting behaviour in relation to typical measurements and environmental factors. In this paper, a study into the frequency spectrum behaviour of electrical resonance is carried out exploring the effect of key factors. These factors, known to distort the electrical resonance of inductive sensors, include proximity to (or lift-off from) a material surface, and the presence of discontinuities in the material surface. Critical features of resonance are used as metrics to evaluate the behaviour of resonance with lift-off and defects. Experimental results are compared to results from a 2D finite element analysis (FEA) model that geometrically mimics the inductive sensor used in the experiments, and to results predicted by an equivalent circuit transformer model. The findings conclusively define the physical phenomenon behind measurement techniques such as near electrical resonance signal enhancement (NERSE), and show that lift-off and defect resonance distortions are unique, measurable and can be equated to exclusive variations in the induced variables in the equivalence circuit model. The resulting understanding found from this investigation is critical to the future development and understanding of a complete model of electrical resonance behaviour, integral for the design of novel sensors, techniques and inversion models.
Index Terms—Resonance, inductive sensing, eddy-current, ECT, NDT, electromagnetic testing, NERSE,
F
1
I
NTRODUCTIONE
LECTRICALresonance is a fundamental phenomenon of many applications across a wide range of technologies and applications, including radio engineering and wire-less power transfer [1]. One such application is in non-destructive testing (NDT), where inductive sensors are used to inspect industrial components for structurally compro-mising damage [2], [3]. Recent research by Hughes et al, and others, has shown that operating these inductive sensors around electrical resonance can enhance the sensivity of such techniques allowing the detection of smaller defects [4]–[10].In spite of these recent advances in resonance exploiting measurements, typical inductive sensing systems used in in-dustry historically avoid electrical resonance for theoretical simplicity and measurement stability. This is not unjustified, as electrical resonance can be easily affected by a range of factors that could interfere with these measurements. Therefore, in order to further the development of these tech-niques, a greater practical and theoretical understanding of the behaviour of electrical resonance in inductive sensing applications is required.
This paper presents experimental investigations into the electrical resonance behaviour of a typical industrial induc-tive sensor due to changes in its primary electrical compo-nents, namely; coaxial cable length, proximity of inductive coil to the surface of an electrically conducting material,
Manuscript received 5 March, 2018;
Corresponding author: R.R. Hughes (email: [email protected]).
and the presence of surface breaking discontinuities in that surface.
2
T
HEORYEddy-current testing probes require the generation of alter-nating magnetic fields to induce eddy-currents in test spec-imens. This is achieved through the use of inductive coils and the simplest form of ECT sensors use these inductive coils as both current-generator and detector by monitoring changes in the electrical impedance, Z, of the coil during inspection. This impedance will vary with the proximity and quality of specimen. Coaxial cables are commonly used to connect the excitation and monitoring system to the coil, adding additional capacitance to the system, impacting the overall impedance of the measurement. The combination of the cable and the inductive coil is referred to as the sensor hereafter.
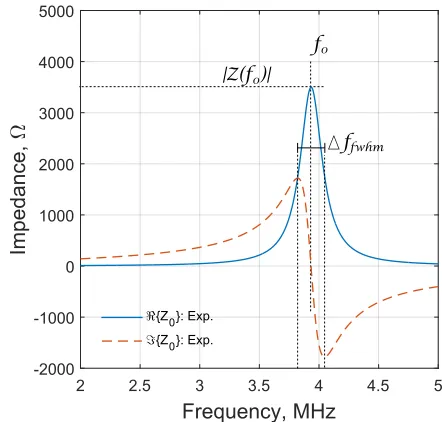
At a specific excitation frequency, called the resonant frequency, f0, the electrical impedance, Z, of the sensor
transitions from an inductive to a capacitive system. This transition, identified by a change in impedance phase, φ, from positive to negative90o, is accompanied by a peak in the magnitude of the impedance,|Z|.
Fig. 1. Equivalent transformer circuit model representing the interaction between an inductive coil probe and the surface of an electrically con-ducting material.
related to the inductive,L0, capacitive,C0and resistive,R0,
components of the equivalent circuit, and is defined as [12],
Z= R0+iωL0 1 +iωR0C0−ω2L0C0
, (1)
where ω is the angular frequency. The resonant angular frequency, ω0, is defined as the frequency at which the
imaginary component of impedance={Z} = 0, such that the phase is zero and the magnitude is completely real, and will occur when,
ω0= 2πf0= s
1
C0L0 −
R0
L0 2
, (2)
' r
1
C0L0
, (3)
whenR2
0C0L0. This condition is satisfied for the
electri-cal properties of ECT sensors.
2.1 The Transformer Model
When close to an electrically conducting material a coil will inductively couple to the surface of the material (see Figure 1). The effect of the material can be modelled as an inductor, Le, in series with an unknown impedance, Ze =Re+iXe, which will vary depending on the surface properties of the material. This coupling, parametrised by the coupling coefficient,k, will alter the effective inductance and resistance (L00 and R00 respectively) of the equivalent circuit model and will distort the impedance such that it can be found via Kirchoff’s laws to be [12],
Z= R
0
0+iωL00
1 +iωR0
0C0−ω2L00C0
. (4)
where
L00=L0
1−αk2(Xe+ωLe)
, (5)
R00 =R0+αk2ωL0Re, (6)
and,
α= ωLe
R2
e+ (Xe+ωLe)2
. (7)
Here it is assumed that the capacitance is largely unaffected by the presence of the electrically conducting material. In reality this is not necessarily true. The validity of this assumption will be commented upon within this paper.
The scalar coupling coefficient is linked to the mutual induction [13],M =k√L0Le, between the two circuits. The
coefficient therefore represents the amount of flux exchange between the 2 coils, and is as such dependent on many of
the variable parameters of the coupled system including coil geometry, lift-off and tilt. All of these factors influence the level of coupling between the primary coil and the material. As with any resonating system, even slight changes to any of these parameters can have a large effect on the amplitude of oscillation. A variation in the capacitance,C0,
material resistance,Re, and reactance,Xe, or the coefficient of electromagnetic coupling, k, between the coil and the material will result in a distortion of the electrical resonance. It is expected that this distortion can be characterised by measuring the changes in the coupled resonant frequency, ω00,
ω00= 2πf00 ' s
1
C0L00
, (8)
the peak impedance magnitude,|Z(f0)|,
|Z(f0)| '
L00
R00C0
, (9)
and the full-width half maximum, ∆ωf whm, of the real component of the impedance peak (see Appendix A for the full derivation),
∆ωf whm=ω+−ω−, (10)
where,
ω±=
s
1
L0
0C0
1−Q 2
2
1± r
1 + 4
Q2
, (11)
and the quality factor,
Q=R00
r
C0
L00. (12)
[image:3.612.309.565.309.422.2]These measurable features of the resonating impedance profile (see Figure 2) can be used to infer the behaviour of the equivalent circuit components of the system.
[image:3.612.325.546.483.694.2]In order to exploit the sensitivity enhancing effects of electrical resonance in reliable inductive sensing technol-ogy, a full empirical and theoretical understanding of the behaviour of electrical resonance is required. In this com-munication, studies are presented exploring the behaviour of electrical resonance of a typical industrial eddy-current testing (ECT) probe due to the most significant contributors to resonance shifting phenomenon; coil lift-off (coupling-coefficient) and material discontinuities (effective induc-tance,L00, and resistance,R00).
3
E
XPERIMENTALM
ETHODTwo studies were carried out exploring the behaviour of the electrical resonance of an induction probe due to changes in the coils environment. The first study investigated the effect of changing the coupling-coefficient on electrical res-onance by varying the probe lift-off from the surface of a non-ferromagnetic aerospace superalloy, Titanium 6Al-4V (Ti6-4). The second study investigated the effect of surface discontinuities in Ti6-4. The experimental data are compared to results from a 2D finite element analysis (FEA) model of the experimental set-up and to predicted equivalent cir-cuit behaviour. Ti6-4 was selected due to its low electrical conductivity which traditionally limits the sensitivity of ECT inspections. As such, resonance effects observed in Ti6-4 represent a worst-case-scenario for non-ferromagnetic materials, such that these effects will be amplified for other, more conducting, materials.
An Agilent A4294A impedance analyser was used to measure the complex sensor impedance as a function of frequency for experimental measurements. Each spectra was made up of 801 samples between 1-5MHz.
3.1 Measurement Coil
A single coil GE (Coventry, UK) ECT pen probe (Part No. 379-012-060) of measured inductance, L0 = 10.3±0.1µH
was used to investigate how some of the typical contributors to ECT signals affect the electrical resonance of the system. The physical and electrical properties of the probe coil and cable are shown in Tables 3 & 4 (see Appendix B) and a cross-sectional X-ray CT image is shown in Figure 4. The probe was operated using a 1.54±0.02 m long RG174,
50Ωcoaxial cable of total capacitance C = 155.5 pF m−1.
This was long enough to minimise any potential resonance instabilities that may exist in shorter coaxial cable lengths.
In air, the electrical resonance of the probe occurs at frequencyf0= 3.93±0.01M Hz. The properties of electrical
resonance for these two probe environments are compared in Table 1. The resonant frequencies were calculated via the zero crossing point of the impedance phase for each case.
For the case of the probe in proximity of a non-ferromagnetic material, such as Ti6-4, the impedance maxi-mum at resonance decreases with proximity to the material surface and the resonance frequency shifts to higher fre-quencies. This is analogous to a reduction in the inductance and an increase in the resistance of the system, as predicted by equations 5 & 6.
Two studies were carried out on the behaviour of the probes electrical resonance in the presence of Ti6-4: The effect of lift-off from the material surface and, the effect of discontinuities at the material surface.
TABLE 1
Key properties of electrical resonance for the system in air, and positioned at zero lift-off on the surface of undamaged Ti6-4.
f0 |Z0(f0)| ∆ff whm
(±0.01MHz) (±0.01kΩ) (±0.01MHz)
Air 3.93 3.50 0.36
Ti 6-4 4.17 1.97 0.60
3.2 Lift-off Characterisation
The impedance frequency spectrum,Z(f), of the ECT probe was measured as a function of lift-off from the surface of undamaged Ti6-4.
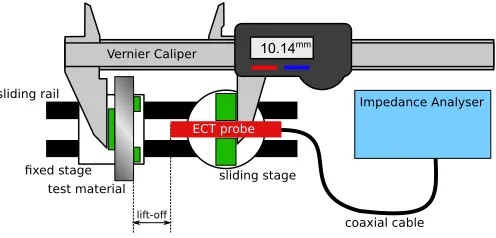
The ECT probe was fixed onto a sliding stage with the probe orientated parallel to the sliding rail. The test sample was positioned on a stage and locked in place facing the probe head. This limited the relative probe tilt angle of the probe normal to the surface to0±1o
.
A digital Vernier Caliper was used to measure the lift-off separation between the probe head and the material surface. The two arms of the caliper were fixed to the two stages and the digital reader was zeroed when the probe tip and material surface were brought into contact. An initial measurement was made with the probe in contact with the material surface (true zero lift-off). A protective tape layer (of thickness ≈0.1 mm) was then applied to the tip of the probe and another impedance spectrum measure-ment made for the taped probe in contact with the ma-terial. This measurement replicates typical industrial ECT arrangements and will be referred to as industrial zero lift-off, fT i,i0, until stated otherwise. Impedance spectra were
recorded over a range of distances from the surface, with each distance recorded. Figure 3 shows a schematic diagram of the experimental setup.
3.3 Material Discontinuities
Three large electrical discharge machined (EDM) calibration slots in a Ti6-4 specimen were inspected to investigate the effects of resonance-shifts on discontinuity signals. The slots spanned the width of the test sample, had equal gaps of 0.5 mm, and depths of 0.20, 0.50 and 1.00 mm. These ma-chined discontinuities are not representative of real material cracks but are a useful starting point for investigating the behaviour of resonance in the presence of discontinuities.
Circular disc discontinuities were simulated in the 2D-FEA model with varying depth and radius (see Figure 4)
Impedance Analyser Vernier Caliper
10.14mm Vernier Caliper
sliding stage sliding rail
fixed stage test material
lift-off
coaxial cable
[image:4.612.315.563.604.723.2]ECT probe
Fig. 4. (Left) X-ray computed tomography (CT) cross-sectional image of the induction probe coil around a ferrite core and surrounded by a ferrite shield - Core radiusrin = 0.51±0.01mm, coil outer radiusrout = 1.10±0.01mm, coil heighth = 0.84±0.01mm, intrinsic lift-offl0 = 0.59±0.01mmand coil thicknessτc= 0.52±0.01mm. (Right) 2D axially symmetric finite element analysis (FEA) model geometry mimicking the actual coil geometry and showing the geometry of a simple material hole feature beneath.
and compared to experimental data. Two discontinuity studies were simulated; the effect of increasing hole radius (rdef = 0.1−1mm) with fixed depth (ddef = 0.25mm) and the effect of hole depth (ddef = 0.01−3mm) with fixed radius (rdef = 0.6mm). The lift-off,l, from the surface was set to 0.15 mm.
3.4 2D FEA Modelling
A 2D finite element analysis (FEA) model was developed in COMSOL 5.3 to simulate the frequency spectra of the induction probe above materials. The geometric properties of the measurement coil were measured from the cross-sectional CT image and used to replicate the coil virtually, as shown in Figure 4.
Due to the unknown grade of Ferrite used for the core and shield, a relative permeability of µr = 800 was as-signed. This value, selected based on a coarse parametric optimisation, is consistent with typical permeabilities of RF ferrite cores and, when combined with the known sensor parameters (see Appendix B), produced resonance peaks comparable to experimental results. An evaluation of the imaginary component of µr was also performed and pro-duced negligible impact on the resonance behaviour and soµrwas assumed to real within the range of frequencies concerned. A thorough parametric optimisation would be required to definitively evaluate the optimum value ofµr for the FEA model to more accurately represent experimen-tal results. However, an approximateµrvalue was deemed satisfactory because this investigation is concerned only with the relative behaviour of electrical resonance and not the accurate matching of FEA to experimental results.
The FEA model of the coil was connected to an equiva-lent circuit representing the lumped capacitive (155.5pF), resistive (3.6 pΩ) and inductive (348.0 nH) components of the rest of the coaxial cable. The values of the FEA circuit were calculated from the values shown in Table 4 (Appendix B) multiplied by the cable length.
4
R
ESULTS& D
ISCUSSION4.1 Lift-off Characterisation
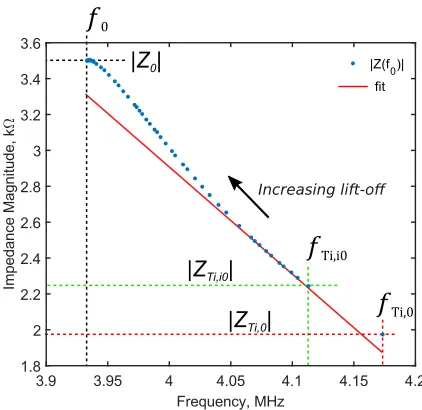
The resonant frequency and peak impedance magnitude of the probe on Ti6-4 at true zero lift-off are referred to asfT i,0
and|ZT i,0|respectively. The same values for industrial zero
lift-off are referred to asfT i,i0and|ZT i,i0|respectively.
Figure 5 shows the relationship between experimentally measured impedance peak and resonant frequency identify-ing the direction of lift-off and the features of the system; in air, at true zero lift-off, and industrial zero lift-off. At a small lift-off from the surface (0.0-0.25 mm) the change in resonant frequency and impedance peak are approximately linear, as shown by the best fit in Figure 5. The parameters of the lin-ear fit, of the form|Z0|=a1f0+a2, area1=−5.9±0.2kΩs
anda2= 26.7±0.7kΩ. The fit is in excellent agreement for
small lift-off distances, with a root mean squared error of σrms= 0.004kΩ.
It can be seen in Figure 5 that there is a significant shift in the resonance between the industrial zero (≈0.1 mm) and true zero lift-off positions. It is likely this is due to a combi-nation of the sensor experiencing additional stray parasitic capacitance between the coil and the surface, as well as the magnetic circuit being completed by the contact of the ferrite core with the surface, thus minimising stray mag-netic flux between the surface and the coil. As such there will be greater magnetic coupling to the sample causing a significant jump in the resistive and reactive components. Further work and finite element modelling is required to fully characterise and understand this behaviour, however this was outside the scope of this paper.
In order to properly represent industrial ECT measure-ments, a layer of KaptonR tape (DuPontTM, Delaware, US) is
used on the tip of the measurement probe for all subsequent investigations. As such, industrial zero lift-off will now be more simply referred to as zero lift-off. The next section explores the resonance behaviour in the presence of artificial material discontinuities.
Increasing lift-off
|Z
0|
|Z
Ti,i0|
𝑓
0𝑓
Ti,i0|Z
Ti,0|
[image:5.612.61.284.42.153.2]𝑓
Ti,0 [image:5.612.331.542.478.683.2]Fig. 6. Difference in the impedance frequency spectrum of the ECT probe above 3 long slots of varying depth in the same material: 0.20 mm deep (dotted blue), 0.50 mm deep (dashed red), and 1.00 mm deep (solid yellow). Showing the change in impedance magnitude (left) and impedance phase (right).
4.2 Material Discontinuities
The effect of discontinuities in the test material on resonance was investigated by positioning the inductive sensor above long, wire-cut slots and measuring the impedance frequency spectra.
4.2.1 Defining NERSE
Frequencies around the electrical resonance exhibit the greatest impedance changes, relative to the undamaged Ti6-4 impedance. This is more clearly observed once the back-ground impedance of the undamaged Ti6-4 is subtracted from the impedance measurements of the probe above the slots (Figure 6). Figure 6 shows the background subtracted frequency spectra for the magnitude and phase of the com-plex impedance. It is clear from the results that the signal intensity from a discontinuity is greater at frequencies close to electrical resonance compared to standard operational frequencies (1-3 MHz).
The resonance shifting phenomenon results in a signal enhancement within a band of frequencies either side of the resonant frequency, for impedance magnitude (|Z|), and around electrical resonance, for impedance phase (φ). The magnitude of the measurement signal enhancement effect will be dependent on the resonance frequency shift and magnitude distortion of the system andnot on the rate of change of the impedance spectra as previously proposed by Hughes et.al. [4]. This is an important distinction to make for the effective design and operation of novel near electrical resonance signal enhancement (NERSE) sensors that can intelligently exploit the resonance distortion phenomena.
4.2.2 Distortion of resonance features
The results are compared to data from the 2D-FEA model where circular hole defects of varying radius and depth are simulated directly beneath the coil (see Figure 4).
The discontinuities in the Ti6-4 cause a change in the equivalent components of the effective circuit model for the ECT probe system (see section 2.1). This results in a shift in f0, a change in |Z(f0)| and∆ff whm of the impedance. The key features of resonance for each of the experimental impedance spectra are summarised in Table 2 and the path of the resonance peak due to discontinuities displayed in Figure 7 relative to the path due to lift-off from section 3.2.
[image:6.612.54.294.46.149.2]Fig. 7. Experimental impedance peak magnitude vs resonant frequency as a function of discontinuity depth in Ti6-4. Plot shows the linear path of the impedance peak due to small lift-off distances (red dotted) and indicates the probe resonance peak at industrial zero lift-off.
TABLE 2
Key properties of electrical resonance for the system in air, and positioned at zero lift-off on the surface of undamaged Ti6-4.
f0 |Z(f0)| ∆ff whm
(±0.01M Hz) (±0.01kΩ) (±0.01, M Hz.)
0.0 mm 4.12 2.23 0.54
0.2 mm 4.10 2.25 0.54
0.5 mm 4.08 2.26 0.53
1.0 mm 4.07 2.26 0.53
Figure 7 demonstrates that material discontinuities pro-duce different resonance behaviour to lift-off, thereby mak-ing it possible to differentiate between these two indica-tions. This is commonly seen at frequencies below electrical resonance, but has yet to be demonstrated with respect to resonance measurements. The discontinuities measured here, cause traceable downward shifts inf0 of impedance
whilst exhibiting only small changes in |Z(f0)| and
main-taining approximately the same∆ff whm(see Table 2). This indicates that the effective inductance component of the equivalence circuit model,L00, increases, implying a
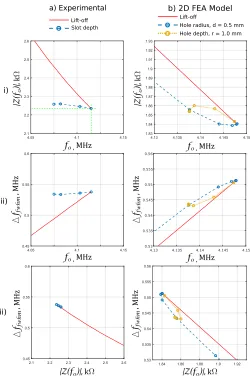
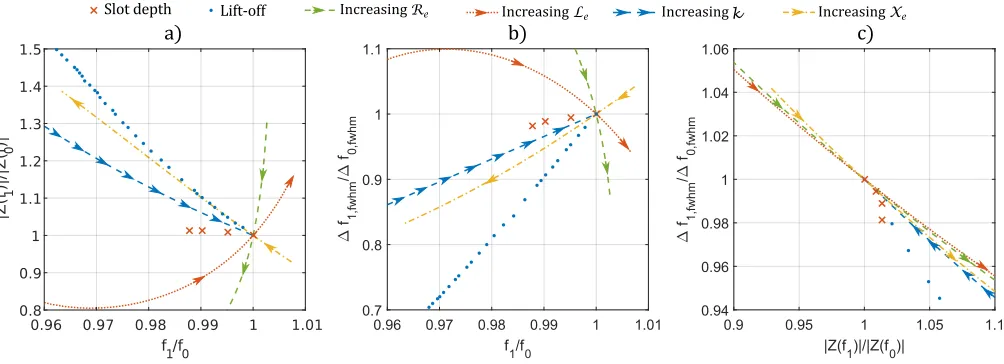
[image:6.612.329.545.524.583.2]Fig. 8. Relationships between a) resonant frequency,f0, b) the impedance peak,|Z(f0)|, and the c) full width at half maximum,∆ff whm, showing normalised experimental results with respect to circuit model predicted distortions resulting from independently increasing (in arrowed directions) secondary-circuit variables (k,Re,XeandLe).
Xe+ωLe, (equation 5). Conversely, the effective resistance component, R00, is largely unaffected hence implying that the presence of discontinuities has minimal affect onRe.
Although the circular 2D axially symmetric discontinu-ities within the FEA simulation do not accurately mimic the experimental discontinuities, it can be seen from Figure 7 that the model predicts the same separable behaviour be-tween lift-off and surface discontinuities as shown in the experiment.
4.2.3 Resonance relationship to induced circuit variables
The resonance features of experimental lift-off and defect measurements (f1,|Z(f1)|and∆f1,f whm) were normalised
to the values for the sensor coupled to an undamaged material (defined asf0,|Z(f0)| and∆f0,f whm in Figure 8) and compared to predicted results, using equations 8- 12, for changes due to independent variations in the induced circuit components (k,Re,XeandLe). The results, shown in Figure 8, demonstrate the relationships between these variables and the resonance features and indicate how the circuit variables change in lift-off and defect measurements. The normalised experimental results in Figure 8 can be qualitatively interpreted with respect to the circuit model predicted changes as a result of independent variations in the induced circuit variables. By considering the induced circuit variables as new axes, vector functions of these variables can be evaluated for describing the variation in lift-off and defect measurements with respect to each of the 3 resonance metrics,f0,|Z(f0)|and∆ff whm, in Figure 8. By
considering all metrics, unique relationships are exposed. First, lift-off is examined. Here, it is known that the coupling coefficient will decrease with lift-off but, it is clear from Figure 8 that this cannot alone explain the experimen-tal lift-off measurements. Although, highly aligned withXe at small lift-off distances in Figure 8.a, the same cannot be said with respect to the ∆ff whm metric in Figure 8.b. As such, different combinations of the circuit variables must be considered to fully describe the lift-off. By observation again, it was be seen that decreasing Re does not explain lift-off in both Figure 8.a & b. Instead the only other variable
that can explain all metrics in both Figure 8.a & b for lift-off measurements is an increase inLe. This does not imply that Xe andRe do not vary with lift-off, it simply implies that an increasingLewill dominate. This is an interesting obser-vation that could be explained by an increase in the induced current footprint beneath the coil due to the geometric shape of the sensors magnetic field. An increase in the radius,r, of the induced current results in an increase in the inductance as defined by the analogous equation for coil inductance,
L'µN2πr2/h, (13)
whereNis the number of coil turns andhis the coil height. The defect measurement results can be examined in a similar way. Here it is assumed that the coupling coefficient kremains constant and that only the induced circuit compo-nents vary in the presence of a defect. Equally, it is observed that defect measurements distort the resonance metrics per-pendicular to the Re axis. As such we can assume that resistance is largely unchanged in the presence of defects. Instead, the defect distortion of resonance can be predomi-nately described through a combination of an increasingXe and a decreasingLe. The physical implications of this are that defects predominately distort the quality of induced magnetic field generated (directly related to the inductance, Le, decrease) and contribute an additional phase delay in the coupling interaction (related to an increase in the reactive component,Xe) due to the change in current path.
While this qualitative analysis is a useful exercise for inferring the dominance of induced circuit variables on the electrical resonance of a sensor, a complete understanding of resonance behaviour is required to fully model reso-nance measurements. This can only be achieved through a thorough investigation into coil design and the multi-dimensional optimization of the equivalent circuit model.
5
C
ONCLUSIONof the system at frequencies near electrical-resonance (NER) when the system encounters any disturbance i.e. changes in lift-off from a sample, or material discontinuities. This effect was previously proposed to be proportional to the rate of change of impedance but is shown herein to be directly related to the resonance shifting behaviour. This observation is critical to the successful design of resonance exploiting measurement sensors and techniques such as near electrical resonance signal enhancement (NERSE).
Material discontinuities were shown to cause the elec-trical resonance of an induction coil to distort in a manner that is unique from the distortions observed for lift-off. This finding, validated using 2D-FEA simulations modelling the geometry of a sophisticated coil sensor, will be fundamental in the successful signal analysis and inversion of resonance measurements.
An equivalent circuit analogue was employed to anal-yse the resonance behaviour of experimental lift-off and discontinuity measurements. The results were qualitatively evaluated to determine the dominant variables in the equiv-alent circuit model that could produce distortions consistent with lift-off or defect measurements. It was shown through observation that the resonance behaviour of a sensor is dom-inated by the coupling coefficient (for lift-off variations), the induced current inductance (for both lift-off and defect depth variations) and the material reactance (for defect depth variations). The induced current inductance increases with increasing lift-off and decreases with increasing defect depth, whereas the material reactance is relatively constant with increasing lift-off and increases with increasing defect depth. A more comprehensive study is required to further develop a model of resonance behaviour for these measure-ments. This will be the subject of subsequent investigations. The finding’s herein are fundamental for the successful development of novel high sensitivity resonance measure-ment sensors and techniques, as well as for developing critical inversion and forward models for measurement characterisation.
A
CKNOWLEDGMENTThe authors would like to thank the engineering and physical sciences research council (EPSRC) [grant number EP/F017332/1], Rolls-Royce plc. and the research centre for non-destructive evaluation (RCNDE) for supporting and funding the research detailed herein. All the data necessary to draw the above conclusions can be found in the figures and tables provided.
A
PPENDIXA
D
ERIVATION OF FULL WIDTH HALF MAXIMUMTo derive an expression for the full-width half maximum,
∆ff whm, the real component of the impedance, Z, from equation 4 is equated to half the maximum impedance (see equation 9),
R00
(1−ω2L0
0C0)2+ω2R20C02
= 1 2
L00
R00C00, (14)
and rearranged to give the quadratic expression,
L002C02ω4+ 2L00C0
1
2Q
2
−1
ω2+ 1−2Q2= 0, (15)
whereQis the quality-factor and is defined in equation 12. The resulting solutions to equation 15 provide expressions for the upper and lower bounds of the FWHM,
ω±=
s
1
L0
0C0
1−Q 2
2
1± r
1 + 4
Q2
. (16)
A
PPENDIXB
P
HYSICALP
ROPERTIESB.1 Coil Parameters
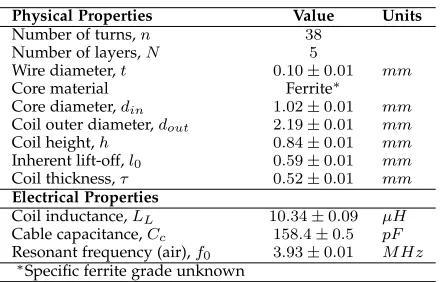
[image:8.612.328.548.243.384.2]The geometric and electrical properties of the inductive sensor used in this study are detailed in the table below.
TABLE 3
Physical and electrical properties of eddy-current probe used to measure inductive resonance shifting phenomenon,ZL.
Physical Properties Value Units
Number of turns,n 38
Number of layers,N 5
Wire diameter,t 0.10±0.01 mm
Core material Ferrite∗
Core diameter,din 1.02±0.01 mm
Coil outer diameter,dout 2.19±0.01 mm
Coil height,h 0.84±0.01 mm
Inherent lift-off,l0 0.59±0.01 mm
Coil thickness,τ 0.52±0.01 mm
Electrical Properties
Coil inductance,LL 10.34±0.09 µH
Cable capacitance,Cc 158.4±0.5 pF
Resonant frequency (air),f0 3.93±0.01 M Hz
∗
Specific ferrite grade unknown
B.2 Cable Parameters
The geometric and electrical properties of the coaxial cable used in this study are detailed in the table below.
TABLE 4
Physical properties of RG174,50Ωcoaxial cable, RS Part 6655855 -RG174 A/U PVC [14].
Property Value Units
Unit Capacitance (C/h) 101±5 pF.m−1
Conductor Conductivity1,σ 23.2 M S.m−1
Core Diameter,a 0.49±0.01mm
Shield Diameter,b 1.52±0.08mm
Dielectric constant2, 2.3
0= 20.36 pF.m−1
Dielectric Permeability2,µ ≈µ
0= 1.257 µH.m−1
Calculated Properties
Predicted Unit Capacitance,C/h 113±1 pF.m−1
Predicted Unit Inductance,L/h 226±3 nH.m−1
Predicted Unit Resistance,R/h δ1
s37.0±0.3 nΩ.m
−1
1Copper clad steel [15] 2Solid Polyethylene [15]
R
EFERENCES[1] X. Wei, Z. Wang, and H. Dai, “A critical review of wireless
power transfer via strongly coupled magnetic resonances,”
En-ergies, vol. 7, no. 7, pp. 4316–4341, 2014.
[2] G. Almeida, J. Gonzalez, L. Rosado, P. Vilaa, and T. G.
Santos, “Advances in {NDT} and materials characterization
by eddy currents,” Procedia {CIRP}, vol. 7, pp. 359 –
364, 2013, forty Sixth {CIRP} Conference on Manufacturing
[3] J. Garc´ıa-Mart´ın, J. G ´omez-Gil, and E. V´azquez-S´anchez,
“Non-destructive techniques based on eddy current testing,” Sensors,
vol. 11, no. 3, pp. 2525–2565, 2011. [Online]. Available: http://www.mdpi.com/1424-8220/11/3/2525
[4] R. Hughes, Y. Fan, and S. Dixon, “Near electrical resonance signal
enhancement (nerse) in eddy-current crack detection,”NDT & E International, vol. 66, no. 0, pp. 82–89, 2014.
[5] V. P. Bui, C. Lane, Y. Zhong, Y. L. Hor, and C. E. Png,
“Model-assisted ndt for sub-mm surface-breaking crack detection in
al-loys,” in2017 XXXIInd General Assembly and Scientific Symposium
of the International Union of Radio Science (URSI GASS), Aug 2017, pp. 1–4.
[6] R. T. Ko, M. P. Blodgett, S. Sathish, and T. R. Boehnlein, “Resonant frequency eddy current liftoff measurements for shot peening intensity assessment in materials (preprint),” DTIC Document, Report, 2007.
[7] C. Xiu, L. Ren, and H. Li, “Investigation on eddy current sensor
in tension measurement at a resonant frequency,”Applied Sciences, vol. 7, no. 6, p. 538, 2017.
[8] C. Y. Liu and Y. G. Dong, “Resonant coupling of a passive
inductance-capacitance-resistor loop in coil-based sensing sys-tems,”Ieee Sensors Journal, vol. 12, no. 12, pp. 3417–3423, 2012.
[9] X. Xu, H. Ji, J. Qiu, J. Cheng, Y. Wu, and T. Takagi,
“Inter-laminar contact resistivity and its influence on eddy currents in carbon fiber reinforced polymer laminates,”NDT & E International, vol. 94, pp. 79–91, 2018.
[10] Z. Liu, L. Zhu, S. Ren, A. Koffman, B. Waltrip, and Y. Wang, “Electromagnetic rail inspection using ac bridge measurements,” inPrecision Electromagnetic Measurements (CPEM), 2012 Conference on, July 2012, pp. 724–725.
[11] J. Blitz,Electrical and magnetic methods of non-destructive testing,, ser. Non-Destructive Evaluation Series. Chapman & Hall, 1997. [12] R. R. Hughes, “High-sensitivity eddy-current testing technology
for defect detection in aerospace superalloys,” Ph.D. dissertation, University of Warwick, 2015.
[13] D. Griffiths,Introduction to Electrodynamics. Cambridge University Press, 2017, no. v. 2. [Online]. Available: https://books.google.co. uk/books?id=ndAoDwAAQBAJ
[14] “RS components part 6655855 ˆa rg174 A/u PVc,
manufacturer details, retrieved (17/09/15),” Online, 2015. [Online]. Available: http://docs-europe.electrocomponents.com/ webdocs/141f/0900766b8141f0ac.pdf
[15] G. Kaye and T. Laby, Tables of Physical and Chemical Constants.
Longman, 1995. [Online]. Available: https://books.google.co.uk/