For Peer Review
Extrapolation of efficacy and other data to support the development of new medicines for children: a systematic
review of methods
Journal: Statistical Methods in Medical Research
Manuscript ID SMM-15-0132.R2
Manuscript Type: Review Article
Keywords: Adult, Bayesian, Bridging study, Commensurability, Extrapolation, Paediatric, Prior distribution, Random-effects meta-analysis
Abstract:
Objective: When developing new medicines for children, the potential to extrapolate from adult data to reduce the experimental burden in children is well recognised. However, significant assumptions about the similarity of adults and children are needed for extrapolations to be biologically
plausible. We reviewed the literature to identify statistical methods that could be used to optimise extrapolations in paediatric drug development programmes.
Methods: Web of Science was used to identify papers proposing methods relevant for using data from a `source population' to support inferences for a `target population'. Four key areas of methods development were targeted: paediatric clinical trials; trials extrapolating efficacy across ethnic groups or geographic regions; the use of historical data in contemporary clinical trials; and using short-term endpoints to support inferences about long-term outcomes.
Results: Searches identified 626 papers of which 52 met our inclusion criteria. From these we identified 102 methods comprising 58 Bayesian and 44 frequentist approaches. Most Bayesian methods (n=54) sought to use existing data in the source population to create an informative prior distribution for a future clinical trial. Of these, 46 allowed the source data to be down-weighted to account for potential differences between
populations. Bayesian and frequentist versions of methods were found for assessing whether key parameters of source and target populations are commensurate (n=34). Fourteen frequentist methods synthesised data from different populations using a joint model or a weighted
test statistic.
For Peer Review
commensurability of parameters may be used to determine whether it is appropriate to pool data across age groups to estimate treatment effects.
4
For Peer Review
Extrapolation of efficacy and other data to support
the development of new medicines for children: a
systematic review of methods
Ian Wadsworth
†∗, Lisa V. Hampson
†, Thomas Jaki
† † Department of Mathematics & Statistics, Fylde College,Lancaster University, Lancaster, LA1 4YF, UK
* Corresponding author: E-mail: [email protected].
Abstract
Objective: When developing new medicines for children, the potential to ex-trapolate from adult data to reduce the experimental burden in children is well recognised. However, significant assumptions about the similarity of adults and children are needed for extrapolations to be biologically plausible. We reviewed the literature to identify statistical methods that could be used to optimise ex-trapolations in paediatric drug development programmes.
Methods: Web of Science was used to identify papers proposing methods rele-vant for using data from a ‘source population’ to support inferences for a ‘target population’. Four key areas of methods development were targeted: paediatric clinical trials; trials extrapolating efficacy across ethnic groups or geographic re-gions; the use of historical data in contemporary clinical trials; and using short-term endpoints to support inferences about long-short-term outcomes.
Results: Searches identified 626 papers of which 52 met our inclusion criteria. From these we identified 102 methods comprising 58 Bayesian and 44 frequen-tist approaches. Most Bayesian methods (n=54) sought to use existing data in the source population to create an informative prior distribution for a future clinical trial. Of these, 46 allowed the source data to be down-weighted to ac-count for potential differences between populations. Bayesian and frequentist versions of methods were found for assessing whether key parameters of source and target populations are commensurate (n=34). Fourteen frequentist methods synthesised data from different populations using a joint model or a weighted test statistic.
Conclusions: Several methods were identified as potentially applicable to pae-diatric drug development. Methods which can accommodate a heterogeneous target population and which allow data from a source population to be down-weighted are preferred. Methods assessing the commensurability of parameters may be used to determine whether it is appropriate to pool data across age groups to estimate treatment effects.
For Peer Review
Keywords: Adult; Bayesian; Bridging study; Commensurability; Extrapolation; Pae-diatric; Prior distribution; Random-effects meta-analysis
For Peer Review
1
Introduction
Extrapolation has been defined as extending data and conclusions available from studies conducted in a ‘source population’ to make or support inferences for a ‘target popula-tion’ [1]. Extrapolating from existing data, also commonly referred to as bridging or borrowing strength, is common in drug development. Examples include incorporating historical data into the analysis of contemporary clinical trials [2–4] and, more contro-versially, using information on a drug’s short-term effect to draw conclusions about its long-term effect [5]. Alternatively, one may seek to test the efficacy of a medicine in a new geographic region when data are available confirming it is beneficial for patients from another locality. In such cases, it may suffice to conduct a smaller ‘bridging’ study in the new region that will collect efficacy and safety data to support the extrapolation of data from other localities to this site [6].
For extrapolations to be appropriate, source and target populations should be similar in terms of the key parameter(s) of interest. Extrapolations are ‘complete’, in the sense that existing data obviate the need to collect data from the target population, when there is strong prior opinion that differences between populations are small. Such opin-ion may be informed by pre-clinical work or experiences of developing related drugs or treating related patient groups. When there is greater uncertainty about the biological plausibility of similarities, ‘partial’ extrapolations may be more acceptable. A partial strategy would stipulate that existing data in the source population be complemented by supportive data in the target population generated by a reduced drug development programme. This reduced programme would be targeted to fill in gaps in existing knowledge or to verify similarities about which there is most uncertainty. To illustrate how an extrapolation strategy might be selected, suppose that data from the standard of care arm of several historical trials are available to inform the design and analysis of a new study. If investigators are confident that the standard of care has changed little over time and response rates have been stable, the historical data may be used as the control arm of the new (single-arm) trial. Otherwise, the historical data may be used to augment data from the new study, which would be designed as a randomised controlled trial (RCT) but would allocate fewer patients to control. Making full use of existing data can have important implications for the efficiency and feasibility of drug development in difficult to study populations such as rare diseases or groups where there are ethical and practical barriers to trial recruitment.
The use of extrapolation to facilitate the development of safe and effective medicines for children has received much attention [7–10]. Adult data are often available at the time development of a new medicine begins in children. Moreover, trials in children can be more challenging to conduct due to practical constraints on available sample sizes and pharmacokinetic sampling [11]. There is also a common perception that recruitment into paediatric trials will be challenging, although this has been contradicted by recent research finding that parents and practitioners are willing to enter children into trials 4
For Peer Review
[12]. Dunne et al. [7] discuss the paediatric study decision tree [8, 10] shown in Figure 1, which is an algorithmic approach to determining which additional data are needed in children to support paediatric licensing decisions. The level of extrapolation is de-termined by whether adults and children can be assumed to be similar in terms of key characteristics, such as disease progression and the pharmacokinetic-pharmacodynamic (PK-PD) relationship of the drug. While this framework clearly identifies scenarios in which different extrapolation strategies are appropriate, it neither accommodates uncertainty about extrapolation assumptions nor allows for differences between age groups of children. To capture the heterogeneity of growth, development and phar-macokinetics in the population, the ICH E11 guideline [10] suggests one possible age grouping: preterm newborn infants, term newborn infants (0 to 27 days), infants and toddlers (28 days to 23 months), children (2 to 11 years) and adolescents (12 to 16/18 years, dependent on region). Batchelor and Marriott [13] state that there may be age related changes in drug pharmacokinetics caused by anatomical and physiologi-cal differences between younger and older children and adults. However, Stephenson [14] notes that adults’ and children’s responses to many drugs have much in common. The European Medicines Agency (EMA) [1] has proposed a general framework for extrapolation allowing for the incorporation of uncertainty about assumptions. This framework stipulates that an extrapolation concept, containing explicit hypotheses on expected differences between populations, should inform the development of an extrap-olation plan. This plan will detail which additional data will be generated in the target population, and these data should, in turn, be used to verify the extrapolation concept.
This paper describes the findings of a systematic review conducted to identify statistical methods that can be used to optimise extrapolations in paediatric drug development. We sought methods relevant for using data from a source population to support infer-ences for a target population. To provide focus for the literature search, we restricted our attention to publications developing methods in the context of four applications in which extrapolations are common, namely, paediatric clinical trials; trials extrapolating efficacy across ethnic groups or geographic regions; the use of historical data in con-temporary clinical trials; the use of short-term endpoints to support inferences about long-term outcomes. The rest of the paper proceeds as follows. Section 2 outlines the strategy used to identify relevant papers and methods which are briefly summarised in Section 3. In Section 4, we give a detailed account of the methods found, grouped ac-cording to four common approaches. We conclude in Section 5 with a discussion of the suitability of these methods for making extrapolations in paediatric drug development.
2
Methods
Articles were identified by searching the Science Citation Index Expanded (SCI- EX-PANDED) database of the Web of Science. Searches were restricted to English lan-guage papers listed on Web of Science prior to 31st January 2014 in the following cat-4
For Peer Review
Figure 1: Paediatric Study Decision Tree: Image reproduced from [8]
egories: biology; mathematical and computational biology; mathematics (applied, in-terdisciplinary applications); medical informatics; research and experimental medicine; pediatrics; and statistics and probability. Preliminary searches were also made of other databases (JSTOR, PubMed) but no additional relevant articles were found. Separate searches of the SCI-EXPANDED database were made to identify potentially relevant papers proposing statistical methods for: a) incorporating historical data into contem-porary clinical trials; b) using data on short-term endpoints to support inferences on long-term outcomes; c) paediatric clinical trials; and d) bridging clinical trials. Since there was considerable overlap between the search terms needed to identify papers on the last two topics, these were combined so that a total of three separate searches were made. Search terms can be found in the web based materials accompanying this manuscript (Supplementary Appendix A). We searched for papers containing these search terms either in the title, abstract or keywords.
Articles identified using this search strategy were then screened, first by title and then by abstract. At each stage the following types of manuscripts were excluded: a) confer-ence proceedings; b) reports of clinical trials; c) reports of meta-analyses or evidconfer-ence synthesis analyses; and d) papers unrelated to medical statistics (returned because one search term, ‘bridge’, occurs in many contexts). A full text review of the remain-ing articles was then performed. At this stage manuscripts were excluded if they did not consider statistical methods; if they used source population data only to inform 4
For Peer Review
the design of a future trial; or if they considered trials using a historical control arm without consideration of possible differences between populations. From each paper we extracted details of all statistical methods relevant for extrapolating data from a source population to support inferences for a target population. Methods for estab-lishing whether data from source and target populations are consistent were regarded as relevant, assuming that if commensurability is established it would be appropriate to analyse data pooled across populations. A data extraction form (Supplementary Appendix B) was completed for each statistical method and the number of methods extracted from each paper was recorded. When identical methods were found in more than one paper, we recorded the method as it appeared in the earliest publication. Papers presenting only duplicate methods were excluded from the review. Data were extracted by one author (IW) seeking guidance from others (LVH, TJ) where necessary.
3
Results
Searches identified 52 papers satisfying the stated inclusion/exclusion criteria as sum-marised in Figure 2, from which we extracted 102 methods. A single method was extracted from each of 34 papers. Of the remaining papers, eight presented two meth-ods each, while 10 presented three or more methmeth-ods each.
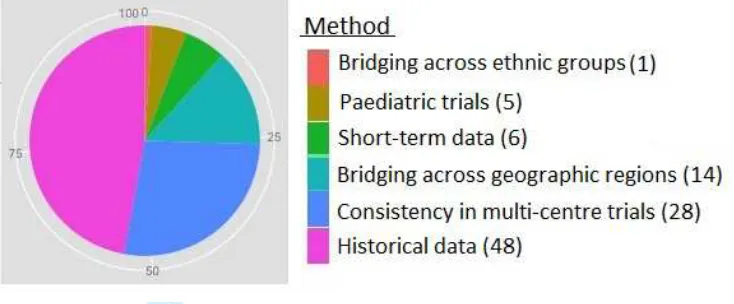
Methods can be categorised into four main areas: i) paediatric drug development (5 of 102 methods); ii) use of historical data in contemporary clinical trials (48 of 102); iii) bridging trials extrapolating efficacy data between ethnic groups or geographic regions (43 of 102); and iv) the use of short-term data to support inferences on long-term outcomes (6 of 102). This is displayed in Figure 3. All five methods in category i) considered extrapolating information from an adult source population to support in-ferences about children. Of the 48 methods in category ii), 25 sought to extrapolate from a historical control group to support conclusions about control response rates in a contemporary patient group. Of the 43 methods in category iii), 14 took as the target population an unstudied patient group in a new geographic region and sought to borrow strength from existing data on patients in another geographic region for whom the treatment had already been shown to be efficacious. One further method in this category evaluated the consistency of data in two ethnic groups of patients. The remaining 28 methods in category iii) were proposed to assess the consistency of treatment effects across regions of a multi-regional clinical trial (MRCT).
Of the 102 methods, 100 expected data from the source and target populations to make inferences about key parameters in the latter group, and as such are appropriate for making partial extrapolations. An example of a method that did not expect data from the target population, Nedelman et al. [15] suggest that a necessary condition for using adult efficacy data to support conclusions about the efficacy of oxcarbazepine 4
For Peer Review
Figure 2: Flow diagram of systematic review results
as a monotherapy for children with epilepsy, is that PK-PD relationships should be similar in adults and children receiving oxcarbazepine as an add-on therapy.
None of the methods found considered extrapolating safety data across populations. Instead all methods expected either efficacy or PD data (100 of 102) or PK data (2 of 102). In the context of paediatric drug development, this may be due to the fact that the paediatric study decision tree stipulates that safety data must be collected in children regardless of one’s confidence in extrapolation assumptions. Most methods (100 of 102) sought to make comparisons between treatments while two methods were proposed in the context of dose-finding trials.
4
Thematic analysis of methods for extrapolation
Methods were first classified according to the type of statistics used, that is, Bayesian or frequentist statistics. Categories were then refined to form three broad groups of ap-4
For Peer Review
Figure 3: Plot showing distribution of methods across four main areas
proaches, namely, Bayesian methods using existing data to create an informative prior distribution for a parameter of a target population; Bayesian and frequentist methods assessing the commensurability of parameters of source and target populations; fre-quentist methods synthesizing data across populations using a joint model or weighted test statistic. Further details of the extrapolation methods are given below.
In all descriptions of methods, we will index parameters and data from the source (target) population by a subscript S (T). Therefore, xS (xT) will denote data from a
source (target) population which depends on an unknown parameter θS (θT). When
θS and θT are assumed equal, we will refer to their common value as θ. When several
datasets are available from a source population, we will letH denote the total number of datasets available and nhS denote the size of dataset h, h= 1, . . . , H. Throughout,
π(·) will be used to denote a general prior or posterior probability density function (pdf).
4.1
Bayesian methods
Searches identified 58 Bayesian methods from 25 papers [2–4, 17–22, 24–39]. Of these, 54 methods [2–4, 17–22, 24–35] sought to create an informative prior for θT while
four [36–39] assessed the consistency of treatment effects or PK responses between the source and target populations.
4.1.1 Using existing data in a source population to create a prior for θT
All methods in this category sought to augment data from a future trial in the target population (xT) with existing data from one or more studies in the source population
(xS). For example,θT and θS could be response rates on the standard of care available
to patients in a new and historical trial, respectively. In this setting, differences between θT andθS may arise due to differences between trial protocols, advances in medical care
For Peer Review
or demographic shifts in the patient population over time. More generally, the source data will be useful for learning aboutθT only if the clinical effects of treatments in the
source and target populations patients are similar. Of the 54 methods which usedxS
to create an informative prior forθT, most proposed discounting these data to account
for potential differences. Thirty-onemethods [2–4, 17–22, 24, 25] considered differences between θT and θS, and formulated priors for θT which when updated with emerging
data from the new trial adaptively weightxS according to the commensurability ofxS
and xT. Fifteen methods adopted a fixed non-adaptive approach to down-weight xS.
Eight methods did not down-weight xS at all, so that the final posterior distribution
forθT would attribute equal weight to the source and target population data.
Adaptive down-weighting of data from the source population
Most approaches in this category were proposed for incorporating data from a histori-cal trial into a contemporary study. One approach which has received much attention is the power prior and 10 variations on this were found [2, 3, 17, 18]. Power priors are formed by raising the likelihood of the historical data to a power a0 ∈[0,1]. More formally, assuming parameters are consistent across populations, letL(θ |xS) denote
the likelihood of the source data and let π0(θ) represent the prior for θ held before these data became available. Then the hierarchical power prior for θ after observing xS [2] is
πP P(θ, a0|xS)∝L(θ|xS)a0π0(θ)π(a0). (1)
The prior for a0 captures prior uncertainty about the commensurability of parameters of the historical and contemporary data. Ibrahim and Chen [2] suggest placing a beta, truncated gamma or normal prior ona0. Once data from the new trial become avail-able, they are used to update (1) using Bayes theorem to derive a posterior distribution for θ and a0 given xS and xT. Both datasets are used to learn about a0 and thus
de-termine the contribution of the historical data to the marginal posterior distribution for θ. If xS and xT are commensurate, in the sense that they are consistent with the
hypothesis that θT =θS, greater posterior weight will be placed on powers close to 1,
in which case observations from both datasets are regarded as equally informative for θT and pooled. Conflicting datasets will result in information from xS being discarded
as greater posterior weight is placed on powers close to 0. Ibrahim and Chen [2] extend πP P in (1) to incorporate data from multiple historical studies. Versions
accommo-dating data following generalized linear fixed and mixed effect models, proportional hazards models and cure rate models are also derived.
It has been noted that the hierarchical power prior in (1) violates the likelihood princi-ple since it omits the normalising constant fora0 [16, 17]. Modifying (1) to incorporate the normalising constantC(a0) = R
L(θ|xS)a0π0(θ)dθ
−1
, we obtain
πM P P(θ, a0|xS) =C(a0)L(θ|xS)a0π0(θ)π(a0), (2)
For Peer Review
which Hobbs et al. [3] refer to as the modified power prior (MPP). Chen et al. [18] extend the MPP to accommodate several historical datasets, as well as binary and normally distributed data. Hobbs et al. [3] modify the MPP in (2) by extending the Bayesian model forxS and xT to incorporate a parameter τ measuring the correlation
between parameters of the historical and contemporary data, and stipulating that θT | θS, τ ∼ N(θS,1/τ) and a0 | τ ∼ Beta(g(τ), 1). Here g is a positive function
specified by the analyst which is small forτ close to 0 and large when τ is large. Thus given the historical and contemporary data are commensurate (inconsistent), the prior distribution for a0 is concentrated about powers close to 1 (0). From this model one can derive the location commensurate power prior (LCPP) as
πLCP P(θT, a0, τ|xS)∝π(a0|τ)π(τ)
Z [L(θ
S|xS)]a0
R
[L(θS|xS)]a0dθS ×
√
τ φ((θT −θS)√τ)dθS,
whereφ is the pdf of a standard normal variable andπ(τ) is a vague prior on τ. Once the new study has been completed, conflicting historical and contemporary data con-sistent with small τ will lead to an adaptive down-weighting of xS in the marginal
posterior forθT.
A similar Bayesian model for xS and xT is assumed to derive the commensurate prior
(CP) for θT [3]. Again modelling conditional prior opinion on θT as θT | θS, τ ∼
N(θS,1/τ), the CP for θT given xS and θS is
πCP(θT, τ|xS, θS)∝L(θS|xS)×√τ φ((θT −θS)√τ)π0(θT)π(τ). (3)
Once data from the new trial become available, the posterior density for (θT, τ) given
xT and xS is proportional to (3) multiplied by L(θT | xT). If the historical and
con-temporary data are consistent with τ ≈ 0, the historical data are discarded and the marginal posterior distribution forθT tends towards the distribution that would result
from updating the initial prior forθT withxT. On the other hand, if data are consistent
withτ ≈ ∞, the marginal posterior forθT converges to the posterior that would result
from pooling xT and xS to update π0(θT) assuming θT = θS. Hobbs et al. [19, 20]
suggest defining π(τ) in (3) as a conditionally conjugate prior distribution or using a ‘spike and slab’ prior. Alternatively, an empirical Bayesian approach can be adopted, replacing τ by its marginal maximum likelihood estimate (MLE) [19]. Hobbs et al. [20] use the commensurate prior [3] to incorporate historical control data into a new adaptive RCT. The randomisation ratio between the novel treatment and control is updated group sequentially on the basis of the current effective sample size of the his-torical data: more patients are randomised to the novel treatment when there is weak evidence of heterogeneity between the historical and contemporary control data. The CP-approach has been extended to accommodate a variety of data types, including responses following general linear mixed effect models, and generalised linear models with fixed or mixed effects. Hobbs et al. illustrate this approach with applications to 4
For Peer Review
binary, survival and count data.Hobbs et al. [3] adapt the CP in (3) for the case of normally distributed data to propose a location commensurate prior (LCP), assuming historical patient responses have meanµS and varianceσ2S, and data from the new trial have meanµT and variance
σ2
T. If no information is available for µS before the historical trial, so thatπ0(µS)∝1,
the posterior distribution for µS after observing a historical dataset of size nS with
sample mean ¯xS would be N(¯xS,ˆσS2n−1S ), replacingσS2 by its MLE. Before the new trial
data become available, we modelµT | µS, τ ∼N(µS, 1/τ). Placing a non-informative
prior on σ2
T and a vague prior on τ, we obtain the LCP:
πLCP(µT, σT2, τ|xS)∝√τ φ
µT −x¯S
√
(τ−1+ ˆσ2
Sn−1S )
σ−2T π(τ).
Updating the LCP with xT, the weight attributed to the historical data by the
pos-terior distribution for (µT, σT2) will depend on the consistency of xS and xT with the
claim that µS = µT. Hobbs et al. [3] extend the LCP to derive the location scale
commensurate prior (LSCP): the weighting of the historical data depends upon the consistency ofxS and xT with the claim that µT =µS and σ2T =σS2.
Meta-analytic predictive (MAP) priors are an approach to combining data across sev-eral heterogeneous source populations to formulate an informative prior for θT. The
use of historical control data potentially allows for the randomisation of fewer con-temporary patients to control in a future RCT. Two methods developed this approach [4, 21], synthesising data from the control arms of several historical trials in a Bayesian random-effects meta-analytical model to derive the posterior predictive distribution for the parameter of interest in the control group of a new study. Models are formulated assuming parameters of the historical and contemporary datasets are exchangeable. Suppose there areH historical trials generating estimatesxS1, . . . , xSH ofθS1, . . . , θSH.
If patient responses are normally distributed, θSh is the expected response on control
in historical trialh, or it may be the log-odds of response on control if outcomes are bi-nary. Neuenschwander et al. [4] assume parameter estimates are normally distributed with known standard errors sS1, . . . , sSH. A Bayesian random-effects meta-analytic
model is:
XSh|θSh ∼N(θSh, s2Sh), for h= 1, . . . , H,
θS1, . . . , θSH, θT|θ⋆, ν2 ∼N(θ⋆, ν2),
θ⋆ ∼π(θ⋆), ν2
∼π(ν2
). (4)
In the special case thatν is known, the posterior distribution ofθ⋆ given the historical
data is
θ⋆|xS1, . . . , xSH, ν ∼N
P
whxSh
P
wh
,P1
wh
, 4
For Peer Review
where wh = (s2Sh +ν)−1. Before the new trial begins, the prior distribution of θT
is its posterior predictive distribution given the historical data. If ν is known, this distribution is
θT|xS1, . . . , xSH, ν ∼N
P
whxSh
P
wh
,P1
wh
+ν2
.
Neuenschwander et al. [4] recommend using priors for ν to check the sensitivity of conclusions in a fully Bayesian meta-analysis. Gsteiger et al. [21] extend this method to derive the MAP prior for the log mean count on control in a new trial when count data are overdispersed and follow a negative binomial model. Chen et al. [18] propose a similar method for normally distributed and binary data which synthesises historical and contemporary data within a Bayesian random-effects meta-analytic model. Hobbs et al. [19] state that when H = 1, there is a one-to-one relationship between the com-mensurability parameter τ in (3) and the between-study variance ν in model (4).
Cuffe [22] considers a new RCT extrapolating from a single historical study to support inferences for the expected response on control. Responses from nS (historical) and
nT (contemporary) control patients are summarised by the sample means xS and xT,
respectively. These statistics are assumed to follow a Bayesian random-effects model
XS |θS ∼N(θS, σ2/nS) and XT |θT ∼N(θT, σ2/nT),
θS, θT |θ⋆ ∼N(θ⋆, σ2/nb),
θ⋆ ∼N(0, σ2
1), (5)
whereσ2 is assumed known and σ2
1 is chosen to be large. It follows that the posterior marginal expectation ofθT is
lim
σ1→∞E
(θT|xT, xS) =
nbnS
2nSnT +nbnT +nbnS
xS+
2nSnT +nbnT
2nSnT +nbnT +nbnS
xT. (6)
Model (5) indexes the between-trial variance, and thus the degree of information bor-rowed fromxS to estimate θT, by the parameternb. Since this will often be unknown,
Cuffe adopts an empirical Bayesian approach, evaluating the posterior expectation of θT at
ˆ
nb = (nm/dm) max{dm− |xT −xS|,0+}, (7)
so that the historical data contribute to our estimation of θT only if the discrepancy
between these and the new data is less than a pre-specified maximum tolerable differ-ence (dm). The maximum influence of the historical data, attained when xS =xT, is
pre-specified as nm. The condition 0+ in (7) ensures nb is strictly positive. On
conclu-sion of the contemporary RCT, data on the experimental treatment are summarised by the statistic xa. A classical frequentist analysis is then conducted to test for a
treatment effect, comparingxa with an estimate of E(θT |xT, xS) derived substituting
ˆ
nb into (6). Cuffe finds that incorporating historical control data into the analysis of a
For Peer Review
contemporary RCT may actually reduce the power to detect a clinically relevant effect if the critical value of the frequentist test must be adjusted to ensure adequate type I error rate control under all possible values of (θT −xS). Viele et al. [23] describe the
results of a simulation study comparing methods for incorporating control data from a single historical trial into the analysis of a contemporary RCT. The authors find that, in general, incorporating historical control data does have benefits for increasing power and reducing the type I error rate when |θT −xS| is close to 0, although how far this
‘sweet spot’ extends before losses in power or increases in type I error rate are incurred depends on the method used for extrapolation.
Mixture priors are another approach for using existing data to create an informative
prior distribution for θT. Two methods [24, 25] use mixture priors to augment data
from a future clinical trial in a new geographic region with data,xS, from an area that
has previously been studied. These methods set the prior for the treatment effect in the new region as
π(θT |xS) =ω π1(θT) + (1−ω)π2(θT),
where π1(·) is an informative prior derived from xS, and π2(·) is a non-informative
distribution used to dilute the information forθT obtained from xS so that π(θT |xS)
has heavy tails. Hsiao et al. [24] recommend that the mixing proportionω be fixed by
the regulatory authority of the new region. This weight may be specified in view of differences between the new and previously studied regions in terms of intrinsic and
extrinsic ethnic factors. The corresponding posterior distribution for θT will also be
a mixture distribution, with components that are the posterior distributions if π1(θT)
orπ2(θT) were the priors, and weights that are a function of the data, such that more
weight is given to the posterior that would result from updating the prior component
most commensurate with xT. Hobbs et al. [3] also consider mixture priors, proposing
a prior for the mean and variance of patient responses in a new trial which is a
mix-ture ofmLSCPs with fixed pairs of commensurability parameters (τ1, γ1), . . . ,(τm, γm)
and fixed weighting proportions ω1, . . . , ωm. This method allows for the consideration
of different plausible relationships between the location and scale parameters of the historical and contemporary data.
Non-adaptive down-weighting of data from the source population
Fifteenmethods [2, 3, 25–33] used existing data from a source population to formulate
an informative prior forθT, down-weighting these data in a non-adaptive, pre-specified
manner. The power prior can be considered in this category ifa0 in (1) is taken to be a fixed constant and Hobbs et al. [3] refer to this approach as the conditional power prior (CPP). Six methods [2, 3, 25–27] propose power priors with fixed a0. Ibrahim and Chen [2] propose a variation on this approach for the case that historical data are from a single trial and patient responses follow an arbitrary regression model. Neither 4
For Peer Review
paper discusses how to choosea0 [2, 3]. De Santis [26] defines a geometric prior, raising the likelihood of data from a single historical trial to a power a0 = r/nS, where r is
a constant specified by the analyst. The author also modifies this approach to weight different historical datasets by different fractions when they differ in their relevance to the new trial. De Santis [26] illustrates how the geometric prior can be used to inform early stopping decisions in a new Bayesian clinical trial. Rietbergen et al. [27] consider the CPP incorporating data from several historical studies, assigning data from each study a weight elicited from expert opinion. Gandhi et al. [25] consider the CPP for the purposes of incorporating existing binary data from a geographic region in which a drug has been shown to be effective into the analysis of a bridging trial conducted in a new region. The authors recommend performing sensitivity analyses to explore the impact on inferences of different choices of weights. Hobbs et al. [3] also provide a variation on the commensurate prior described in the previous subsection which treatsτ as fixed.
Schoenfeld et al. [28] augment data from a clinical trial in children with data from a completed adult trial, assuming parameters of adult and paediatric data are samples from a normal population distribution with meanθ⋆ and known varianceν2. The choice of ν2 reflects opinion on between population differences. This method is equivalent to the conditional power prior when data are available from one adult study: if data from more than one adult trial are available, these should be summarised by a single esti-mate derived from a meta-analysis of adult studies. Schoenfeld et al. [28] also consider an approach for determining the sample size needed to ensure the Bayesian paediatric trial incorporating adult data has high Bayesian power. Augmenting paediatric data with adult data means that fewer children may be required.
Chen et al. [29] derive a Bayesian empirical prior distribution for a treatment effectθT
in a specific local region of a MRCT which borrows strength from data from other trial sites. The priorθT ∼N(ˆµ, σ2) is specified by defining ˆµas the global treatment effect
estimate found by averaging across effect estimates obtained from each trial region. Meanwhile, σ2 is taken to be a linear function of the variance of the region-specific effect estimates, where smaller values of the coefficient of the interregional variance allow for more borrowing of strength across regions. Chen et al. [29] recommend that this coefficient be specified ahead of time and chosen to reflect the consensus opinion of the local regulatory authority and the trial sponsor.
Six other methods in this category of approach shift the location and/or inflate the standard error of an estimate of θS to create an informative prior for θT while
dis-counting the source population data [30–33]. For example, French et al. [32] formulate a normal prior distribution for θT with mean equal to the MLE of θS obtained from
xS, and standard deviation equal to four times the standard error of the MLE; the
authors propose using this prior for the Bayesian interim monitoring of a trial which will terminate with a conventional frequentist analysis. Whitehead et al. [33] consider Bayesian sample size calculations, using historical placebo data to create an informa-4
For Peer Review
tive prior distribution for the expected response on placebo in the new trial. This prior is normally distributed, with the mean taken to be the mean response from the historical placebo group and precision chosen to reflect how many patients the prior should represent.
No down-weighting of data from the source population
Eight methods [25, 31, 32, 34, 35] used data from a source population to create an informative prior distribution for θT without any down-weighting. Thus, once
avail-able, data from the target and source populations are pooled to derive a posterior distribution forθT.
4.1.2 Assessing consistency between source and target populations
Four Bayesian methods were proposed to assess the consistency of parameters in source and target populations [36–39]. Pei and Hughes [36] seek to assess whether candidate doses for adults and children result in similar percentages of patients experiencing low levels of a drug; inferences are made testing whether the proportion of children record-ing PK levels below a quantile estimated from adult data is non-inferior or equivalent to a design value. Tsou et al. [37] use Bayesian most plausible prediction [40] to assess the consistency of treatment effect estimates generated by a new clinical trial compar-ing an experimental treatment (E) with control (C) in a new geographic region, and reference studies which have demonstrated the advantage of E versus C in an original geographic region, under the assumption of normally distributed treatment effect es-timates. The difference between treatment group sample means for the bridging trial, ˆ
θT, is said to be consistent with the results of the H reference studies, denoted by
ˆ
θS = (ˆθS1, . . . ,θˆSH), if and only if
p(ˆθT |θˆS)≥ρBmin{p(ˆθSh |θˆS\h);h= 1, . . . , H},
where p(ˆθT | θˆS) is the posterior predictive probability of ˆθT given the results of all
reference studies, ˆθS\h is the vector of reference effect estimates excluding ˆθSh, and ρB >0 is a pre-specified constant which reflects the prior confidence of the regulatory
authority in the commensurability of data from the new and original geographic re-gions. Posterior predictive probabilities are derived assuming a non-informative prior distribution for the common treatment effectθ before any data are observed. The pos-terior predictive probability p(ˆθT |θˆS) therefore provides a measure of the plausibility
of ˆθT given the previous trial results. Chow et al. [38] also use posterior predictive
probabilities to assess the consistency of data from a bridging trial and reference stud-ies. Gould et al. [39] propose an approach whereby the results of a bridging study are judged to be consistent with those of the reference studies if they fall within contours or regions of the posterior predictive distribution derived from the reference confirma-tory trials. The sample size of the bridging trial may be chosen to find an acceptable 4
For Peer Review
balance between the producer risk, that is, the probability of incorrectly rejecting a conclusion of consistency, and the consumer risk, which is the probability of incorrectly concluding consistency.
4.2
Frequentist methods
Forty-four frequentist methods were identified [15, 36–38, 41–45, 47–56, 66–76] of which 11 methods [41–45, 47–52] synthesised data from source and target populations in a joint model, three methods [53–55] combined data across populations through a weighted test statistic, and 30 methods [15, 36–38, 49–52, 56, 66–76] proposed criteria to assess the consistency of estimates of key parameters in different populations.
4.2.1 Joint model incorporating data from source and target populations
Five methods [41–45] proposed using short-term data to support inferences about a long-term endpoint assuming simple models to relate observations on different out-comes. In this setting, θT and θS could represent long- and short-term treatment
ef-fects, or characterise the distribution of the two endpoints. Several authors extrapolate from short-term data to inform early stopping decisions for sequential trials. Hamp-son and JenniHamp-son [41] seek to increase the efficiency of group sequential tests (GSTs) monitoring a long-term outcome by incorporating data on a correlated short-term end-point so as to increase the Fisher information available forθT at each interim analysis.
MLEs of θT are found maximising the joint likelihood of xS and xT assuming pairs of
responses on the same patient follow a bivariate normal distribution. No assumption is made about the form of the relationship between the short- and long-term responses other than that they are correlated. The authors derive optimal designs and show that incorporating data on a highly correlated short-term endpoint can reduce the ex-pected sample size of a trial by around 5% of the fixed sample size when the time to availability of the short-term endpoint is at least half that of the long-term endpoint. A similar problem is considered by Galbraith & Marschner [42], who incorporate into GSTs repeated measurements of a continuous endpoint taken at an arbitrary num-ber of follow-up times. The vector of repeated measurements for each individual is assumed to follow a multivariate normal distribution, with correlations between the measurements being exploited to improve estimation and inference associated with the long-term measurement. Marschner and Becker [43] increase the interim information available for a long-term response probability by incorporating data on a short-term binary endpoint, deriving the MLE of the long-term response rate from the joint like-lihood of the combined dataset. The values of the short- and long-term endpoints may be associated, however, a patient’s short-term response does not necessarily determine their long-term response.
Stallard [44] uses observations on short- and long-term endpoints to support early stopping and treatment selection decisions in a seamless Phase II/III clinical trial. 4
For Peer Review
Responses on the same patient are assumed to follow a bivariate normal distribution, fitted using the double regression method of Engel and Walstra [46]. W¨ust and Kieser [45] also consider bivariate normal outcomes and derive a more precise estimator of the variance of the long-term outcome incorporating short- and long-term data. Using this improved estimator to inform blinded sample size adjustments at an interim analysis reduces the variability of the final trial sample size when compared to using long-term data alone.
Six methods [47–52] synthesize data from source and target populations using a fre-quentist random-effects model. Thall and Simon [47] combine historical and contem-porary control data via a univariate random-effects meta-analysis while Arends et al. [48] model short-term and long-term outcomes from trials using a multivariate random effects model. Chen et al. [49] and Ko [50] use a random effects model to accommodate heterogeneity between regions and test for an overall treatment effect. Liu et al. [51] use a random effects model to test for similarity or non-inferiority between treatment effects in different regions. Ko [52] models survival data from different regions using a proportional hazards model with frailties to allow patients in different regions to have varying underlying hazards of experiencing an event.
4.2.2 Combining data across populations in a weighted test-statistic
Three methods [53–55] propose making final inferences about the efficacy of a new treatment in a new geographic region on the basis of a test-statistic combining infor-mation from the source and target populations. Suppose ZT and ZS are standardised
test statistics comparing mean responses on a new treatment and placebo in a new and original region, respectively. For reasonable sample sizes, ZT and ZS follow at
least approximately standard normal distributions. Lan et al. [53] propose a weighted Z statistic for testing efficacy across regions, H0 :θ = 0, defined as,
Zw =√ω ZS+
√
1−ω ZT,
with 0≤ω ≤1. Chow et al. suggest that|Zw|> z1−α/2, where z1−α/2 is the (1−α/2) quantile of a standard normal distribution, implies the results of the bridging study are consistent with those of the reference study which demonstrated efficacy of the new treatment relative to placebo in the original geographic region. The weight ω should be pre-specified by the regulatory agency, although Lan et al. [53] suggest that this weight may be based on evidence of efficacy established in the original region.
4.2.3 Assessing the consistency of data from source and target populations
Thirty methods were proposed to assess the consistency of data from different popula-tions. Chen et al. [56] survey nine methods in their systematic review for testing the commensurability of a treatment effect across regions of a MRCT, of which we extracted eight. These methods comprised ‘Global methods’ assessing consistency based on a 4
For Peer Review
test-statistic combining data across all trial regions; ‘Multivariate quantitative’ meth-ods assessing consistency by considering all pairwise differences between region-specific effect estimates; and ‘Multivariate qualitative methods’ assessing whether patients from all trial regions can benefit from a new treatment. All eight methods assumed patient responses to be normally distributed. Let ∆j be the difference in mean response on
treatments E and C in trial region j, for j = 1, . . . , s. Then, ∆ = Ps
j=1nj∆j/n is the overall treatment effect for the trial, wherenj is the number of patients per treatment
in thejth region and n is the total number of patients per treatment.
One Global method is Cochran’s Q statistic [57] for testing the null hypothesis H0 : ∆1 = ∆2 = . . . = ∆s = ∆, against the alternative that at least one ∆j is different.
Treatment effects are judged to be consistent if we fail to rejectH0, that is, if
Q=
s
X
j=1
( ˆ∆j −∆)ˆ 2
2/nj
< χ2
s−1;1−α,
whereχ2
s−1;1−α is the (1−α) quantile of a central chi-square distribution with (s−1)
degrees of freedom. The test of H0 based on the Qstatistic is well known to have low power [58] in certain situations; for example, in the current context, when the total information available for estimating ∆ is low or there are large imbalances between the contributions of different centres to this total information. Higgins’ I2 statistic [59], defined as I2 = 100(1
−(s−1)/Q), measures the degree of inconsistency between ∆1, . . . ,∆s. However, interpretation of I2 can be problematic since it increases as a
non-linear function of the between-centre heterogeneity [60]. This statistic also de-pends on the within-centre precision [61] and the number of centres,s, such that under H0, E(I2) =
−200/(s−3) if s > 3 [60]. An alternative measure of consistency not found by this review but pointed out by a reviewer is H2 = Q/(s
−1) [62], which is independent of the number of centres.
Global test statistics can also be used to test for a qualitative interaction between the treatment effect and trial regions. The Gail-Simon test [63] ofH0 :{∆j ≥0, for allj =
1, . . . , s} ∪ {∆j < 0, for all j = 1, . . . , s} rejects the null hypothesis if min(Q+, Q−)
exceeds a critical valuec, where
Q− =
s
X
j=1 ˆ ∆2
j
2/nj
I( ˆ∆j >0), Q+ = s
X
j=1 ˆ ∆2
j
2/nj
I( ˆ∆j <0).
Chen et al. [56] also review Multivariate quantitative methods which test H0 : ∆1 = . . . = ∆s = ∆ and declare treatment effects as consistent if there are no significant
pairwise differences between effect estimates, that is, if
|∆ˆi−∆ˆj|< zα/2
q
2(nj +ni)/(ninj) for i, j = 1, . . . , s, i6=j.
For Peer Review
A variation on this approach has been proposed for testing H0 :|∆1−∆| > m or . . . or|∆s−∆|> m [64], where rejecting H0 implies that all regional effects lie within an
equivalence margin m of ∆.
Multivariate qualitative methods reviewed by Chen et al. [56] include testingH0 : ∆1 ≤ δ∆ or . . . or ∆s ≤ δ∆, to determine whether all regional effects are non-inferior to
the global treatment effect, proposed by Liu et al. [51]. One further method is based on confidence interval coverage which declares the treatment effect to be consistent across regions if ˆ∆j > π∆ˆ −zα/2
p
2/nj for j = 1, . . . , s. The Pharmaceuticals and
Medical Devices Agency (PMDA) suggest declaring consistency if a positive trend is observed, that is, if ˆ∆j > 0 for all j = 1, . . . , s, or if ˆ∆j > δ∆ for allˆ j = 1, . . . , s
[65]. The PMDA recommend setting δ ≥0.5 although Chen et al. comment that this may be too conservative when several trial regions are included. This literature review found 15 further methods [37, 49, 50, 52, 66–73] proposing consistency criteria similar to the PMDA method. For example, let ˆ∆, ˆ∆S\j⋆ and ˆ∆j⋆ denote the treatment effect
estimates derived from pooling data across all trial regions, all regions excluding region j⋆, and region j⋆ alone, respectively. Ko et al. [69] consider several alternative criteria
for determining whether a new treatment should be deemed efficacious in region j⋆
when there is strong statistical evidence to reject H0 : ∆ = 0. For example, investi-gators may pre-specify one of the following criteria for their study: 1) ˆ∆j⋆ ≥ ρ∆S\ˆ j⋆;
2) ˆ∆j⋆ ≥ ρ∆; 3)ˆ ρ ≤ ∆ˆj⋆/∆S\ˆ j⋆ ≤ 1/ρ; or 4) ρ ≤∆ˆj⋆/∆ˆ ≤ 1/ρ. Here ρ ∈ (0,1) may
be pre-specified by the regulatory agency of region j⋆. Alternatively, Chen et al. [74]
derive standardised weighted least squares residuals from ˆ∆1, . . . ,∆ˆs and use these to
create Q-Q plots for assessing consistency between regional treatment effects. Pei and Hughes [36] propose a frequentist version of their method described in Section 4.1.2 which seeks to assess whether candidate doses for adults and children result in similar percentages of patients experiencing low levels of a drug.
Hsiao et al. [75] propose two-stage designs for bridging trials. The trial begins re-cruiting patients from the original region. If efficacy in this region is confirmed at the interim analysis, the trial proceeds to recruit patients from the new region in Stage 2. Otherwise the trial terminates early for lack of benefit. On conclusion of the trial, data accumulated from both regions are pooled and analysed to test a one-sided null hypothesis of no treatment effect. If the result of Stage 1 is similar to the pooled result of Stage 2, the result from the new region is declared consistent with that from the original region and we conclude that the new treatment is effective in both localities.
Cai et al. [76] propose evaluating the similarity of data from clinical trials performed in different ethnic populations using a ‘distribution adjusted mean’. This method as-sumes that there is a covariate Y prognostic for the primary endpoint which differs in distribution between the two ethnic groups. If Y is continuous, its domain can be partitioned into intervals and the relative frequency of each interval in the target pop-4
For Peer Review
ulation is recorded. These frequencies are then used to calculate the weighted average response in the source population, averaging across the mean responses for each inter-val of Y. This adjusted mean response is then compared with the unadjusted mean for the target population to assess the consistency of response between the populations.
Nedelman et al. [15] develop a method comparing children and adults receiving a new drug as an add-on therapy, with the aim of using these data to support inferences about children receiving the drug as monotherapy. If the PK-Efficacy relationship is similar for adults and children receiving add-on therapy, this is taken to support an assump-tion of similar relaassump-tionships for adults and children receiving monotherapy. Separate linear models are fitted to the PK-Efficacy data from adults and children, and model parameters are compared to establish whether there are differences between age-groups.
Chow et al. [38] apply the ‘reproducibility probability’ method [77] to bridging studies, calculating the reproducibility probability as the power of the bridging study to detect a treatment effect equal to the estimated effect from the reference study which itself produced a significant result. If the reproducibility probability exceeds a critical value (determined by a regulatory agency) then the bridging study may be considered un-necessary, that is, clinical data from the original region can be completely extrapolated to the new region to support claims of efficacy.
5
Discussion
This systematic review summarises statistical methods relevant for extrapolating data from a source population to a target population, and has captured a wide range of methodology. Several of the approaches identified are potentially applicable for mak-ing extrapolations to support paediatric drug development. In this context, adult data, pre-clinical data and data on children receiving treatment for related conditions may all be available at the time development of a medicine begins in children. Thus, methods which can harness existing data to derive informative prior distributions for key parameters in children are particularly appealing. However, we speculate that down-weighting existing data would be more acceptable in this setting to account for potential differences between adults and children. Therefore, the applicability of those eight methods which give comparable weight to historical and contemporary data is likely to be limited unless there is a strong prior rationale for believing that adults and children will respond similarly to treatment. Alternatively, the methods identified by this review for assessing the consistency of parameters of source and target populations may be used as objective criteria for determining when it is appropriate to pool data from adults and children, or indeed pool data across different age groups of children.
When there is some prior understanding of the factors that may explain differences between populations, a weight for the existing data may be pre-specified. Otherwise 4
For Peer Review
Bayesian approaches such as the power prior, commensurate prior, mixture prior or MAP prior, which adaptively down-weight existing data, may be preferred. One criti-cism that has been made of MAP priors is that the posterior predictive distribution for θT given historical data must be typically derived using Markov Chain Monte Carlo.
Therefore, since the prior is not available analytically, it cannot be easily reproduced by others unless they have access to the historical data combined in the meta-analysis. To overcome this challenge, Schmidli et al. [78] propose representing the MAP prior as a mixture of a small number of conjugate prior distributions which can be easily recorded and shared.
In Section 1 it was noted that there may be differences between age groups of children. Twenty-five methods [2, 15, 19, 56, 71, 76] identified by this review can accommodate a heterogeneous target population because key parameters are taken to be parameters of (semi-)parametric models capable of adjusting for baseline demographics. Several methods proposing a joint model for data from the source and target populations as-sume only that data from different populations are correlated. However, this is unlikely to be the case for paediatric drug development when source and target data will typ-ically be observations on different patients. In this case multivariate meta-analytic models, as used by Arends et al. [48], are potentially more relevant since they can capture correlations between parameters of different populations. Future research will consider tailoring these models to support extrapolations in paediatric trials.
Several papers were identified by our literature search which, although they did not contain statistical methods, are relevant for discussion. Manolis et al. [9] discuss the role of modelling and simulation in paediatric investigation plans (PIPs), which are documents pre-specifying what studies will be conducted to support development of a medicine for children. The authors review positive PIP opinions (summarising key elements of PIPs supported by the EMA) and find that population PK models are the most frequently referenced modelling approach, while exposure-response and dose-response models are rarely cited: modelling and simulation, when proposed, is typically used to support dose predictions, study optimization and data analysis. Khalil and L¨aer [79] review physiologically based pharmacokinetic (PBPK) models as applied to paediatric drug development, where parameters of PBPK models for children may be extrapolated from another species or age group.
Other methods not included in the systematic review were found proposing other ways for using data from a source population to support inferences for a target population. Reif et al. [80] fit a population PK model to data from an adult Phase I trial and use this model to design clinical trial simulations needed to devise a sparse PK sampling sched-ule for children. De Santis [81] consider using a design prior borrowing information from historical data to plan a clinical trial, for instance to inform sample size selections. Additionally, 12 methods included in the review [18, 21, 28, 33, 37, 39, 47, 51, 53, 55, 73] use source data to inform the design (through sample size calculations) and analysis of 4
For Peer Review
a prospective trial in the target population. In addition, four methods [20, 26, 32, 75] use source and target data to inform mid-study adaptations to the study in the target population.
Software was available for few of the 102 methods identified by this review. Com-puter syntax was included in a main paper or accompanying supplementary material for 9 methods [21, 27, 32, 33, 35, 36, 39]; code was stated as available upon request from the corresponding author of one method [70]; syntax for another method [17] was included in a related commentary article [82]. The strategy used to identify available software is described in Supplementary Appendix C, while the results are listed in Supplementary Appendix D.
This systematic review has aimed to be a comprehensive overview of methods for extrapolation. However, one limitation is that we chose to focus our literature searches on the four application areas listed in Section 2 and by doing so may have missed other relevant methods. Another limitation is that one author extracted the data so independent reviews of all papers were not performed.
Acknowledgements
We thank two reviewers for their thoughtful and supportive comments which helped to improve the manuscript. This work was supported in part by grants from the National Institute for Health Research [NIHR-RMOFS-2013-03-05, IW; NIHR-CDF-2010-03-32, TJ], the Medical Research Council [MR/J014079/1, LVH; MR/M013510/1, IW] and the Medical Research Council North-West Hub for Trials Methodology Research [MR/K025635/1].
For Peer Review
References
1. European Medicines Agency. Concept paper on extrapolation of ef-ficacy and safety in medicine development - EMA/129698/2012;.
http://www.ema.europa.eu/docs/en_GB/document_library/Scientific_ guideline/2013/04/WC500142358.pdf(2013, accessed: 01/10/2014).
2. Ibrahim JG, Chen MH. Power prior distributions for regression models. Stat Sci. 2000;15(1):46–60.
3. Hobbs BP, Carlin BP, Mandrekar SJ, et al. Hierarchical commensurate and power prior models for adaptive incorporation of historical information in clinical trials. Biometrics. 2011;67(3):1047–1056.
4. Neuenschwander B, Capkun-Niggli G, Branson M, et al. Summarizing historical information on controls in clinical trials. Clin Trials J. 2010;7(1):5–18.
5. Fleming TR, DeMets DL. Surrogate end points in clinical trials: are we being misled? Ann Intern Med. 1996;125(7):605–613.
6. International Conference on Harmonisation. Ethnic factors in the acceptability of foreign clinical data E5 (R1);. http://www.ich.org/fileadmin/Public_Web_ Site/ICH_Products/Guidelines/Efficacy/E5_R1/Step4/E5_R1__Guideline. pdf(1998, accessed: 01/10/2014).
7. Dunne J, Rodriguez WJ, Murphy MD, et al. Extrapolation of adult data and other data in pediatric drug-development programs. Pediatrics. 2011;128(5):1242–1249.
8. Food and Drug Administration. Guidance for industry: exposuresponse re-lationships - study design, data analysis, and regulatory applications; 2003.
http://www.gmp-compliance.org/guidemgr/files/EXPOSURE.PDF (2003, ac-cessed: 15/01/2015).
9. Manolis E, Osman TE, Herold R, et al. Role of modeling and simulation in pediatric investigation plans. Paediatr Anaesth. 2011;21(3):214–221.
10. International Conference on Harmonisation. E11: Note for guidance on clinical investigation of medicinal products in the paediatric population (CPMP/ICH/2711/99);. http://www.ema.europa.eu/docs/en_GB/document_ library/Scientific_guideline/2009/09/WC500002926.pdf (2001, accessed: 01/10/2014).
11. Joseph PD, Craig JC, Caldwell PHY. Clinical trials in children. Br J Clin Phar-macol. 2015;79(3):357–369.
For Peer Review
12. Shilling V, Williamson PR, Hickey H, Sowden E, Smyth RL, Young B. Processes in recruitment to randomised controlled trials of medicines for children (RECRUIT): a qualitative study. Health Technol Assess. 2011;15(15):1–116.
13. Batchelor HK, Marriott JF. Paediatric pharmacokinetics: key considerations. Br J Clin Pharmacol. 2015;79(3):395–404.
14. Stephenson T. How childrens responses to drugs differ from adults. Br J Clin Pharmacol. 2005;59(6):670–673.
15. Nedelman JR, Rubin DB, Sheiner LB. Diagnostics for confounding in PK/PD models for oxcarbazepine. Stat Med. 2007;26(2):290–308.
16. Duan Y, Ye K, Smith EP. Evaluating water quality using power priors to incorpo-rate historical information. Environmetrics. 2006;17(1):95–106.
17. Neuenschwander B, Branson M, Spiegelhalter DJ. A note on the power prior. Stat Med. 2009;28(28):3562–3566.
18. Chen MH, Ibrahim JG, Lam P, et al. Bayesian design of noninferiority trials for medical devices using historical data. Biometrics. 2011;67(3):1163–1170.
19. Hobbs BP, Sargent DJ, Carlin BP. Commensurate priors for incorporating his-torical information in clinical trials using general and generalized linear models. Bayesian Anal. 2012;7(3):639–674.
20. Hobbs BP, Carlin BP, Sargent DJ. Adaptive adjustment of the randomization ratio using historical control data. Clinl Trials J. 2013;10(3):430–440.
21. Gsteiger S, Neuenschwander B, Mercier F, et al. Using historical control informa-tion for the design and analysis of clinical trials with overdispersed count data. Stat Med. 2013;42(21):3609–3622.
22. Cuffe RL. The inclusion of historical control data may reduce the power of a confirmatory study. Stat Med. 2011;30(12):1329–1338.
23. Viele K, Berry S, Neuenschwander B, Amzal B, Chen F, Enas N, et al. Use of historical control data for assessing treatment effects in clinical trials. Pharm Stat. 2014;13(1):41–54.
24. Hsiao CF, Hsu YY, Tsou HH, et al. Use of prior information for Bayesian evaluation of bridging studies. J Biopharm Stat. 2007;17(1):109–121.
25. Gandhi M, Mukherjee B, Biswas D. A Bayesian approach for inference from a bridging study with binary outcomes. J Biopharm Stat. 2012;22(5):935–951.
26. De Santis F. Power priors and their use in clinical trials. Am Stat. 2006;60(2):122– 129.
For Peer Review
27. Rietbergen C, Klugkist I, Janssen KJM, et al. Incorporation of historical data in the analysis of randomized therapeutic trials. Contemp Clin Trials. 2011;32(6):848– 855.
28. Schoenfeld DA, Zheng H, Finkelstein DM. Bayesian design using adult data to augment pediatric trials. Clin Trials J. 2009;6(4):297–304.
29. Chen YH, Wu YC, Wang M. A Bayesian approach to evaluating regional treatment effect in a multiregional trial. J Biopharm Stat. 2009;19(5):900–915.
30. Goodman SN, Sladky JT. A Bayesian approach to randomized controlled trials in children utilizing information from adults: the case of Guillain-Barre. Clin Trials J. 2005;2(4):305–310.
31. Greenhouse JB, Seltman H. Using prior distributions to synthesize historical ev-idence: comments on the Goodman–Sladky case study of IVIg in Guillain–Barr´e syndrome. Clin Trials J. 2005;2(4):311–318.
32. French JL, Thomas N, Wang C. Using historical data with Bayesian methods in early clinical trial monitoring. Stat Biopharm Res. 2012;4(4):384–394.
33. Whitehead J, Vald´es-M´arquez E, Johnson P, et al. Bayesian sample size for ex-ploratory clinical trials incorporating historical data. Stat Med. 2008;27(13):2307– 2327.
34. Gamalo MA, Wu R, Tiwari RC. Bayesian approach to noninferiority trials for proportions. J Biopharm Stat. 2011;21(5):902–919.
35. Kitsche A, Hothorn LA, Schaarschmidt F. The use of historical controls in es-timating simultaneous confidence intervals for comparisons against a concurrent control. Comput Stat Data Anal. 2012;56(12):3865–3875.
36. Pei L, Hughes MD. A statistical framework for quantile equivalence clinical trials with application to pharmacokinetic studies that bridge from HIV-infected adults to children. Biometrics. 2008;64(4):1117–1125.
37. Tsou HH, Chien TY, Liu JP, et al. A consistency approach to evaluation of bridging studies and multi-regional trials. Stat Med. 2011;30(17):2171–2186.
38. Chow SC, Chiang C, Liu JP, et al. Statistical methods for bridging studies. J Biopharm Stat. 2012;22(5):903–915.
39. Gould AL, Jin T, Zhang LX, et al. A predictive Bayesian approach to the design and analysis of bridging studies. J Biopharm Stat. 2012;22(5):916–934.
40. Aitchison J, Dunsmore IR. Statistical prediction analysis. CUP Archive; 1975. 4
For Peer Review
41. Hampson LV, Jennison C. Group sequential tests for delayed responses (with discussion). J Roy Stat Soc B. 2013;75(1):3–54.
42. Galbraith S, Marschner IC. Interim analysis of continuous long-term endpoints in clinical trials with longitudinal outcomes. Stat Med. 2003;22(11):1787–1805.
43. Marschner IC, Becker SL. Interim monitoring of clinical trials based on long-term binary endpoints. Stat Med. 2001;20(2):177–192.
44. Stallard N. A confirmatory seamless phase II/III clinical trial design incorporating short-term endpoint information. Stat Med. 2010;29(9):959–971.
45. W¨ust K, Kieser M. Blinded sample size recalculation for normally distributed outcomes using long-and short-term data. Biometrical J. 2003;45(8):915–930.
46. Engel B, Walstra P. Increasing precision or reducing expense in regression experiments by using information from a concomitant variable. Biometrics. 1991;47(1):13–20.
47. Thall PF, Simon R. Incorporating historical control data in planning phase II clinical trials. Stat Med. 1990;9(3):215–228.
48. Arends LR, Vok´o Z, Stijnen T. Combining multiple outcome measures in a meta-analysis: an application. Stat Med. 2003;22(8):1335–1353.
49. Chen CT, Hung HJ, Hsiao CF. Design and evaluation of multiregional trials with heterogeneous treatment effect across regions. J Biopharm Stat. 2012;22(5):1037– 1050.
50. Ko FS. Approaches to allocate sample size rationally into individual regions for a multi-regional trial under heterogeneous effect size. Commun Stat Theory. 2012;41(20):3648–3665.
51. Liu JP, Hsueh H, Chen JJ. Sample size requirements for evaluation of bridging evidence. Biometrical J. 2002;44(8):969–981.
52. Ko FS. A design for survival studies: A multi-regional trial with unrecognized heterogeneity. Commun Stat Theory. 2013;42(13):2301–2323.
53. Lan KKG, Soo Y, Siu C, et al. The use of weighted Z-tests in medical research. J Biopharm Stat. 2005;15(4):625–639.
54. Huang Q, Chen G, Yuan Z, et al. Design and sample size considerations for simulta-neous global drug development program. J Biopharm Stat. 2012;22(5):1060–1073.
55. Tsou HH, Tsong Y, Liu JT, et al. Weighted evidence approach of bridging study. J Biopharm Stat. 2012;22(5):952–965.
For Peer Review
56. Chen J, Quan H, Binkowitz B, et al. Assessing consistent treatment effect in a multi-regional clinical trial: a systematic review. Pharm Stat. 2010;9(3):242–253.
57. Cochran WG. The combination of estimates from different experiments. Biomet-rics. 1954;10(1):101–129.
58. Hardy RJ, Thompson SG. Detecting and describing heterogeneity in meta-analysis. Stat Med. 1998;17(8):841–856.
59. Higgins JPT, Thompson SG, Deeks JJ, Altman DG. Measuring inconsistency in meta-analyses. BMJ. 2003;327(7414):557–560.
60. Mittlb¨ock M, Heinzl H. A simulation study comparing properties of heterogeneity measures in meta-analyses. Stat Med. 2006;25(24):4321–4333.
61. R¨ucker G, Schwarzer G, Carpenter JR, Schumacher M. Undue reliance on I2 in assessing heterogeneity may mislead. BMC Med Res Methodol. 2008;8(1):79.
62. Higgins JP, Thompson SG, et al. Quantifying heterogeneity in a meta-analysis. Stat Med. 2002;21(11):1539–1558.
63. Gail M, Simon R. Testing for qualitative interactions between treatment effects and patient subsets. Biometrics. 1985;41(2):361–372.
64. Chow SC, Shao J, Hu OYP. Assessing sensitivity and similarity in bridging studies. J Biopharm Stat. 2002;12(3):385–400.
65. Ministry of Health, Labour and Welfare of Japan. Basic principles on global clini-cal trials;. http://www.pmda.go.jp/kijunsakusei/file/guideline/new_drug/ GlobalClinicalTrials_en.pdf (2007, accessed: 01/10/2014).
66. Uesaka H. Sample size allocation to regions in a multiregional trial. J Biopharm Stat. 2009;19(4):580–594.
67. Tsou HH, Chow SC, Lan KK, et al. Proposals of statistical consideration to evaluation of results for a specific region in multi-regional trials–Asian perspective. Pharm Stat. 2010;9(3):201–206.
68. Quan H, Zhao PL, Zhang J, et al. Sample size considerations for Japanese patients in a multi-regional trial based on MHLW guidance. Pharm Stat. 2010;9(2):100–112.
69. Ko FS, Tsou HH, Liu JP, et al. Sample size determination for a specific region in a multiregional trial. J Biopharm Stat. 2010;20(4):870–885.
70. Luo X, Shih WJ, Ouyang SP, et al. An optimal adaptive design to address local regulations in global clinical trials. Pharm Stat. 2010;9(3):179–189.
![Figure 1: Paediatric Study Decision Tree: Image reproduced from [8]For Peer Reviewegories: biology; mathematical and computational biology; mathematics (applied, in-terdisciplinary applications); medical informatics; research and experimental medicine;pedi](https://thumb-us.123doks.com/thumbv2/123dok_us/9353328.437440/7.612.162.452.83.357/paediatric-reviewegories-mathematical-computational-terdisciplinary-applications-informatics-experimental.webp)