FACULTY OF SCIENCE AND TECHNOLOGY
LANCASTER ENVIRONMENT CENTRE
Assessment of plant hormone quantification as a new
physiological trait for crop breeding using a new
classification method for crop performance under
drought.
Arnauld Thiry
B.S. Agricultural Engineer, Gembloux Agro-Bio Tech – University of Liège
(GxABT - ULG), Belgium
MSc. Bio-Engineering – Agricultural Science, GxABT - ULG, Belgium
Thesis submitted for the degree of Ph.D. at Lancaster University
II
Declaration
I declare that the contents in this thesis are my original research work and it has not previously been submitted, in part or in full, for the award of a higher degree at any other institution. Wherever contributions of others are involved, every effort is made to indicate this clearly, with due reference to the literature and acknowledgement.
Additionally, it is needed to comment that part of Chapter 2 has been published in September 2016 at the Journal of Experimental Botany.
III To my son ”Alexandre”
IV
Acknowledgment
When somebody changes the course of your life and makes it without personal interest something of great value is pushing your life and your projects ahead.
For giving me the possibility to intend to develop new resources for the human being I’m grateful to the person who did stimulate this idea.
Dra Perla Chavez Dulanto is this person and was the necessary link to introduce me to two of the most famous scientists I have been in touch with.
First Dr Matthew Reynolds (CIMMYT – Mexico) who left me responsibilities in his department of physiology
A few months later, Prof. Bill Davies (Lancaster university - UK) who accepted to be the base of this beautiful and revolutionary concept. He gave me all his faith and did stimulate all my energy correcting me the best he could.
I have tried to respect this feeling of honesty, humility and I have done my best to advance in this project.
No doubt that after all these years as said the famous philosopher Socrates reported by Plato:
“I know one thing; that I know nothing”.
Thank you, Perla, Matthew, Bill and of course friends, parents and all the ones who helped me in the achievement of this exciting work.
You are in my heart for ever and in my future projects.
V
Abstract
The need to accelerate the selection of crop genotypes that are both resistant to and productive under abiotic stress is enhanced by global warming and the increase in demand for food by a growing world population. In this thesis, a new method is proposed for evaluation of wheat genotypes in terms of their resilience to stress and their production capacity. The method quantifies the components of the new index related with yield and yield components under abiotic stress. The index method, based on a scoring scale, offers a simple and easy visualization and identification of resilient, productive genotypes, according to their yield and yield components. This new selection method could help breeders and researchers by defining clear and strong criteria to identify genotypes with high resilience and high productivity and to reveal where genotypes express their susceptibility to a stress environment, providing a quantitative classification of contrasts in terms of yield and yield components.
This index method has allowed 1) the identification of contrasting genotypes from a small population (CIMCOG-ROOT, 10 genotypes), and 2) the quantification of their contrasts, in terms of yield and yield components (grain number per spike), both constituting a key opportunity to test whether a stress hormone and/or hormone balance (ABA, ethylene and/or ABA/ethylene) could be used as a physiological trait for breeding for abiotic stress resilience. Due to the complexity of spatial and temporal variation of hormone accumulation (ABA and ethylene) and their different effects in plant development in response to stress environments, it is necessary to investigate how factors other than environment can influence the production of hormones. The factors considered in this work were: day time, water management (irrigation), tissue specificity (leaf and spike) and wheat phenological development (phenological stages). The present study of hormone (ABA and ethylene) quantification in wheat has shown that the genotypic variation in hormone signalling cannot be identified at every developmental stage of the plant. In fact, only two stages were identified for differences in ethylene emission (late-booting and heading), and two for ABA accumulation (late-(late-booting and half-emergence), both on leaf tissue. However, the ratio ABA/ethylene (ABA/ETH) emerges as a better method to study genotypic variation in response to stress environments, in terms of hormone accumulation. In fact, both tissues, leaf and spike at all stages during the pre-anthesis stage (from booting to heading), have shown significant genotypic variation in terms of ABA/ETH balance.
The resilience index of grain number per spike and this study of hormone (ABA and ethylene) quantification under drought stress (on leaf and spike), have shown that at late-booting stage, a lower leaf hormone ratio ABA/ETH and higher leaf ethylene emission is associated with a higher resilience of spike fertility (grain per spike resilience). However, under controlled conditions, a possible optimum threshold is observed in terms of leaf hormone ratio ABA/ETH. These results have been obtained with statistical significance in eight genotypes under field conditions and four genotypes under controlled environments.
VI
Table of Contents
Declaration ... II Acknowledgment ... IV Abstract ... V Table of Contents ... VI List of Figures ... X List of Tables ... XVIII Abbreviation list ... XXVII
Chapter 1. General Introduction ... 1
1.1. Climate change ... 1
1.2. Food supply and demand ... 1
1.3. Drought stress ... 3
1.4. How does drought stress affect yield during the pre-anthesis period? ... 5
1.5. Selection of drought-adapted genotypes... 6
1.6. Plant growth regulators ... 11
1.6.1. Abscisic acid ... 12
1.6.2. Ethylene ... 15
1.7. Research objectives and thesis structure ... 18
Chapter 2. A new crop screening method based on productivity and resilience to abiotic stress ... 20
2.1. Introduction ... 20
2.2. Materials and methods ... 24
2.2.1. Site of experiments ... 24
2.2.2. Experimental material and stress treatments ... 24
2.2.3. Selection of stress adapted genotypes within a population under field conditions 26 2.2.4. Basis of the development of the new stress indices and their uses ... 27
2.2.5. Why combine the indices? ... 28
2.2.6. How can the indices be combined, as their values are totally different? ... 29
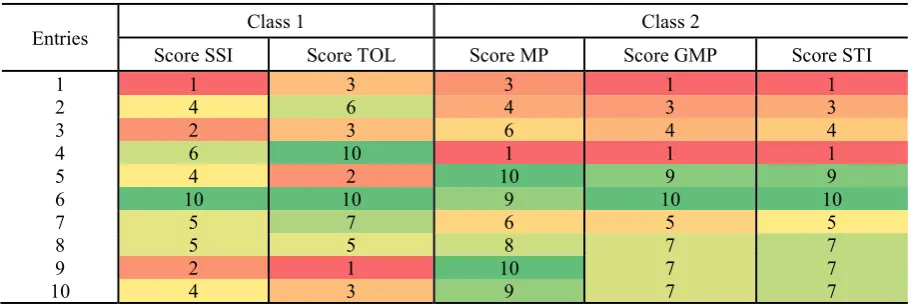
2.2.7. How to create the scoring scale? ... 30
2.2.8. Statistical analysis ... 31
2.3. Results ... 31
2.3.1. Testing the methodology and the score indices ... 31
2.3.2. How to combine the score indices? What is the best combination to define new indices? ... 32
VII
2.4.1. How can these indices be used to identify resilient and productive genotypes? ... 38
2.5. Conclusions ... 44
Chapter 3. New selection criteria to enhance understanding of the basis of physiological and developmental resilience to abiotic stress ... 46
3.1. Introduction ... 46
3.2. Materials and methods ... 51
3.2.1. Phenology ... 52
3.2.2. Determination of yield components and harvest processes ... 53
3.2.3. Adaptation of the stress indices based on yield components ... 54
3.2.4. Statistical Analysis ... 56
3.3. Results ... 56
3.3.1. Can yield components be expressed through score stress indices? ... 56
3.3.2. Comparison of yield and yield components between season and year ... 58
3.4. Discussion ... 59
3.4.1. T-SSI a useful tool to understand yield behaviour? ... 59
3.4.2. Comparison of yield and yield components between season and year ... 62
3.4.3. Can T-RCI and T-PCI increase understanding of the genetic basis of yield under stress? ... 65
3.4.4. Identifying contrasting genotypes for drought stress resilience using T-RCI. ... 69
3.5. Conclusion ... 73
Chapter 4. Preliminary experiments in controlled environments to define the field methodology for hormone sampling ... 75
4.1. Introduction ... 75
4.2. Materials and methods ... 78
4.2.1. ABA sampling and radioimmunoassay (RIA) ... 78
4.2.2. Ethylene sampling and quantification ... 79
4.2.3. Diurnal variation of hormone accumulation under well-watered conditions. ... 81
4.2.4. Ethylene production by plants re-watered after drought stress. ... 82
4.2.5. Statistical Analysis ... 84
4.3. Results ... 85
4.3.1. Diurnal variation of hormone accumulation under well-watered conditions. ... 85
4.3.2. Effect on the re-watering after a drought period ... 85
4.4. Discussion ... 87
4.4.1. Diurnal variation ... 87
4.4.2. Effect of re-watering after drought ... 88
VIII Chapter 5. Using plant hormone balance (ABA-ETH) as a physiological trait for drought
stress resilience. Defining key tissue(s) and phenological stage(s) ... 91
5.1. Introduction ... 91
5.2. Materials and methods ... 96
5.2.1. Sampling processes and hormone analysis under field conditions ... 98
5.2.2. Statistical analysis ... 100
5.3. Results ... 101
5.3.1. General analysis of hormones variation (ethylene and ABA) ... 101
5.3.2. Hormone quantification and genotypic variation along the phenological stages 102 5.3.3. Could hormone and/or hormone balance be a trait for drought stress resilience? .... ... 109
5.4. Discussion ... 111
5.5. Conclusion ... 120
Chapter 6. Leaf hormone quantification under controlled environment: a new physiological trait for spike fertility resilience to drought stress? ... 122
6.1. Introduction ... 122
6.2. Materials and methods ... 125
6.3. Results ... 129
6.3.1. Genotypic variation in hormone quantification at two distal phenological stages under controlled conditions ... 129
6.3.2. Could hormone quantification indicate resilience to drought stress when experiments are conducted under controlled environment conditions? ... 131
6.4. Discussion ... 133
6.5. Conclusion ... 140
Chapter 7. General conclusion and discussion ... 142
7.1. What is a stress tolerant genotype? ... 142
7.2. Hormones: a new physiological trait? Factors to be considered. ... 145
7.3. Diurnal variation in hormones: when to measure? ... 146
7.4. Measuring hormones during the crop life cycle: when and where? ... 147
7.5. Hormone: a trait for early selection, recommendation and limitation. ... 148
7.5.1. Recommendation for early selection ... 149
7.5.2. Limitation of hormone quantification for early selection ... 150
7.6. Does the cropping design for breeding selection need to be improved? ... 153
7.7. Impact of agronomic practice and field management on hormone balance and yield .. ... 153
IX Appendix 2A - Description of the formulae previously derived as indices of relative
performance of populations of crop genotypes under stress ... 156
Appendix 2B - Schematic model to explain why the combination of PCI and RCI improves the use of the previous indices ... 158
Appendix Chapter 3 ... 164
Appendix 3A - Verification of the expression of thousand grain weight by the productive and resilient component. ... 165
Appendix 3B: Could T-RCI and T-PCI give information about G x E interaction? ... 168
Appendix 3C: Where the susceptibility is expressed in term of yield components under heat stress ... 170
Appendix 3D: The use of T-RCI and T-PCI to validate actual physiological traits. Case of canopy temperature. ... 172
Appendix Chapter 4 ... 175
Appendix 4A - Protocol used to quantify indirectly sample fresh weight prior to ethylene measurement ... 175
Appendix 4B - Comparing the initial contrast selection with the index method ... 177
Appendix Chapter 5 ... 180
Appendix 5A - How to calculate the hormone ratio ABA/ETH ... 180
Appendix 5B - Field conditions during sampling ... 182
Appendix 5C - Complementary measurements under field conditions: Does phenological stage influence ethylene accumulation? ... 183
Appendix Chapter 6 ... 187
Appendix Chapter 7 ... 190
Appendix 7A - Speeding up ethylene quantification under field conditions ... 190
X
List of Figures
Chapter 2
Figure 2.1: Diagram showing the experimental planting on raised beds which were 80 cm wide with a 40 cm planting surface with four-row and 10 cm spacing between the rows. Planting density was 5g per m2. ... 26
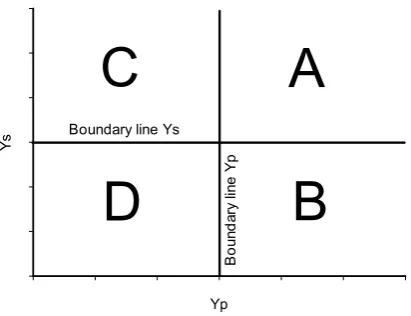
Figure 2.2: Representation of the different response groups (A, B, C, and D), defined by, according to their grain yield under abiotic stress conditions (Ys) and grain yield under yield potential conditions (Yp). Group A genotypes express uniform superiority in both stress and non-stress condition; group B genotypes express good performance only in yield potential and not under stress conditions; group C genotypes present a relatively higher yield only under stress; and group D genotypes express poor yield performance in both environments. The boundary lines (bold line) create the limit between one group and the others. The boundary line value corresponds to the yield value from a check under yield potential conditions (boundary line Yp) and yield under drought stress (boundary line Ys). ... 29
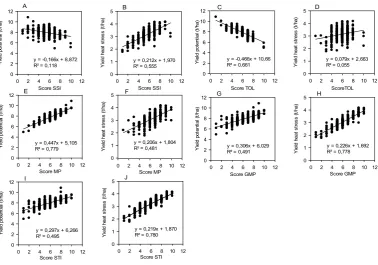
Figure 2.3: Linear regression and the coefficient of determination of the different score indices versus grain yield under non-stressed and heat stressed environments. Calculations use yield data from WAMI trial (294 genotypes) under heat stress and non-stress-conditions during the cropping season 2011-12: (A) Yield potential versus Score SSI; (B) Yield under heat stress versus Score SSI; (C) Yield potential versus Score TOL; (D) Yield under heat stress versus Score TOL; (E) Yield potential versus Score MP; (F) Yield under heat stress versus Score MP; (G) Yield potential versus Score GMP; (H) Yield under heat stress versus Score GMP; (I) Yield potential versus Score STI; (J) Yield under heat stress versus Score STI. ... 32
XI
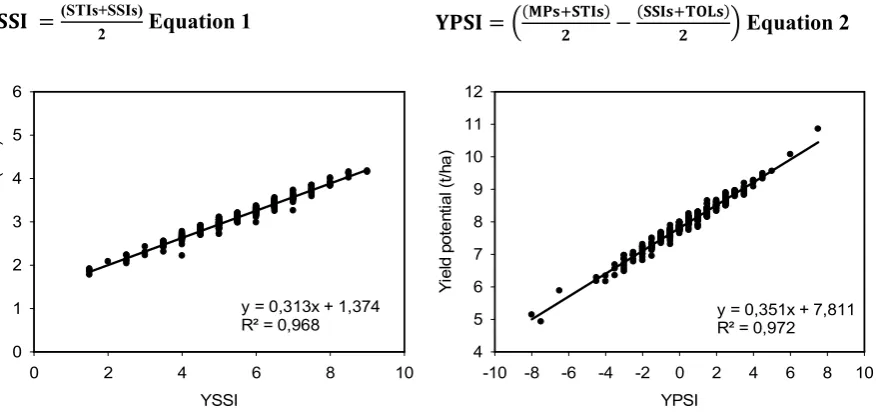
Figure 2.5: Linear regression and the coefficient of determination of grain yield under a yield potential environment (Yp) and the Yield Potential Score Index (YPSI). Calculations use yield data from WAMI trial (294 genotypes) under heat stress and non-stress conditions during the cropping season 2011-12. ... 34
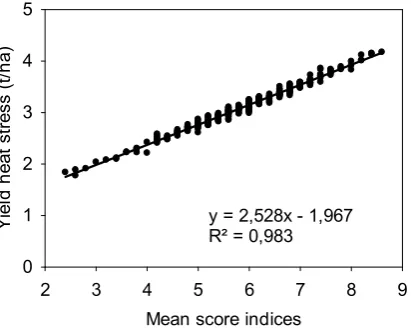
Figure 2.6: Linear regression and the coefficient of determination of grain yield under heat stress (Ys) and the mean score index. Calculations of the score indices use yield data from WAMI trial (294 genotypes) under heat stress and non-stress conditions during the cropping season 2011-12. ... 38
Figure 2.7: Schematic illustration of a particular case of two genotypes according to grain yield performance defined by Fernandez (1992): A) Schematic illustration of two genotypes from groups A and C with a similar grain yield value under stress (Ys) and different grain yield value under yield potential conditions (Yp), where: group A represents genotypes expressing uniform superiority in both stress and no-stress conditions, and group C represents genotypes expressing a relatively higher yield only under stress. B) Schematic representation of the distribution of values of the Production Capacity Index (PCI) and the Resilience Capacity Index (RCI) where genotypes A show a higher PCI compared with genotypes C, and vice versa, in terms of RCI. ... 40 Chapter 3
XII
Chapter 4
Figure 4.1: Mean soil moisture measured at the four different steps to quantify ethylene emission before, during and after a drought stress treatment (CE room). (Stp1): corresponds to initial ethylene status with no stress (day 1) and the last watering was performed 2 days before, (Stp2) corresponds to the ethylene quantification under drought stress (day 4), (Stp3) corresponds to the ethylene quantification three hours after re-watering (day 5), (Stp4) corresponds to the ethylene quantification one day and three hours after the re-watering (day 6). The days are counted from the first day of sampling. Measurement performed at the first 6 centimetres (measured with the Delta-T model HH2,UK). Bars represent means ± SE of 8 replicates, with different letters indicating significant (P<0.05) differences. ... 84
Figure 4.2: Wheat leaf hormone diurnal variation at three different times (8:30 am, 12:00 pm, 05:30 pm) of A) Ethylene emission and B) ABA accumulation under well-watered at tillering stage of four contrasting genotypes. T1 and T2 are the tolerant genotypes and S1 and S2 are the sensitive, in term of yield resilience under heat stress. Bars are means ± standard error of 6 replicates, with different letters indicating significant (P < 0.05) differences among the genotypes and times ... 85
Figure 4.3: Variation of Ethylene emission on leaf, before and after a drought, of four contrasting genotypes to heat stress, two tolerant (T3 and T4 – (A), (B), respectively) and two sensitive (S3 and S4 - (C) and (D), respectively). The ethylene emission is studied at four steps: (Stp1) corresponds to initial ethylene status with no stress (day 1), (Stp2) corresponds to the ethylene quantification with drought stress (day 4), (Stp3) corresponds to the ethylene quantification three hours after re-watering (day 5), (Stp4) corresponds to the ethylene quantification one day and three hours after the re-watering (day 6). The days are counted from the first day of sampling. Columns and bars are means ± standard error of 4 replicates with different letters indicating significant (P < 0.05) difference among the steps. ... 86
Chapter 5
XIII
Figure 5.2: Evolution of the production of A) Ethylene (ETH, nmol.gFw-1.h-1), and B) ABA (nmol.g Dw-1), in leaf (circle) and spike (triangle, spk) tissues under yield potential (closed symbols, Yp) and drought (open symbols, D) conditions along the phenological stages booting (Boot), late booting (L. Boot), half-emergence (1/2 Em) and heading (Hdg). Data were collected on eight genotypes from the CIMCOG-ROOT trial during the crop season 2013-2014 in Mexico, CENEB station. Figures are means ± standard error. ... 102
Figure 5.3: Genotypic variation on flag leaf ethylene emission rate (nmol.gFw-1.h-1) (A, C, E, G) and leaf ABA concentrations (nmol.g Dw-1) (B, D, F, H) under different environments (irrigated (Yp, dark bar) and drought stress (D, grey bar)) at different phenological stages: Booting (A and B), Late Booting (C and D), Half-Emergence (E and F) and Heading (G and H). Data were collected on 8 genotypes from CIMCOG-ROOT during the crop season 2013-2014. Columns and bars are means ± standard error of 6 replicates with different letters indicating significant (P < 0.05) difference among genotypes within an environment and only when significant differences exist between the genotypes. ... 104
Figure 5.4: Genotypic variation on spike ethylene emission rate (nmol.gFw-1.h-1) (A, C, E, G) and spike ABA concentrations (nmol.g Dw-1) (B, D, F, H) under different environment (irrigated (Yp, dark bar) and drought stress (D, grey bar)) at different phenological stages: Booting (A and B), Late-Booting (C and D), Half-Emergence (E and F) and Heading (G and H). Data were collected on 8 genotypes from CIMCOG-ROOT during the crop season 2013-2014. Columns and bars are means ± standard error of 6 replicates with different letters indicating significant (P < 0.05) difference among genotypes within an environment and only when significant differences exist between the genotypes. ... 106
XIV
Figure 5.6: Linear regression between the resilient capacity index of grain number per spike (G#/spk-RCI) vs (A) mean leaf ABA accumulation (nmol.g Dw-1), (B) mean leaf ethylene emission (nmol.gFw-1.h-1) and (C) mean leaf hormone ratio ABA/ETH at late booting stage. Numbers 1, 5, 6 and 8 represent the 4 contrasting genotypes of this population (1 and 8 resilient - 5 and 6 sensitive). Data were collected on CIMCOG-ROOT trial (8 genotypes) during the cropping season 2013-2014. ... 110
Chapter 6
Figure 6.1: Genotypic variation at late booting (A, B and C) and at heading (D, E and F) stages of leaf ethylene emission rate (A and D), leaf ABA concentrations (B and E) and hormone ratio ABA/ETH (C and F) under controlled environment for the well-watered (WW, dark bars) and water-stress (WS, grey bar) treatments. Data were collected on four genotypes from the CIMCOG-ROOT trial (10 genotypes). Columns and bars are means ± standard error of 6 replicates. Different letters indicate significant (P < 0.05) difference among genotypes within an environment only when such differences exist between the genotypes. ... 130
Figure 6.2: Polynomial regression between (A) the mean leaf ethylene emission rate (nmol.gFw-1.h-1), and (B) the mean leaf hormone ratio under water stress (WS) versus the resilience capacity index of grain number per spike (G#/spk-RCI) of the four selected genotypes (1, 5, 6, 8) from CIMCOG-ROOT trial. ... 133
Chapter 7
Figure 7.1: Linear regression between spike dry weight (g) and grain number per spike (G#/spk), under controlled conditions: A) well-watered treatment (WW) (n=32), and B) water-stress treatment (WS) (n=30). Spikes from four genotypes selected from the CIMCOG-ROOT trial. ... 150
XV
Appendix 2
Appendix 2 Figure 1: Schematic illustration of the position of the different groups defined by Fernandez (1992) as a function of Yp or Ys versus PCI or RCI: (A) PCI versus Yp; (B) PCI versus Ys; (C) RCI versus Yp, and (D) RCI versus Ys. ... 158
Appendix 2 Figure 2: Schematic illustration of the classification of the different groups defined by Fernandez (1992) over the linear regression (A) Yp versus YPSI (B) Ys versus YSSI. ... 159
Appendix 3
Appendix 3 Figure 1: Linear regression between temperature taken between 11 and 12 am on CIMCOG-ROOT at anthesis versus a) yield under drought stress b) the resilience of grain number per square meter (G#/m2-RCI). Temperatures are mean of two following days of measurements. ... 173
Appendix 4
Appendix 4 Figure 1: Correlation between the direct fresh weights measured before incubation following the method described in Wilkinson and Davies (2009) and the weighing tube method which consists to calculate the difference between the weight of tubes enclosing the fresh plant material with the saturated filter paper and the tubes enclosing only the saturated filter paper. ... 176
XVI
Appendix 5
Appendix 5 Figure 1: Linear regression between the hormone ratio calculated from the average concentration of ABA and ethylene (AVG (ABA) / AVG (ETH)) per genotype, tissue, phenological stage and environment and the average of the individual ratio between ABA and ethylene calculated by each individual ABA concentration value divided by each individual ethylene emission rate value per genotype, tissue, phenological stage and environment (AVG (ABA / ETH). Calculated on data from CIMCOG-ROOT (8 genotypes) trial during the cropping season 2013-2014 under stress and irrigated environments. ... 181
Appendix 5 Figure 2: Mean temperature (dark circle) and relative humidity (open circle), A) for the field trial under yield potential conditions from day 62 after emergence (DAE)- booting stage - to DAE 85 - heading stage, B) for the field trial under drought stress conditions from DAE 58 - booting stage- to DAE 76 - heading stage -. The mean corresponds to the time the measurement was taken from 01:00 pm to 03:30 pm. ... 182
Appendix 5 Figure 3: Comparison of ethylene production on leaf and spike sampled the same day at the same time in the same plot under yield potential (Yp) at two close phenological stages. Two cases show the ethylene variation on leaf and spike between (1) booting (Boot) and late-booting (L. Boot) stage with genotypes (A) G2 and (B) G4 and (2) between heading (Hdg) and anthesis (Anth) with (C) G9 and (D) G10. Columns and bars are means ± standard error of 6 replicates. Different letters indicate significant difference within tissue (P < 0.05). ... 185
XVII
Appendix 6
XVIII
List of Tables
Chapter 2
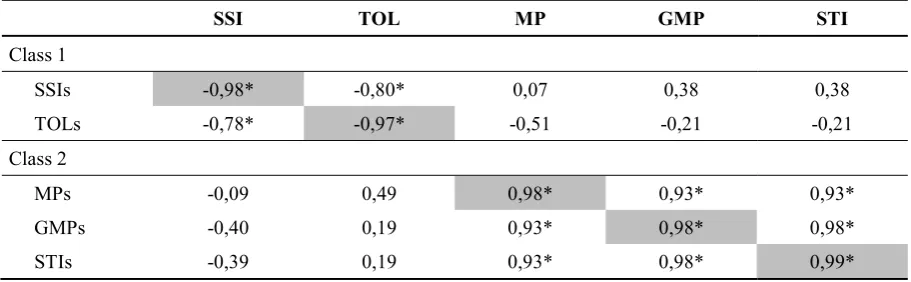
Table 2.1: Summary of the interpretation of tolerances according to the previously developed indices (stress susceptibility index (SSI), tolerance index (TOL), mean productivity index (MP), geometric mean productivity index (GMP) and stress tolerance index (STI)) and their failures to distinguish the different response groups of plants defined by Fernandez (1992). Group A genotypes express uniform superiority in both stress and non-stress conditions; group B genotypes express good performance only in yield potential but not under stress conditions; group C genotypes present a relatively higher yield only under stress; group D genotypes have poor yield performance in both environments. Classes 1 and 2 correspond to susceptibility indices and tolerance indices, respectively, where class 1 tends to distinguish between the stress- tolerant and the stress-susceptible genotypes and class 2 tends to identify genotypes with stress tolerance and high average yield. ... 23
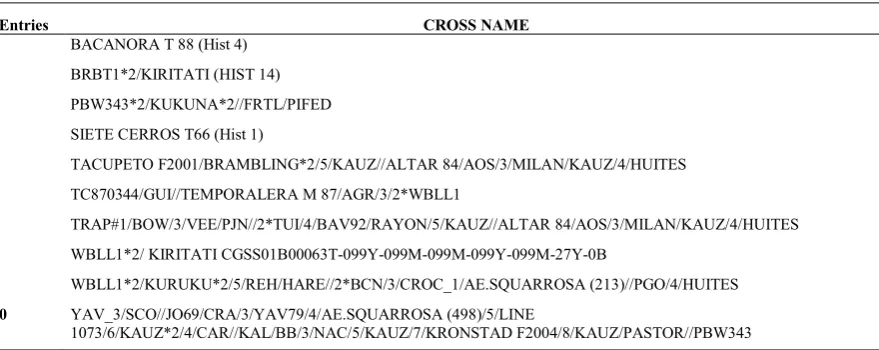
Table 2.2: Name of the wheat genotypes or cross name of the CIMCOG-ROOT trial. ... 25
Table 2.3: Pearson correlation coefficient between the score indices defined in this paper (SSIs, TOLs, MPs, GMPs, STIs) and their original indices (SSI, TOL, MP, GMP, STI) defined by the original authors, calculated on yield data from the WAMI trial (294 genotypes) under heat stress and non-stress environments. SSI and TOL show a negative correlation with SSIs and TOLs, respectively, as the score scale has been inverted. *P<0.05. ... 31
XIX
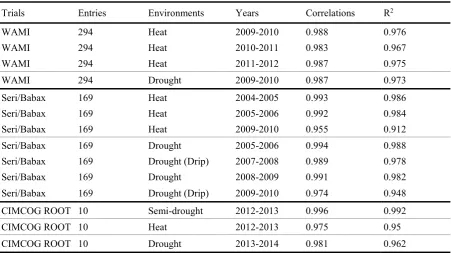
Table 2.5: Summary table showing the Pearson correlation coefficient and coefficient of determination (R2) of Yield Stress Score Index (YSSI) versus yield under stress (Ys) from multiyear populations (WAMII, Seri/Babax, CIMCOG-ROOT) previously studied in CIMMYT under different abiotic stresses (heat, drought, drought under drip; semi-drought: drought applied at booting stage). The consistency of correlations demonstrates the reliability of the index. ... 36
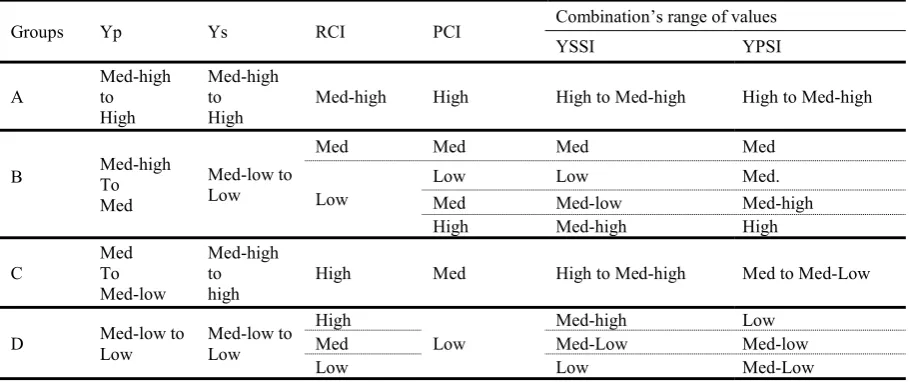
Table 2.6: Summary of the values expected for the different index scales within a population and the impact of their combination as YSSI and YPSI. A unique combination of the Resilience Capacity Index (RCI) and the Production Capacity Index (PCI) values differentiates the four response groups of plants (A, B, C and D) defined by Fernandez (1992), according to Yield Stress Score Index (YSSI) and Yield Potential Score Index (YPSI) values. Group A genotypes express uniform superiority under both stress and no-stress conditions; group B genotypes express good performance only under yield potential but not under stress conditions; group C genotypes present a relatively higher yield only under stress and group D poor yield performance under both environments. Yp: grain yield under yield potential conditions, Ys: grain yield under stress conditions ... 39
Table 2.7: Values of the Resilience Capacity Index (RCI), the Production Capacity Index (PCI), and the result of their combination as the Yield Stress Score Index (YSSI) and the Yield Potential Score Index (YPSI). Values are calculated using the grain yield data from the CIMCOG-ROOT trial (ten genotypes) under yield potential conditions and heat stress, for the 2012-13 cropping season (Y12-13). ... 41
Chapter 3
XX number of grains per spikelet, Spklt#/spk: number of spikelets per spike) * P < 0.05; ** P < 0.01 ... 57
Table 3.2: Pearson correlation coefficient between the yield components score indices (Yield-SSI, TGW-(Yield-SSI, G#/m2-(Yield-SSI, G#/spk-(Yield-SSI, Spk#/m2-SSI, G#/spklt-SSI, Spklt#/spk-SSI) and their original value (yield, TGW, G#/m2, G#/spk, Spk#/m2, G#/spklt, Spklt#/spk) obtained in the field, calculated on yield and yield components data from the CIMCOG-ROOT trial under semi-drought stress during the crop season 2012-2013 (10 genotypes). Semi-drought stress means that water supply was stopped at 65 days after emergence. (TGW: thousand grain weight, G#/m2: number of grains per square meter, G#/spk: number of grains per spike, Spk#/m2: number of spikes per square meter, G#/spklt: number of grains per spikelet, Spklt#/spk: number of spikelets per spike). * P < 0.05; ** P < 0.01 ... 57
Table 3.3: Pearson correlation coefficient between the yield components score indices (Yield-SSI, TGW-(Yield-SSI, G#/m2-(Yield-SSI, G#/spk-(Yield-SSI, Spk#/m2-SSI, G#/spklt-SSI, Spklt#/spk-SSI) and their original value (yield, TGW, G#/m2, G#/spk, Spk#/m2, G#/spklt, Spklt#/spk) obtained in the field, calculated on yield and yield component data from the CIMCOG-ROOT trial under drought stress (10 genotypes) during the crop season 2013-2014. Drought stress means that the last water supply was applied when 50% of the plot have reached emergence. (TGW: thousand grain weight, G#/m2: number of grains per square meter, G#/spk: number of grains per spike, Spk#/m2: number of spikes per square meter, G#/spklt: number of grains per spikelet, Spklt#/spk: number of spikelets per spike). * P < 0.05; ** P < 0.01 ... 57
Table 3.4: Comparison of the score value on yield components under three different stresses, drought stress (D), heat (H) and semi-drought (SD). The colour scale is made into each environment and green shows the highest observed value, yellow is a medium value and the red value, the lowest. (Ys: yield under stress, YSSI: yield stress score index, SSI: stress score index, TGW: thousand grain weight, G#/m2: number of grains per square meter, G#/spk: number of grains per spike, Spk#/m2: number of spikes per square meter)... 59
XXI
Table 3.6: Pearson coefficient correlation (r) and coefficient of determination (r2) on the different yield components under yield potential (Yp) versus each stress environment (H, D, SD). The letter “p” and “s” at the end of each yield component correspond to the value obtained under yield potential and the value obtained under the respective stress (D, H, SD), respectively. (TGW: thousand grain weight, G#/m2: number of grains per square meter, G#/spk: number of grains per spike, Spk#/m2: number of spikes per square meter, G#/spklt: number of grains per spikelet, Spklt#/spk: number of spikelets per spike). *P< 0.05 ... 61
Table 3.7: Table Pearson coefficient of correlation (r) and coefficient of determination (r2) between the two major yield components, thousand grain weight (TGW) and grains per square meter (G#/m2), and the first two sub-components of G#/m2, number of spikes per square meter (spk#/m2) and number of grains per spike (G#/spk). TGW and G#/m2 show significant correlation across the different environments with the exception of TGW under heat and semi-drought. ** P<0.01, * P<0.05. ... 64
Table 3.8: Pearson coefficient of correlation (r) and coefficient of determination (r2) between yield under three different stress environments, drought (Y-D, table A), heat (Y-H, table B) and semi-drought (Y-SD, table C) versus the production capacity index of (1) yield (Y-PCI), (2) thousand grain weight (TGW-PCI), (3) grain number per square meter (G#/m2-PCI), (4) spike number per square meter (Spk#/m2-PCI) and (5) grain number per spike (G#/spk-PCI). *P < 0.05; ** P< 0.01. ... 65
Table 3.9: Pearson coefficient of correlation (r) and coefficient of determination (r2) between yield under three different stress environments, drought (Y-D, table A), heat (Y-H, table B) and semi-drought (Y-SD, table C) versus the resilience capacity index of (1) yield (Y-RCI), (2) thousand grain weight (TGW-RCI), (3) grain number per square meter (G#/m2-RCI), (4) spike number per square meter (Spk#/m2-RCI) and (5) grain number per spike (G#/spk-RCI). *P < 0.05; ** P< 0.01. ... 66
XXII
Table 3.11: Summary table of the components of the trait stress score index, the trait resilience capacity index (T-RCI) (left table) and the trait production capacity index (T-PCI) (right table) under drought stress, during the cropping season 2013-14. Genotypes are grouped by pairs of contrast on yield resilience for the first four genotypes and the other four are grouped by their resilience on yield and/or grain number per m2 (Data from CIMCOG-ROOT - 10 genotypes). (Ys: yield under stress, TGW: thousand grain weight, G#/m2: number of grains per square meter, Spk#/m2: number of spikes per square meter and G#/spk: number of grains per spike) ... 71
Chapter 5
Table 5.1: Summary table of the trait resilience capacity index (T-RCI) under drought stress calculated on yield (Y), thousand grain weight (TGW), grain number per square meter (G#/m2), spike number per square meter (Spk#/m2) and grain number per spike (G#/spk), during the cropping season 2013-14. (Data from CIMCOG-ROOT - 8 genotypes). ... 97
Table 5.2: Table of Pearson coefficient correlation between the Resilient Capacity Index (RCI) calculated on yield and yield components versus mean flag leaf ABA concentration, mean ethylene production and the mean ratio ABA/ETH under drought stress. RCI: resilient capacity index, Y: yield, TGW: thousand grain weight, G#/m2: grain number per m2, Spk#/m2 spike number per square meter, G#/spk: grain number per spike, at the different stages (booting, late-booting, half-emergence and heading) where genotypes have shown significant differences with the leaf hormone accumulation (ABA, ethylene) and hormone ratio ABA/ETH. * P<0.05, **P<0.01. ... 109
XXIII
Chapter 6
Table 6.1: Number of spikes collected from four genotypes (entries) under well-watered and water-stress conditions, in the greenhouse, to estimate the yield components. Spikes from tillers that showed total sterility under well-watered conditions were not included in these calculations. ... 128
Table 6.2: Score table of the resilient capacity index calculated on thousand grain weight (TGW-RCI), grain number per spike (G#/spk-RCI), grain number per spikelet (G#/spklt-RCI) and spikelet number per spike (Spklt#/spk-RCI), calculated with the mean value of each yield components obtained under well-watered (WW) and water-stress (WS) treatments of four contrasting genotypes under controlled environment. ... 129
Table 6.3: Pearson coefficient correlation between the Resilience Capacity Index (RCI) calculation based on yield components (TGW: thousand grain weight, G#/spk: grain number per spike, G#/spklt: grain number per spikelet, spklt#/spk: spikelet number per spike versus flag leaf ABA concentration, ethylene emission rate and the hormone ratio ABA/ETH at late booting stage and the ratio ABA/ETH at heading under drought stress. The indices have been calculated with the data collected under controlled environment (well-watered and water stress). * indicates P<0.05, ** indicates P<0.01. ... 132
Appendix 2
Appendix 2 Table 1: List of the different score index combinations assessed to identify the best correlation with grain yield under yield potential and stress conditions. ... 160
Appendix 2 Table 2: Pearson coefficient between index combinations (Appendix 2 Table 1) and grain yield under yield potential and heat stress conditions during the cropping season 2012-13 on the CIMCOG-ROOT trial (10 genotypes). * P<0.05 ... 161
XXIV
Appendix 2 Table 4: Pearson coefficient between index combinations (Appendix 2 Table 1) and grain yield under yield potential and heat stress conditions during the cropping season 2012-13 on the WAMI trial (294 genotypes). * P<0.05 ... 163
Appendix 3
Appendix 3 Table 1: Zadoks´scale (reproduced from Pask et al., 2012) ... 164
Appendix 3 Table 2: Pearson coefficient of the correlation between thousand grain weight under heat stress (TGWh) versus 1) thousand grain weight under yield potential (TGWp), 2) thousand grain weight resilience capacity index (TGW-RCI), 3) thousand grain weight production capacity index (TGW-PCI), 4) trait stress score index calculated on TGW (T-SSI, Equation 4 ((TGW-RCI+TGW-PCI)/2)) and 5) the adapted trait stress score index calculated on TGW (Equation 5 ((TGW-RCI+2*TGW-PCI)/3)) in data from WAMI (294 genotypes) under heat stress for the crop season 2011-12 (Y11-12). ** P<0.01. ... 165
Appendix 3 Table 3: Value of the resilient capacity index of the different yield components (Trait-RCI) and the production capacity index of the different yield components (Trait-PCI) under the different stresses Heat stress (H) (crop season 2012-2013), Drought stress (D) (crop season 2013-2014) and semi-drought stress (SD) (crop season 2012-2013) from the CIMCOG-ROOT trial. This table shows the constancy of the index along the years and between the stresses. ... 166
Appendix 3 Table 4: Pearson coefficient of correlation (r) and coefficient of determination (r2) of the production capacity index of thousand grain weight (TGW-PCI), grain number per square meter (G#/m2-PCI), spike number per square meter (Spk#/m2-PCI) and grain number per spike (G#/spk-PCI ) versus the different stress environments Heat (H) Drought (D) and Semi-Drought (SD). ** p<0.01 * p<0.05. Calculated on CIMCOG-ROOT (10 genotypes). ... 168
XXV
Appendix 3 Table 6: Summary table of the components of the trait stress score index, the trait resilience capacity index (T-RCI) (left table) and the trait production capacity index (T-PCI) (right table) under heat stress, during the cropping season 2012-13. Genotypes are grouped by pairs of contrast on yield resilience for the first four genotypes and the other four are group by their resilience on yield and/or grain number per m2 (Data from CIMCOG-ROOT - 10 genotypes). (Ys: yield under stress, TGW: thousand grain weight, G#/m2: number of grains per square meter, Spk#/m2: number of spikes per square meter and G#/spk: number of grains per spike) ... 170
Appendix 4
Appendix 4 Table 1: Index score table for four previously selected contrast genotypes where T1 and T2 represent the tolerant genotypes and S1 and S2 the sensitive ones based on the yield response to heat stress. Yield data, used to calculate the score indices, came from a combined analysis of two following seasons (season 2010-2011 and 2011-2012) from CIMCOG trial (60 genotypes) under heat stress. The table shows the score value of the resilience and productivity index in terms of yield (Y-RCI and Y-PCI, respectively). ... 177
Appendix 4 Table 2: Index score table for four previously selected contrast genotypes where T3 and T4 represent the tolerant genotypes and S3 and S4 the sensitive ones based on the yield response to heat stress. Yield and yield components data, used to calculate the score indices, came from a combined analysis from sub-set of CIMCOG trial (30 genotypes) under heat stress. The table shows the score value of the resilience and production capacity index in terms of yield (Y-RCI and Y-PCI, respectively). ... 178
Appendix 6
XXVI
XXVII
Abbreviation list
[3H]-ABA Isotope 3H-labelled ABA
[ABA] Abscisic acid concentration
[ETH] Ethylene concentration
ABA Abscisic acid
ABA-GE ABA-glucose ester
ACC 1-aminocycopopane-1-carboxylic acid
ACO ACC-oxidase
ACS ACC-synthase
At Anthesis
AtBG1 Arabidopsis thaliana β-glucosidase 1
BGF Beginning of grain filling
Boot Booting
CE Controlled environments
CIMCOG CIMMYT core germplasm
CK Cytokinin
CT Canopy temperature
D Drought stress
DAE Day after emergence
DR Double ridge
Em Emergence
ETH Ethylene
FI Floret initiation
Fw Fresh weight
FY Farm yield
G x E Genotype–environment interaction
G#/m2 Grain number per square meter
G#/spk Grain number per spike
G#/spklt Grain number per spikelet
GN Grain number
GS1 Growth stage 1
GS2 Growth stage 2
GS3 Growth stage 3
GW Grain weight
H Heat
Hdg Heading
IPM Integrated pest management
nl Nanoliters
PBS Phosphate-buffered saline
XXVIII
PCI Production capacity index
PGR Plant growth regulators
PSY Phytoene synthase
PY Potential yield
RC Resilience capacity
RCB Randomized complete block
RCI Resilience capacity index
SD Semi-drought
SF Spike fertility
SI Stress intensity
Spk#/m2 Spike number per square meter
Spklt#/spk Spikelet number per spike
SSI Stress susceptibility index
STI Stress tolerant index
TGW Thousand grain weight
T-PCI Trait production capacity index
T-RCI Trait resilience capacity index
TS Terminal spikelet
T-SSI Trait score stress index
WAMI Wheat Association Mapping Initiative
WS Water stress
WW Well-watered
Yp Yield potential
YPSI Yield potential score index
Ys Yield under stress conditions
1
Chapter 1.
General Introduction
1.1. Climate change
The Fifth Assessment report from the Intergovernmental Panel on Climate Change (IPCC) has projected that by 2100 the increase in global mean temperature will be between 1.8 and 4.0 °C, depending on the level of the greenhouse gas emission. If, for example, the atmospheric CO2 concentrations stabilise around 450 ppm then the global mean temperature is predicted to rise by around 2-3 °C (Pachauri et al., 2015). In the worst case, if the global economy and human population continue growing at their current rates the increase would be bigger (maybe up to 6.4°C) (Pachauri et al., 2015).
Based on different models and adopting a probabilistic approach, global climate changes, are expected to cause significant restrictions on production of the three main cereal crops (rice, maize and wheat), associated with increases in temperature and drought stress (Lobell and Field, 2007; Tebaldi and Lobell, 2008). Plant growth and development are both adversely affected by increased temperatures and soil water deficiency (Barnabás et al., 2008).
1.2. Food supply and demand
2 In the mid-1960s, the introduction of new semi-dwarf wheat varieties resulted in a drastic yield increase of this crop. This sudden yield increase is now widely known as the “green revolution” which averted the development of widespread hunger and starvation in Asia. Nevertheless, during the last decade, the progress (gain) in wheat yield potential has been limited (Fischer and Edmeades, 2010). Since the green revolution, the genetic gain in yield potential (Yp) has been around an average of 1% per year with the introduction of modern wheat varieties (Reynolds et al., 1996; Sayre et al., 1997; Abbate et al., 1998; Araus et al., 2004), which is actually lower than the predicted annual increase in global food demand (Reynolds et al., 2009). A more recent analysis showed that genetic gains in Yp, during the last 30 years, may have fallen to 0.3% and 0.6% per year, in the UK and Mexico (CIMMYT) respectively (Fischer and Edmeades, 2010).
3
1.3. Drought stress
Drought is a normal, recurring characteristic of climate; it occurs in virtually all climatic zones including high and low rainfall areas (Wilhite and Glantz, 1985; Wilhite, 2010). Wilhite (2010) has pointed out that there is a difference between drought and aridity. Aridity is a permanent characteristic of climate and is restricted to low rainfall areas while drought is considered as a temporary aberration of climate and is mostly related to the reduction in the amount of precipitation received over an extended period of time, such as a season or a year (Mishra and Singh, 2010; Wilhite, 2010). However, other factors play a significant role in the occurrence of droughts such as low relative humidity, high temperatures, strong winds and the distribution, intensity and duration of rain throughout the cropping season (Mishra and Singh, 2010). A unique definition of drought does not exist and it is generally classified into four categories depending on the perspective of the different disciplines: meteorological, agricultural, hydrological and socio-economic (Wilhite and Glantz, 1985). Agricultural drought is usually linked to the reduction of soil moisture caused by a decrease of the frequency and intensity of rain and abnormally high evapotranspiration which result in reducing plant growth and production (Wilhite and Glantz, 1985; Mishra and Singh, 2010).
4 availability is calculated by the difference between the field capacity (when the soil after saturation of water has drained away below the root zone) and the permanent wilting point which is the minimal point of soil moisture the plant requires not to wilt (Brouwer et al., 1985). In the literature, different terms can be found to describe a drought stress, no stress (well-watered plant), mild or moderate stress and severe stress. However, there is no specific scale which identifies the range of these classes of drought stress. The degree of plant water deficit generated by a drought is associated with its water demand which fundamentally depends on weather conditions, the plant’s biological characteristics, the specific growth stage, and the physical and biological properties of the soil (Wilhite and Glantz, 1985; Mishra and Singh, 2010). A proper definition of agricultural drought should take into account the plant’s water status and the variable susceptibility of crops during different phenological stages, from emergence to maturity (Wilhite and Glantz, 1985).
In the soil-plant system, the water uptake from soil by the roots is mainly driven by the water potential gradient (soil to plant (root)) and the water always moves from high water potential to a low water potential (Kramer and Boyer, 1985; Kirkham, 2005). Water potential is a negative scale, the highest value is zero (pure water) and for the permanent wilting point, the soil water potential is around -1.5 MPa for most plants (Kramer and Boyer, 1985; Kirkham, 2005).
5 water status than the plant water potential. However, the estimation of RWC shows some sources of error: (i) changes in dry weight (mainly due to respiratory losses), (ii) increases in water content in excess of full turgidity, and (iii) water accumulation in intercellular spaces (Barrs and Weatherley, 1962; Pask et al., 2012). Also, plant growth, development and functioning is influenced by plant water potential which can vary substantially while water content does not always change so significantly. Ehrler et al. (1978) stated that the canopy temperature, in wheat, is often a good indicator of the plant water potential (temperature difference between plant canopy and air).
1.4. How does drought stress affect yield during the pre-anthesis period?
The potential grain number on a wheat plant is determined during the early stages of plant development, a critical period which is highly sensitive to abiotic stress (e.g. heat and/or drought). Drought, in a wheat crop, during the development of the young microspore stage of the pollen (Dolferus et al., 2011) (which starts at booting stage) is a particular problem (Acevedo et al., 2002). During the pre-anthesis period, it has been reported that an increase in the setting of grains (i.e., grain number) can be obtained by extending the duration of stem elongation and the spike growth periods, a change that improves the floret survival (Miralles et al., 2000; González et al., 2011). It has been suggested that a better understanding of the physiological and molecular processes leading to pollen abortion induced by the stress may be key elements to allow a good setting of grains and development of a high grain number under stress conditions (Dolferus et al., 2011).
6 (2010) suggested that pollen sterility may be the main cause of grain loss in wheat during drought conditions, especially when the abiotic stress coincides with meiosis. Therefore, the identification of contrasting germplasm, tolerant and susceptible, for reproductive stage stress responses should enable us to identify the molecular basis of the resilience mechanism (Dolferus et al., 2011).
1.5. Selection of drought-adapted genotypes
Addressing the negative impact of climate change on crop yield and also the increasing food demand, the main target of wheat yield breeding and pre-breeding programmes is to improve grain yield by identifying and creating new varieties. However, it is important to keep in mind that breeding and genetic gains in the last decade, have been responsible for only a 30% to 50 % of the yield improvements achieved, while the other 50% has come from improvement in field management and agronomic practices (Araus et al., 2004; Richards, 2006).
7 However, Ceccarelli and Grando (1991) suggested that it may be better to select genotypes under the target environments, in order to increase the selection efficiency and therefore to more rapidly discover new genotypes adapted to severe stress. Additionally, Blum (1996) explained that often a negative relationship is expressed between high yielding genotypes under non-stress conditions (yield potential) and their drought resistance when the stress is sufficiently severe but some rare exceptions to this generality do exist. At the present time, there is no really effective means of screening for these exceptional genotypes which show combined high yield and tolerance to stress environments.
Slafer and Araus (2007) point out that the identification of physiological traits indicating simultaneously high yield potential and tolerance to stress would be critical to yield improvement. Up to now, significant progress in the understanding of the physiology of the wheat plant shows a high potential to boost wheat productivity. Three main targets which may help to increase yield potential have been highlighted: 1) an increased efficiency of carbon gain, 2) the increasing spike fertility and the partitioning of assimilates to the growing spike and grains, and 3) an improvement of lodging resistance of these genotypes with bigger spikes (Reynolds et al., 2009; Parry et al., 2011; Foulkes et al., 2011).
8 However, in work of this kind, the drought resistant ideotype is not always well defined and traits which might deliver high productivity under drought are not always clear (Blum, 2005). In fact, the concepts of drought tolerance as set out in the literature can differ significantly. The ecological definition of drought resistance is the ability to stay alive during periods of water scarcity ( Turner, 1979). Alternatively, for crop species, drought tolerance is defined as the ability of plants to grow and reproduce satisfactorily while producing harvestable yield with limited water supply or under periodic water deficit (Turner, 1979; Fleury et al., 2010). It has also been suggested that rather than grain yield under stress, yield stability is a better indicator of genotypic drought-resistance (Blum et al., 1989). In terms of physiological mechanisms, the drought resistance is often considered as a compromise between ‘dehydration avoidance’ and ‘dehydration tolerance’ both of which can have variable impacts on yield (Fischer and Maurer, 1978; Turner, 1979, 1986; Levitt, 1980). Therefore, to identify new key mechanisms involved in delivering a combination of high crop productivity and stress resilience, there is a need to define and properly characterise what it is meant by the term ‘stress tolerant genotype’.
9 Monneveux et al. (2012) an ideal secondary physiological trait should be: (1) genetically associated with grain yield under drought; (2) genetically variable; (3) highly heritable; (4) easy, inexpensive and quick to be measured or observed; (5) non-destructive; (6) stable over the measurement period; and (7) not associated with yield penalties under favourable conditions. This last condition may be a problem as many authors now report opposing effects of traits depending upon the severity of stress (see e.g. Tardieu, 2012). Traits showing a positive impact on yield under severe stress often show a negative effect under milder stress or vice
versa (Tardieu, 2012). Therefore, it is commonly proposed that selected traits should be
associated with the likely drought scenario for the crop or the target environment.
Recent advances in data processing has increased the applications in remote sensing technologies, under field and control environment, that allows the development of rapid and non-destructive method for high-throughput phenotyping (Leinonen and Jones, 2004; Jones et al., 2007; White et al., 2012; Araus and Cairns, 2014; Tattaris et al., 2016). For example, canopy temperature which is an interesting secondary physiological trait for selection as the measurement is quick, simple, inexpensive (Cossani et al., 2012). Canopy temperature can be measured remotely by the use of hand-held infrared thermometer (IRT) without interfering with the crop (Pask et al., 2012). However, there is still an issue in the sensitivity of the measurement to the environment. Largely windless and cloud-free days are required to obtain reliable data (Cossani et al., 2012).
10 at the same time (Araus and Cairns, 2014; Reynolds et al., 2015; Tattaris et al., 2016). Additionally, remote sensing technologies offer more opportunities for detecting different stresses affecting crops even before the appearance of visual symptoms (Chavez et al., 2009; Chávez et al., 2010).
Yield is a complex trait as it is formed continuously from sowing to harvest and almost all a plant genes are involved in a direct or indirect way to produce the grain yield (Slafer, 2003). Therefore, the final yield of a crop will be the result of a balance of complex processes leading to growth and development. Most of these will be highly influenced by an interaction with different environmental factors (GxE) (Slafer, 2005). Instead of using yield as a trait itself, to study the GxE interaction, Slafer (2003) recommends a focus on more simple traits which compose yield. The most popular approach, used by crop scientists, agronomists and breeders, is to divide yield into yield components, where the two major components are the weight of an individual grain (sometimes expressed as thousand grain weight (TGW)) and the number of grains per square meter (G#/m2) (Slafer, 2003, 2005).
11
et al., 2006a; Hays et al., 2007; Wilkinson et al., 2012; Davies et al., 2013). For example, in
rice a gene coding for cytokinin oxidase has been identified to increase panicle fertility. In fact, the cytokinin oxidase leads to an accumulation of cytokinin in inflorescence meristems and increases the number of reproductive organs (Ashikari et al., 2005).
1.6. Plant growth regulators
In the recent past, plant hormones have received a great attention from physiologists and developmental biologists owing to their multifunctional roles as effectors of plant functioning, growth and development. In addition, hormones can play a key role in mediating the plants’ responses to abiotic stress (Davies, 2004a; Santner and Estelle, 2009; Colebrook et al., 2014; Kumar et al., 2016). By regulating the production, distribution or signal transduction of hormones, plants are able to regulate and coordinate both growth and/or stress tolerance to promote stress survival or an escape strategy (Colebrook et al., 2014). There are currently five major classes of plant hormones: auxins, gibberellins (GAs), cytokinins, abscisic acid (ABA) and ethylene (Davies, 2004b; Hopkins and Hüner, 2008), each of which is characterized as being effective at low concentrations to regulate many aspects of plant growth and development (Davies, 2004b; Hopkins and Hüner, 2008).
12
1.6.1. Abscisic acid
Abscisic acid (ABA) was identified and characterized by Frederick Addicott and his associates in the 1960s (Ohkuma et al., 1963). They thought initially that ABA has an effect on the abscission of cotton bolls and called it "abscisin II", while, at the same time, the group of Philip Wareing identified a role for the hormone in bud dormancy and called it "dormin"(Doorenbos, 1953). When the chemical structures of dormin and abscisin II were compared, the hormone was renamed ABA and the name was retained in spite of discovering that ethylene was the hormone with a controlling influence on abscission of different plant parts (Wasilewska et al., 2008; Vankova, 2012).
13 ABA may also promote primary root elongation allowing plants to access water which is deeper in the soil profile (Sharp and LeNoble, 2002). It was initially thought that the plant water status was solely responsible for the control of the plant response (stomatal behaviour, reducing leaf expansion) to water stress scarcity, but it is now well accepted that the plant response to soil drying can be observed without any changes in the water status and that chemical signalling can be a key under many circumstances, i.e., ABA signalling (Wilkinson and Davies, 2002). Under reduced water availability ABA concentration is enhanced in all parts of the plant such as roots, xylem sap and leaves (Davies and Zhang, 1991; Puértolas et al., 2013). It has been proposed that ABA is a long distance signal in the plant, moving from root to shoot (Davies et al., 2002, 2005). The large quantities of ABA synthesised in the leaf are undoubtedly sufficient to induce stomatal closure (Finkelstein, 2013; Hu et al., 2016) and this local production can be the main contributor to stomatal closure under drought (Manzi et al., 2015; McAdam et al., 2016) but is still possible that the circulation of ABA in the stele provides the shoot with a ‘measure’ of the edaphic conditions around the root and the root physiological status (Hartung
et al., 2002; Hu et al., 2016). The long distance signalling concept considers that ABA is
14 reduced level of endogenous ABA generated by application of fluridone - a carotenoid synthesis inhibitor which reduces ABA production - was associated with the inhibition of root elongation and promotion of shoot elongation in maize (Saab et al., 1990). Additionally, under drought stress, shoot growth is usually more restricted than root growth, which can benefit the plant in maintaining an adjusted water supply from the soil to the shoot (Sharp, 2002). Saab et al (1990) concluded that at low water potentials (vermiculite - substrate), ABA accumulation plays an important role in both the maintenance of primary root elongation and the inhibition of shoot elongation, although Guo et al. (2009) found that exogenous application of ABA decreases the number of lateral roots. Under severe drought stress, ABA tends to maintain primary root growth and inhibit root branching, resulting in a deeper but less dense root system (Tardieu et al., 2010). In contrast, at high water potential (vermiculite - substrate), ABA-deficient mutants and fluridone applications have shown little effect on the elongation of root and shoot (Saab et al., 1990).
15 and grain set at almost all development stages (floret initiation, terminal spikelet formation, meiosis, and floret degeneration) of wheat (Wang et al., 2001).
Thus, ABA has different roles in the vegetative (source tissues) and reproductive (sink tissues) plant parts (Dolferus et al., 2011) and accumulation of high [ABA] in these tissues can show a positive or negative correlation with drought stress tolerance. These correlations also depend on the phenological stage of the plant.
1.6.2. Ethylene
In the 19th century, the Russian plant physiologist Neljubov (1879–1926) observed that etiolated pea seedlings grew horizontally in his laboratory but not outside and he firstly associated this growth habit to the presence of high concentrations of contaminating illuminating gas in his laboratory. Later, he showed that the active component of the illuminating gas was ethylene (ETH) (Abeles et al., 2012).
Ethylene is a gaseous plant hormone which is produced by almost all parts and organs of higher plants, and it is involved in a range of developmental processes, such as promoting senescence of plant organs, leaf abscission, fruit ripening, stem thickening, root hair development and adventitious root formation, but also retarding the stem elongation and floral development (Yang and Hoffman, 1984; Davies, 2004b; Sisler et al., 2006; Acharya and Assmann, 2009; Abeles et al., 2012). Ethylene synthesis is promoted by almost all biotic and abiotic stress conditions, such as flooding, changes in day length and light intensity, extremes of temperature, drought, pathogens and herbivore attack (Davies, 2004b; Cristescu et al., 2013).
16 flooding irrigation the immediate precursor of ethylene, 1-aminocycloprane-1-carboxylic acid (ACC), is accumulated in the roots as it cannot be transformed into ethylene due to the lack of oxygen which impedes the activity of ACC-oxidase (ACO) (Yang and Hoffman, 1984; Kende, 1993; Tholen et al., 2006; Van de Poel and Van Der Straeten, 2014). The ACC is therefore transported through the xylem sap to the shoot (Bradford and Yang, 1980) where it is converted into ethylene by ACO, which is already present in the leaves (English et al., 1995).
Ethylene is usually considered as a growth inhibitor mainly associated with the triple response in seedling plants, which is probably the most well-known effect of ethylene on plant growth: 1) inhibition of stem elongation, 2) thickening of the stem, and 3) formation of an apical hook (Guzmán and Ecker, 1990; Pierik et al., 2007; Abeles et al., 2012). Elucidating the impact of ethylene role on plant growth is now an active research area (Pierik et al., 2006, 2007). It has been demonstrated that when plants are under abiotic stress, ethylene, at low concentration, can be a promotor of growth. For example, when plants compete for light in a plant community, ethylene-insensitive plants show a reduced shoot growth rate, compared with the wild type which offers a shade avoidance response (Pierik et al., 2003, 2004, 2006). Fine tuning of plant growth rates and impacts on survival of plants, may depend on an interaction between hormones (such as ethylene and ABA e.g. Sharp and LeNoble, 2002 or ethylene and gibberellin e.g. Pierik
et al., 2004) and environmental stress. A low concentration of ethylene in wheat has shown
17 Ethylene has a negative effect on pollen fertility and anther development. In fact, anther dehiscence can be inhibited by an increase in ethylene concentration ([ETH]) (Campbell et al., 2001). Under heat stress conditions, ethylene synthesis often increases and Klassen and Bugbee (2004) suggested that the cause could be increased activity of the enzyme 1-aminocycloprane-1-carboxylic acid oxidase (ACO) which is a key enzyme in the synthesis of ethylene. Furthermore, Hays et al. (2007) showed that increased ethylene levels under heat stress lead to kernel abortion and Yang et al. (2007) showed that under drought stress, the application of ABA or amino-ethoxyvinylglycine (AVG - an inhibitor of ethylene synthesis), to the rice panicles during meiosis, significantly reduced spikelet sterility. Yang et al. (2006a, 2007) found that the grain filling rate after anthesis is enhanced in the basal and apical grains, in wheat and rice, when the ratio ABA/ethylene or ABA/ACC is increased.
Spollen et al. (2000) suggested that under drought stress, increased levels of endogenous ABA in roots are required to prevent an excess of ethylene production, which has a negative effect on root elongation, but ABA itself was not identified to have a root promoting effect. On the other hand, ethylene and its primary precursor ACC were observed to promote root hair initiation and elongation in synergy with auxin (Muday et al., 2012).
18 leaf senescence, increase the difficulty in identifying a specific role for ethylene in influencing drought tolerance and yield development (Wilkinson et al., 2012).
Recent research has shown that several plant drought stress responses can be explained most effectively as functions of the actions and interaction of two hormones, abscisic acid (ABA) and ethylene (Peleg and Blumwald, 2011; Davies et al., 2013). Plant hormone balance may control various plant growth and survival mechanism which are associated to a specific organ or tissue and can have an impact on yield crop performance (Wilkinson et al., 2012). Hormone balance may be a function of environmental factors and the crop’s developmental stage (Wilkinson et al., 2012). It has recently been suggested that ABA-ethylene concentration ratios can represent novel targets for plant selection and breeding programs for adaptation or for high yielding under drought stress (Yang et al., 2007; Wilkinson et al., 2012; Davies et al., 2013)
1.7. Research objectives and thesis structure
The aim of the work described in this thesis is to investigate whether plant hormone status (ethylene and ABA) has utility as a new secondary physiological trait for breeding selection during the pre-anthesis period when wheat plants are most sensitive to stress environments (from booting to heading stage). The extension of this work would be to develop an effective field-based high throughput method for selection of genotypes adapted to drought stress, to improve the efficiency of plant breeding programmes by reducing cost and time and improve agronomic practices.
19
The work in Chapter 3 was designed to better understand the complexity of yield responses to abiotic stress (heat and drought) and the interaction between genome and environments in terms of variation in the magnitude of yield components to define new selection criteria related to yield and spike fertility resilience under stress environment. This work allowed the identification of contrasting genotypes for further mechanistic research.
Chapter 4 describes new methodology to quantify plant hormone status (ethylene and ABA) under field conditions. Ethylene and ABA are quantified at different times in relation to the irrigation process.
In Chapter 5, the genetic variation in hormone accumulation and hormone balance was quantified under field conditions, to discover key phenological stage (s) and tissue (s) in the expression of resilience to drought stress during pre-anthesis.
In Chapter 6, hormone quantification and hormone balance evaluated under controlled environment conditions were related to field assessments of spike fertility at the same phenological stage and tissue as reported in Chapter 5.
20
Chapter 2.
A new crop screening method based on productivity and
resilience to abiotic stress
2.1. Introduction
In agriculture, drought is by far the most important environmental stress that constrains crop yield (Blum, 2011). More than 40 % of the world is classified as dry land, of which 8% is dry sub-humid area and 16% is semiarid area (Pretty et al., 2005; Middleton et al., 2011). In addition, increasing temperature is an important component of climate change and its negative impact on yield is expected to increase in the future. Indeed, it has been demonstrated that growing wheat crops under heat stress (30/25 Cº) can lead to a 30-35% reduction in yield grain weight, when compared with controls (18/13 Cº) (Wardlaw et al., 1989), and the importance of incorporating a heat tolerance trait into wheat germplasm has been highlighted (Sareen et al., 2012). Breeders need to develop genotypes with the capacity to yield significantly under heat stressed environments (Sareen et al., 2012). Therefore, understanding more about the mechanisms involved in plant tolerance/resilience to high temperature and drought stress becomes key for future improved crop production under stress as the climate in many food producing regions becomes hotter and drier (Blum, 2011; Macková et al., 2013).
21 which traits might identify genotypes with higher productivity under drought stress and the drought resilient ideotype is not always properly defined (Blum, 2005).
The term ‘stress tolerant genotype’ needs to be defined and properly characterised. The definitions of a drought tolerant genotype found in the literature vary substantially as a function of the field of research at issue (Ecological, Crop breeding and/or Crop physiology) and other considerations such as yield production (Turner, 1979; Fleury et al., 2010) or yield stability (Blum et al., 1989). In terms of physiological mechanism, it is also important to take into account that some genotypes, which can show a better yield performance under stress conditions, show an “escape strategy” by accelerating their phenology in order to avoid the intense stress during critical phenological stages. Genotypes with this kind of response should not be considered as drought resilient (Fischer and Maurer, 1978; Turner, 1979, 1986; Levitt, 1980).
Plant breeding programmes mainly focus on selecting genotypes which have high yield firstly under yield potential conditions (non-stress) and secondly under stress conditions (Monneveux
et al., 2012). To reach this aim, the classical postulate, widely accepted by breeders for
selection, is that a genotype with high yield potential will perform well under most environments (Blum, 2005). However, this selection method does not include the concept of yield stability neither does it consider adaptation to a stress environment. Such shortcomings can be a cause of slow progress in breeding (Ceccarelli and Grando, 1991; Blum, 1996).